Races in Guymon, Oklahoma (OK) Detailed Stats
Data:
Races - White alone (%)
Races - White alone (% change since 2000)
Races - Black alone (%)
Races - Black alone (% change since 2000)
Races - American Indian alone (%)
Races - American Indian alone (% change since 2000)
Races - Asian alone (%)
Races - Asian alone (% change since 2000)
Races - Hispanic (%)
Races - Hispanic (% change since 2000)
Races - Native Hawaiian and Other Pacific Islander alone (%)
Races - Native Hawaiian and Other Pacific Islander alone (% change since 2000)
Races - Two or more races(%)
Races - Two or more races(% change since 2000)
Races - Other race alone (%)
Races - Other race alone (% change since 2000)
Racial diversity
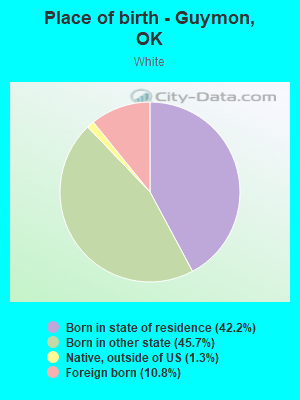
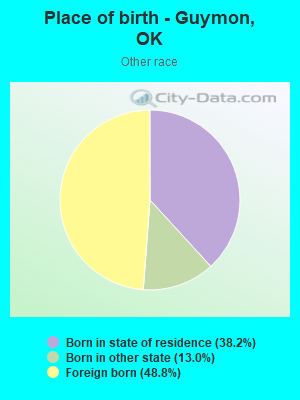
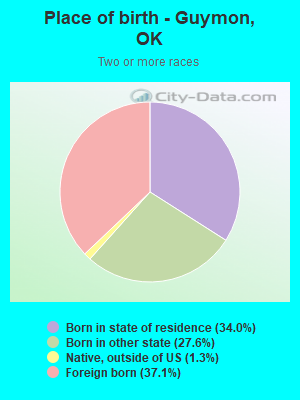
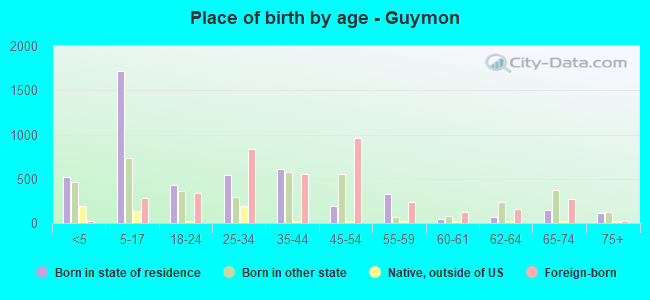
Place of birth - Born in state of residence (%)
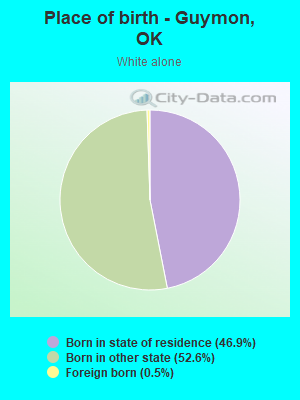
Place of birth - Born in state of residence (%) - White
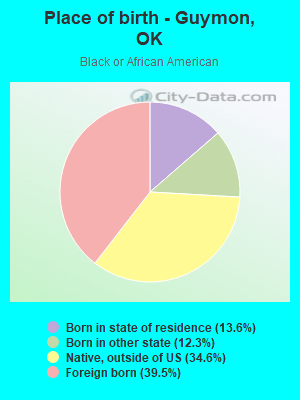
Place of birth - Born in state of residence (%) - Black or African American
Place of birth - Born in state of residence (%) - Asian
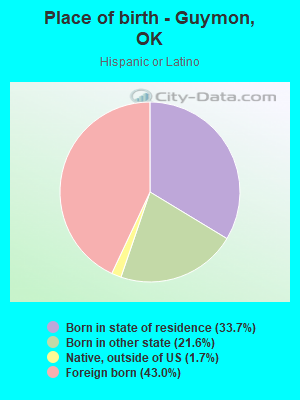
Place of birth - Born in state of residence (%) - Hispanic or Latino
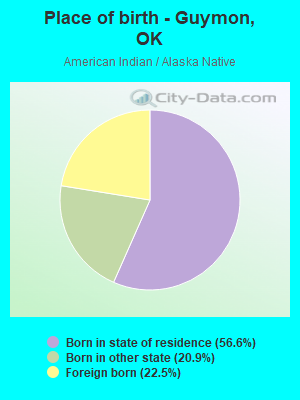
Place of birth - Born in state of residence (%) - American Indian and Alaska Native
Place of birth - Born in state of residence (%) - Multirace
Place of birth - Born in state of residence (%) - Other Race
Place of birth - Born in other state (%)
Place of birth - Born in other state (%) - White
Place of birth - Born in other state (%) - Black or African American
Place of birth - Born in other state (%) - Asian
Place of birth - Born in other state (%) - Hispanic or Latino
Place of birth - Born in other state (%) - American Indian and Alaska Native
Place of birth - Born in other state (%) - Multirace
Place of birth - Born in other state (%) - Other Race
Place of birth - Native, outside of US (%)
Place of birth - Native, outside of US (%) - White
Place of birth - Native, outside of US (%) - Black or African American
Place of birth - Native, outside of US (%) - Asian
Place of birth - Native, outside of US (%) - Hispanic or Latino
Place of birth - Native, outside of US (%) - American Indian and Alaska Native
Place of birth - Native, outside of US (%) - Multirace
Place of birth - Native, outside of US (%) - Other Race
Place of birth - Foreign born (%)
Place of birth - Foreign born (%) - White
Place of birth - Foreign born (%) - Black or African American
Place of birth - Foreign born (%) - Asian
Place of birth - Foreign born (%) - Hispanic or Latino
Place of birth - Foreign born (%) - American Indian and Alaska Native
Place of birth - Foreign born (%) - Multirace
Place of birth - Foreign born (%) - Other Race
Residents speaking English at home (%)
Residents speaking English at home - Born in the United States (%)
Residents speaking English at home - Native, born elsewhere (%)
Residents speaking English at home - Foreign born (%)
Residents speaking Spanish at home (%)
Residents speaking Spanish at home - Born in the United States (%)
Residents speaking Spanish at home - Native, born elsewhere (%)
Residents speaking Spanish at home - Foreign born (%)
Residents speaking other language at home (%)
Residents speaking other language at home - Born in the United States (%)
Residents speaking other language at home - Native, born elsewhere (%)
Residents speaking other language at home - Foreign born (%)
Marital status - Never married (%)
Marital status - Now married (%)
Marital status - Separated (%)
Marital status - Widowed (%)
Marital status - Divorced (%)
Ancestries Reported - Arab (%)
Ancestries Reported - Czech (%)
Ancestries Reported - Danish (%)
Ancestries Reported - Dutch (%)
Ancestries Reported - English (%)
Ancestries Reported - French (%)
Ancestries Reported - French Canadian (%)
Ancestries Reported - German (%)
Ancestries Reported - Greek (%)
Ancestries Reported - Hungarian (%)
Ancestries Reported - Irish (%)
Ancestries Reported - Italian (%)
Ancestries Reported - Lithuanian (%)
Ancestries Reported - Norwegian (%)
Ancestries Reported - Polish (%)
Ancestries Reported - Portuguese (%)
Ancestries Reported - Russian (%)
Ancestries Reported - Scotch-Irish (%)
Ancestries Reported - Scottish (%)
Ancestries Reported - Slovak (%)
Ancestries Reported - Subsaharan African (%)
Ancestries Reported - Swedish (%)
Ancestries Reported - Swiss (%)
Ancestries Reported - Ukrainian (%)
Ancestries Reported - United States (%)
Ancestries Reported - Welsh (%)
Ancestries Reported - West Indian (%)
Ancestries Reported - Other (%)
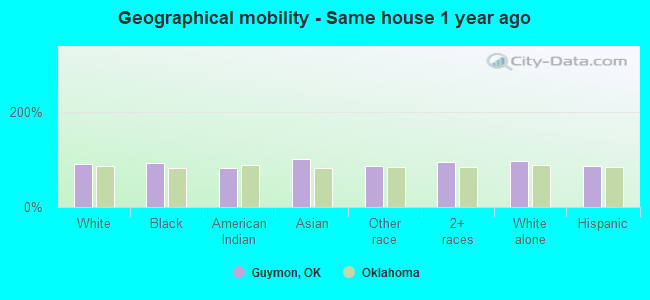
Geographical mobility - Same house 1 year ago (%)
Geographical mobility - Same house 1 year ago (%) - White
Geographical mobility - Same house 1 year ago (%) - Black or African American
Geographical mobility - Same house 1 year ago (%) - Asian
Geographical mobility - Same house 1 year ago (%) - Hispanic or Latino
Geographical mobility - Same house 1 year ago (%) - American Indian and Alaska Native
Geographical mobility - Same house 1 year ago (%) - Multirace
Geographical mobility - Same house 1 year ago (%) - Other Race
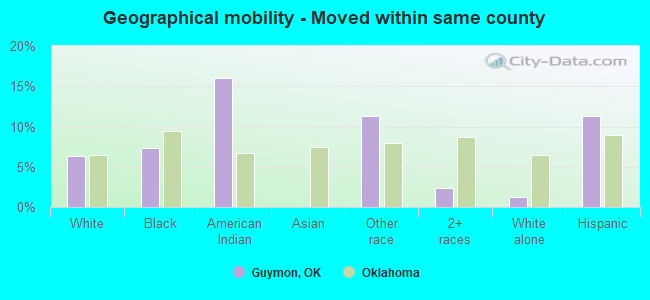
Geographical mobility - Moved within same county (%)
Geographical mobility - Moved within same county (%) - White
Geographical mobility - Moved within same county (%) - Black or African American
Geographical mobility - Moved within same county (%) - Asian
Geographical mobility - Moved within same county (%) - Hispanic or Latino
Geographical mobility - Moved within same county (%) - American Indian and Alaska Native
Geographical mobility - Moved within same county (%) - Multirace
Geographical mobility - Moved within same county (%) - Other Race
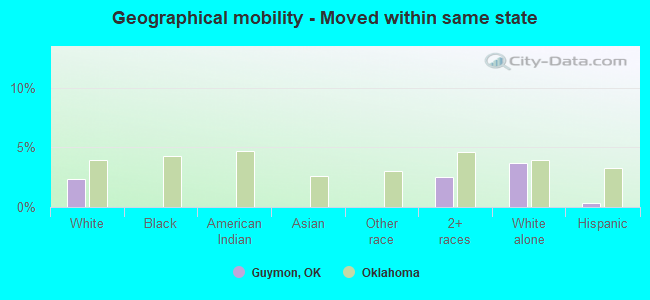
Geographical mobility - Moved from different county within same state (%)
Geographical mobility - Moved from different county within same state (%) - White
Geographical mobility - Moved from different county within same state (%) - Black or African American
Geographical mobility - Moved from different county within same state (%) - Asian
Geographical mobility - Moved from different county within same state (%) - Hispanic or Latino
Geographical mobility - Moved from different county within same state (%) - American Indian and Alaska Native
Geographical mobility - Moved from different county within same state (%) - Multirace
Geographical mobility - Moved from different county within same state (%) - Other Race
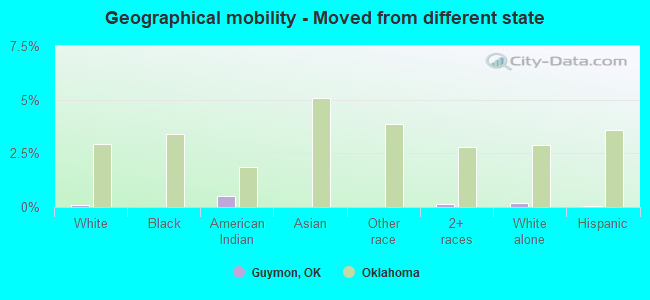
Geographical mobility - Moved from different state (%)
Geographical mobility - Moved from different state (%) - White
Geographical mobility - Moved from different state (%) - Black or African American
Geographical mobility - Moved from different state (%) - Asian
Geographical mobility - Moved from different state (%) - Hispanic or Latino
Geographical mobility - Moved from different state (%) - American Indian and Alaska Native
Geographical mobility - Moved from different state (%) - Multirace
Geographical mobility - Moved from different state (%) - Other Race
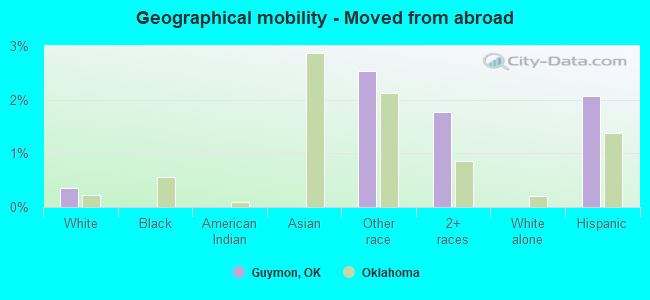
Geographical mobility - Moved from abroad (%)
Geographical mobility - Moved from abroad (%) - White
Geographical mobility - Moved from abroad (%) - Black or African American
Geographical mobility - Moved from abroad (%) - Asian
Geographical mobility - Moved from abroad (%) - Hispanic or Latino
Geographical mobility - Moved from abroad (%) - American Indian and Alaska Native
Geographical mobility - Moved from abroad (%) - Multirace
Geographical mobility - Moved from abroad (%) - Other Race
Place of birth for the foreign-born population - Ireland (%)
Place of birth for the foreign-born population - Denmark (%)
Place of birth for the foreign-born population - Norway (%)
Place of birth for the foreign-born population - Sweden (%)
Place of birth for the foreign-born population - United Kingdom (%)
Place of birth for the foreign-born population - England (%)
Place of birth for the foreign-born population - Scotland (%)
Place of birth for the foreign-born population - Other Northern Europe (%)
Place of birth for the foreign-born population - Austria (%)
Place of birth for the foreign-born population - Belgium (%)
Place of birth for the foreign-born population - France (%)
Place of birth for the foreign-born population - Germany (%)
Place of birth for the foreign-born population - Netherlands (%)
Place of birth for the foreign-born population - Switzerland (%)
Place of birth for the foreign-born population - Other Western Europe (%)
Place of birth for the foreign-born population - Greece (%)
Place of birth for the foreign-born population - Italy (%)
Place of birth for the foreign-born population - Portugal (%)
Place of birth for the foreign-born population - Spain (%)
Place of birth for the foreign-born population - Other Southern Europe (%)
Place of birth for the foreign-born population - Albania (%)
Place of birth for the foreign-born population - Belarus (%)
Place of birth for the foreign-born population - Bosnia and Herzegovina (%)
Place of birth for the foreign-born population - Bulgaria (%)
Place of birth for the foreign-born population - Croatia (%)
Place of birth for the foreign-born population - Czechoslovakia (%)
Place of birth for the foreign-born population - Hungary (%)
Place of birth for the foreign-born population - Latvia (%)
Place of birth for the foreign-born population - Lithuania (%)
Place of birth for the foreign-born population - North Macedonia (Macedonia) (%)
Place of birth for the foreign-born population - Moldova (%)
Place of birth for the foreign-born population - Poland (%)
Place of birth for the foreign-born population - Romania (%)
Place of birth for the foreign-born population - Russia (%)
Place of birth for the foreign-born population - Serbia (%)
Place of birth for the foreign-born population - Ukraine (%)
Place of birth for the foreign-born population - Other Eastern Europe (%)
Place of birth for the foreign-born population - China (%)
Place of birth for the foreign-born population - Hong Kong (%)
Place of birth for the foreign-born population - Taiwan (%)
Place of birth for the foreign-born population - Japan (%)
Place of birth for the foreign-born population - Korea (%)
Place of birth for the foreign-born population - Other Eastern Asia (%)
Place of birth for the foreign-born population - Afghanistan (%)
Place of birth for the foreign-born population - Bangladesh (%)
Place of birth for the foreign-born population - India (%)
Place of birth for the foreign-born population - Iran (%)
Place of birth for the foreign-born population - Kazakhstan (%)
Place of birth for the foreign-born population - Nepal (%)
Place of birth for the foreign-born population - Pakistan (%)
Place of birth for the foreign-born population - Sri Lanka (%)
Place of birth for the foreign-born population - Uzbekistan (%)
Place of birth for the foreign-born population - Other South Central Asia (%)
Place of birth for the foreign-born population - Burma (%)
Place of birth for the foreign-born population - Cambodia (%)
Place of birth for the foreign-born population - Indonesia (%)
Place of birth for the foreign-born population - Laos (%)
Place of birth for the foreign-born population - Malaysia (%)
Place of birth for the foreign-born population - Philippines (%)
Place of birth for the foreign-born population - Singapore (%)
Place of birth for the foreign-born population - Thailand (%)
Place of birth for the foreign-born population - Vietnam (%)
Place of birth for the foreign-born population - Other South Eastern Asia (%)
Place of birth for the foreign-born population - Armenia (%)
Place of birth for the foreign-born population - Iraq (%)
Place of birth for the foreign-born population - Israel (%)
Place of birth for the foreign-born population - Jordan (%)
Place of birth for the foreign-born population - Kuwait (%)
Place of birth for the foreign-born population - Lebanon (%)
Place of birth for the foreign-born population - Saudi Arabia (%)
Place of birth for the foreign-born population - Syria (%)
Place of birth for the foreign-born population - Turkey (%)
Place of birth for the foreign-born population - Yemen (%)
Place of birth for the foreign-born population - Other Western Asia (%)
Place of birth for the foreign-born population - Eritrea (%)
Place of birth for the foreign-born population - Ethiopia (%)
Place of birth for the foreign-born population - Kenya (%)
Place of birth for the foreign-born population - Somalia (%)
Place of birth for the foreign-born population - Uganda (%)
Place of birth for the foreign-born population - Zimbabwe (%)
Place of birth for the foreign-born population - Other Eastern Africa (%)
Place of birth for the foreign-born population - Cameroon (%)
Place of birth for the foreign-born population - Congo (%)
Place of birth for the foreign-born population - Democratic Republic of Congo (Zaire) (%)
Place of birth for the foreign-born population - Other Middle Africa (%)
Place of birth for the foreign-born population - Egypt (%)
Place of birth for the foreign-born population - Morocco (%)
Place of birth for the foreign-born population - Sudan (%)
Place of birth for the foreign-born population - Other Northern Africa (%)
Place of birth for the foreign-born population - South Africa (%)
Place of birth for the foreign-born population - Other Southern Africa (%)
Place of birth for the foreign-born population - Cabo Verde (%)
Place of birth for the foreign-born population - Ghana (%)
Place of birth for the foreign-born population - Liberia (%)
Place of birth for the foreign-born population - Nigeria (%)
Place of birth for the foreign-born population - Senegal (%)
Place of birth for the foreign-born population - Sierra Leone (%)
Place of birth for the foreign-born population - Other Western Africa (%)
Place of birth for the foreign-born population - Australia (%)
Place of birth for the foreign-born population - New Zealand (%)
Place of birth for the foreign-born population - Fiji (%)
Place of birth for the foreign-born population - Micronesia (%)
Place of birth for the foreign-born population - Bahamas (%)
Place of birth for the foreign-born population - Barbados (%)
Place of birth for the foreign-born population - Cuba (%)
Place of birth for the foreign-born population - Dominica (%)
Place of birth for the foreign-born population - Dominican Republic (%)
Place of birth for the foreign-born population - Grenada (%)
Place of birth for the foreign-born population - Haiti (%)
Place of birth for the foreign-born population - Jamaica (%)
Place of birth for the foreign-born population - St. Vincent and the Grenadines (%)
Place of birth for the foreign-born population - Trinidad and Tobago (%)
Place of birth for the foreign-born population - West Indies (%)
Place of birth for the foreign-born population - Other Caribbean (%)
Place of birth for the foreign-born population - Belize (%)
Place of birth for the foreign-born population - Costa Rica (%)
Place of birth for the foreign-born population - El Salvador (%)
Place of birth for the foreign-born population - Guatemala (%)
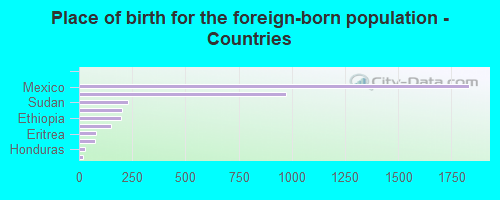
Place of birth for the foreign-born population - Honduras (%)
Place of birth for the foreign-born population - Mexico (%)
Place of birth for the foreign-born population - Nicaragua (%)
Place of birth for the foreign-born population - Panama (%)
Place of birth for the foreign-born population - Other Central America (%)
Place of birth for the foreign-born population - Argentina (%)
Place of birth for the foreign-born population - Bolivia (%)
Place of birth for the foreign-born population - Brazil (%)
Place of birth for the foreign-born population - Chile (%)
Place of birth for the foreign-born population - Colombia (%)
Place of birth for the foreign-born population - Ecuador (%)
Place of birth for the foreign-born population - Guyana (%)
Place of birth for the foreign-born population - Peru (%)
Place of birth for the foreign-born population - Uruguay (%)
Place of birth for the foreign-born population - Venezuela (%)
Place of birth for the foreign-born population - Other South America (%)
Place of birth for the foreign-born population - Canada (%)
Place of birth for the foreign-born population - Other Northern America (%)
Place of birth for the foreign-born population - Other (%)
Latest news about races in Guymon, OK collected exclusively by city-data.com from local newspapers, TV, and radio stations
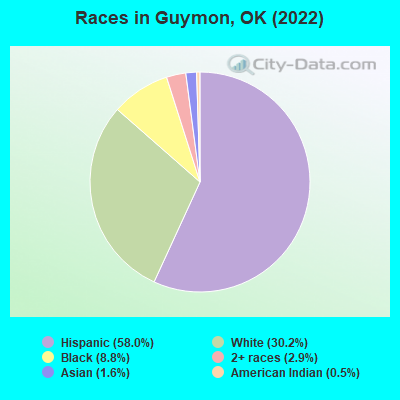
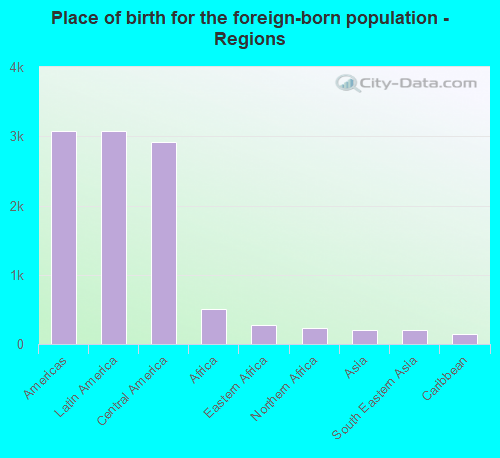
According to 2022 data, the most numerous races in Guymon, OK are White alone (3,900 residents), Hispanic (7,483 residents), and Two or more races (372 residents). 50.4% of Guymon residents speak English at home. 29.5% of Guymon, OK residents are foreign-born (24.2% born in Latin America, 4.0% born in Africa), which is 79.6% greater than the foreign-born rate of 6.0% across the entire state of Oklahoma.
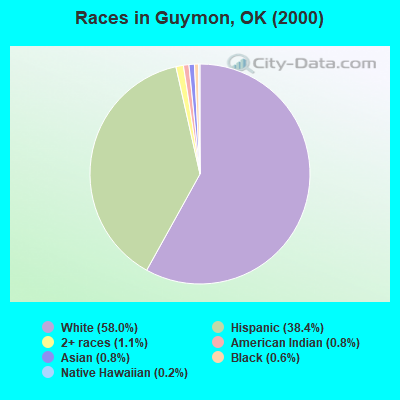
Race distribution in Guymon
2000 2022
2,556,368 74.1% White alone 266,158 7.7% American Indian alone 257,981 7.5% Black alone 179,304 5.2% Hispanic 140,249 4.1% Two or more races 46,172 1.3% Asian alone 2,322 0.07% Other race alone 2,100 0.06% Native Hawaiian and Other
2,517,403 62.6% White alone 486,692 12.1% Hispanic 364,453 9.1% Two or more races 273,650 6.8% American Indian alone 268,543 6.7% Black alone 92,672 2.3% Asian alone 10,786 0.3% Other race alone 5,601 0.1% Native Hawaiian and Other
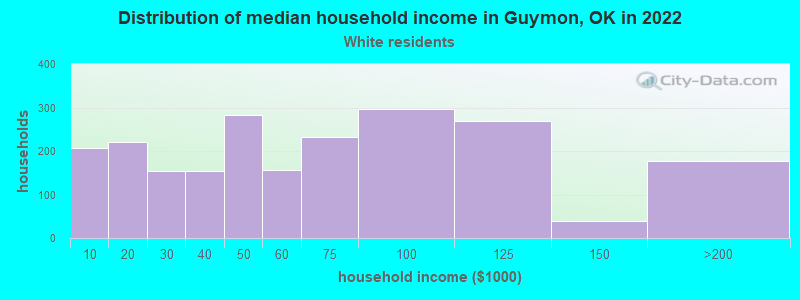
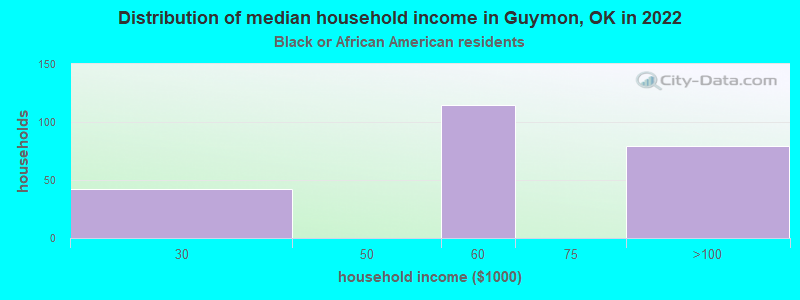
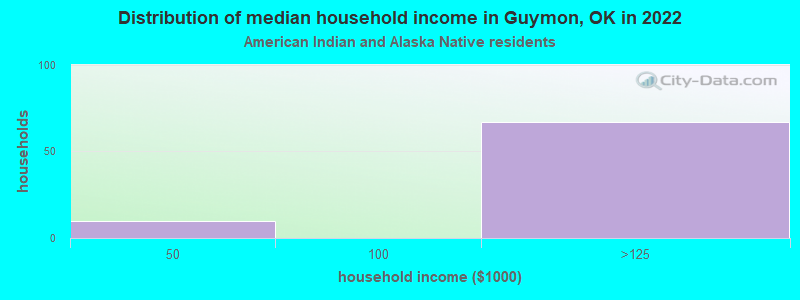
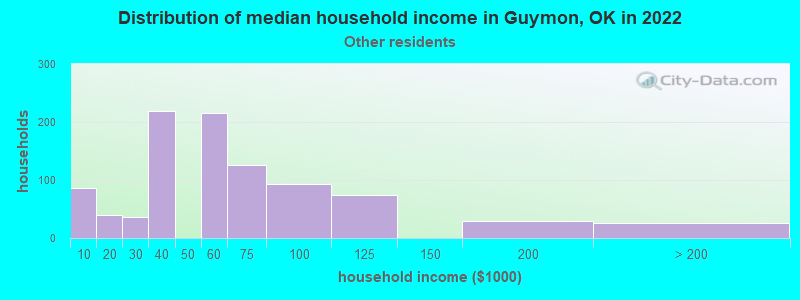
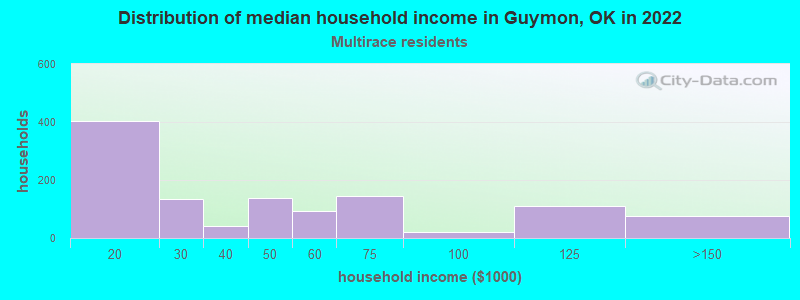
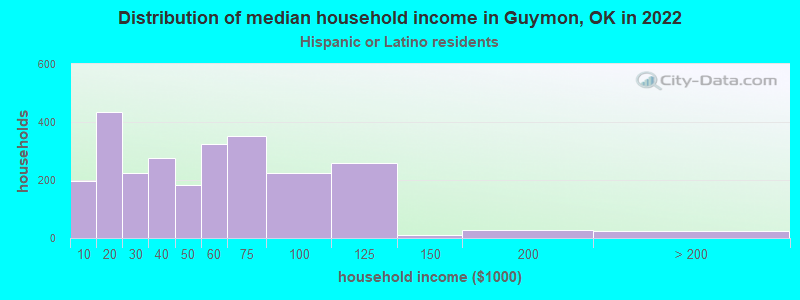
Income and house value in Guymon Median household income in 2022 $65,485 White non-Hispanic householders$54,205 Black householders$57,739 Some other race householders$39,353 Two or more races householders$46,835 Hispanic or Latino race householdersMedian 2022 house value $199,897 White Non-Hispanic householders$205,656 Black or African American householders$107,763 American Indian or Alaska Native householders $342,760 Asian householders$151,911 Some other race householders$143,959 Two or more races householders$163,702 Hispanic or Latino householders
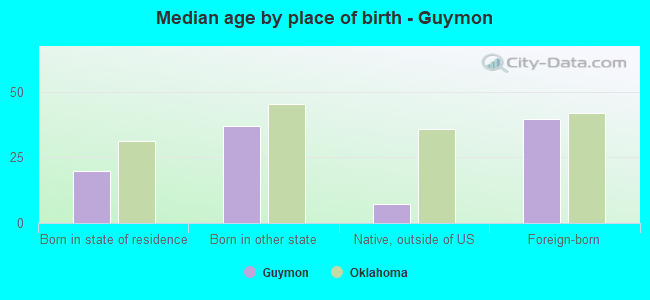
Median age by race in Guymon
35.3 Median age for White residents34.0 38.0 31.3 Median age for Black or African American residents31.3 44.1 24.7 Median age for American Indian / Alaska Native residents35.9 24.1 -662,745,097.4 Median age for Asian residents-662,601,625.4 -666,666,666.0 -725,225,224.5 Median age for Native Hawaiian / Pacific Islander residents-675,324,674.6 -767,251,461.2 24.6 Median age for Other race residents19.6 31.5 40.6 Median age for Two or more races residents40.2 37.7 42.8 Median age for White alone residents36.1 44.8 29.0 Median age for Hispanic or Latino residents28.5 30.2
Owner/renter occupied households by race in Guymon
House owners and renters - White residents 1,557 72.4% Owner occupied594 27.6% Renter occupiedHouse owners and renters - Black or African American residents 272 100.0% Renter occupiedHouse owners and renters - American Indian / Alaska Native residents 65 86.3% Owner occupied10 13.7% Renter occupiedHouse owners and renters - Other race residents 484 51.7% Owner occupied452 48.3% Renter occupiedHouse owners and renters - Two or more races residents 773 69.8% Owner occupied335 30.2% Renter occupiedHouse owners and renters - White alone residents 1,223 84.4% Owner occupied226 15.6% Renter occupiedHouse owners and renters - Hispanic or Latino residents 1,440 56.8% Owner occupied1,095 43.2% Renter occupied
Language usage in Guymon
English speakers - Total 50.4% of residents of Guymon speak English at home.
43.8% of residents speak Spanish at home 2,225 43.0% Speak English very well2,945 57.0% Speak English less than very well6.7% of residents speak other language at home 608 76.6% Speak English very well186 23.4% Speak English less than very well
English speakers - Born in the United States 80.0% of residents of Guymon speak English at home.
19.7% of residents speak Spanish at home 446 67.1% Speak English very well219 32.9% Speak English less than very well1.4% of residents speak other language at home 49 100.0% Speak English very well
English speakers - Native, born elsewhere 68.5% of residents of Guymon speak English at home.
33.2% of residents speak Spanish at home 8 6.8% Speak English very well110 93.2% Speak English less than very well
English speakers - Foreign-born 1.2% of residents of Guymon speak English at home.
80.3% of residents speak Spanish at home 602 19.7% Speak English very well2,450 80.3% Speak English less than very well19.9% of residents speak other language at home 565 74.8% Speak English very well190 25.2% Speak English less than very well
White (Caucasian) - Speak only English Native:
90.4% (4,093)Foreign-born:
7.1% (43)
White (Caucasian) - Speak another language Native:
7.2% (326)Foreign-born:
79.9% (489)
Other race - Speak another language Native:
94.4% (1,398)Foreign-born:
100.0% (1,643)
Two or more races - Speak another language Native:
36.1% (548)Foreign-born:
100.0% (1,020)
White alone - Speak only English Native:
99.7% (3,715)Foreign-born:
100.0% (20)
Hispanic or Latino - Speak only English Native:
37.6% (1,285)Foreign-born:
1.0% (31)
Hispanic or Latino - Speak another language Native:
61.9% (2,117)Foreign-born:
98.5% (3,154)
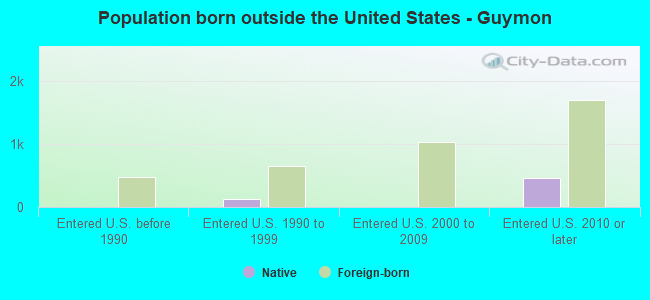
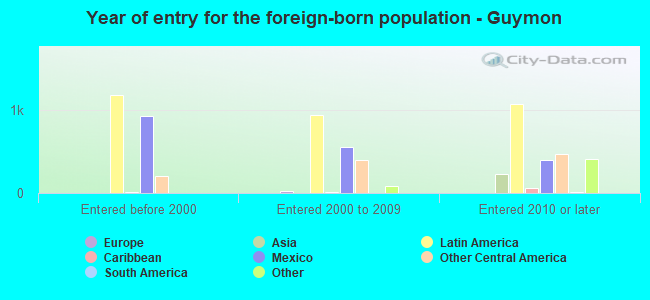
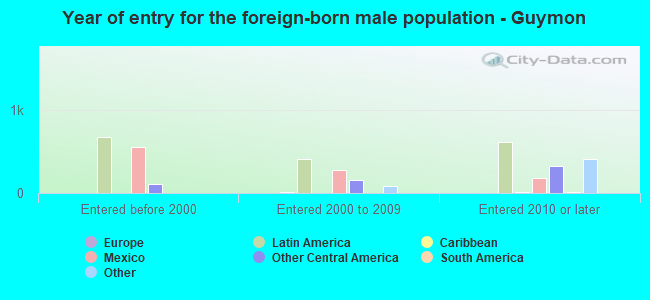
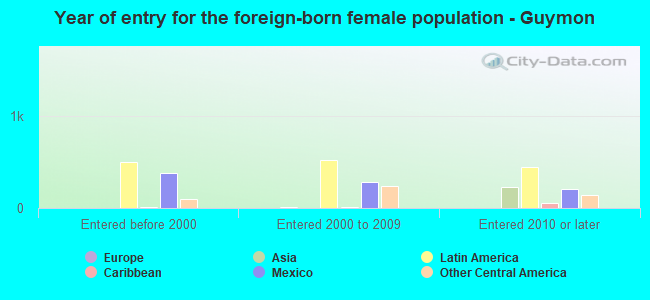
Foreign-born residents in Guymon 3,803 residents are foreign born (24.2% Latin America , 4.0% Africa ).
This city:
29.5%Oklahoma:
6.1%
Marital status for residents in Guymon Marital status - White (Caucasian) population 15 years and over
Males 43.6% Never married47.2% Now married0.3% Separated1.4% Widowed7.6% DivorcedFemales 25.1% Never married40.2% Now married0.4% Separated10.2% Widowed24.2% DivorcedWomen who gave birth in the past 12 months Now married:
67.0% (63)Unmarried:
33.0% (31)
Women who did not give birth in the past 12 months Now married:
43.2% (497)Unmarried:
56.8% (653)
Marital status - Black or African American population 15 years and over
Males 65.2% Never married24.0% Now married10.8% Separated0.0% Widowed0.0% DivorcedFemales 6.9% Never married93.1% Now married0.0% Separated0.0% Widowed0.0% DivorcedWomen who gave birth in the past 12 months Now married:
100.0% (115)Unmarried:
0.0% (0)
Women who did not give birth in the past 12 months Now married:
0.0% (0)Unmarried:
100.0% (8)
Marital status - American Indian / Alaska Native population 15 years and over
Males 22.4% Never married30.6% Now married0.0% Separated0.0% Widowed46.9% DivorcedFemales 51.9% Never married6.5% Now married0.0% Separated0.0% Widowed41.6% DivorcedWomen who gave birth in the past 12 months Now married:
100.0% (10)Unmarried:
0.0% (0)
Women who did not give birth in the past 12 months Now married:
0.0% (0)Unmarried:
100.0% (147)
Marital status - Other race population 15 years and over
Males 49.9% Never married32.9% Now married0.0% Separated0.0% Widowed17.2% DivorcedFemales 37.4% Never married39.1% Now married6.0% Separated1.2% Widowed16.3% DivorcedWomen who gave birth in the past 12 months Now married:
100.0% (14)Unmarried:
0.0% (0)
Women who did not give birth in the past 12 months Now married:
25.3% (211)Unmarried:
74.7% (623)
Marital status - Two or more races population 15 years and over
Males 25.9% Never married44.6% Now married0.3% Separated2.9% Widowed26.3% DivorcedFemales 58.8% Never married39.7% Now married0.0% Separated0.0% Widowed1.5% DivorcedWomen who did not give birth in the past 12 months Now married:
25.5% (128)Unmarried:
74.5% (374)
Marital status - White alone, not Hispanic / Latino population 15 years and over
Males 39.0% Never married48.8% Now married0.5% Separated2.1% Widowed9.6% DivorcedFemales 23.6% Never married34.8% Now married0.5% Separated14.1% Widowed27.1% DivorcedWomen who gave birth in the past 12 months Now married:
0.0% (0)Unmarried:
100.0% (32)
Women who did not give birth in the past 12 months Now married:
35.8% (273)Unmarried:
64.2% (491)
Marital status - Hispanic or Latino population 15 years and over
Males 41.4% Never married40.7% Now married0.1% Separated1.0% Widowed16.7% DivorcedFemales 40.3% Never married41.2% Now married2.7% Separated0.5% Widowed15.2% DivorcedWomen who gave birth in the past 12 months Now married:
100.0% (95)Unmarried:
0.0% (0)
Women who did not give birth in the past 12 months Now married:
30.9% (553)Unmarried:
69.1% (1,237)
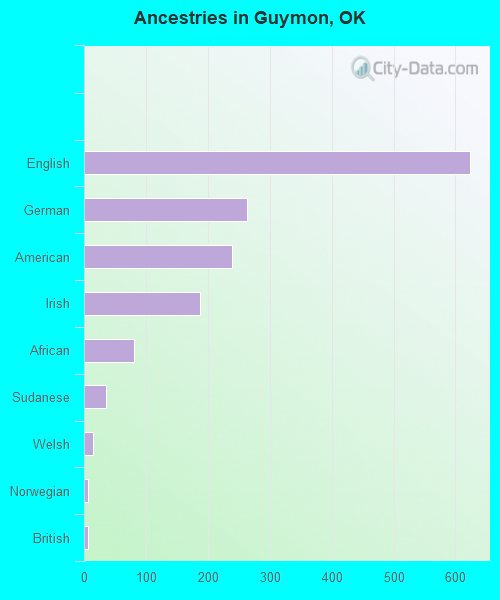
Ancestries in Guymon
623 7.7% English263 3.3% German239 3.0% American188 2.3% Irish80 1.0% African36 0.4% Sudanese14 0.2% Welsh7 0.09% Norwegian6 0.07% British5 0.06% European
Geographical mobility in Guymon Same house 1 year ago 5,439 90.7% White (Caucasian)1,002 93.0% Black or African American201 81.0% American Indian / Alaska Native211 100.0% Asian2,873 84.9% Other race2,368 94.9% Two or more races3,734 95.7% White alone, not Hispanic / Latino6,399 86.5% Hispanic or LatinoMoved within same county 381 6.4% White / Caucasian80 7.4% Black or African American40 16.0% American Indian / Alaska Native383 11.3% Other race58 2.3% Two or more races49 1.3% White alone, not Hispanic / Latino835 11.3% Hispanic or LatinoMoved within same state 140 2.3% White / Caucasian63 2.5% Two or more races143 3.7% White alone, not Hispanic / Latino23 0.3% Hispanic or LatinoMoved from different state 6 0.1% White / Caucasian1 0.5% American Indian / Alaska Native4 0.2% Two or more races6 0.2% White alone, not Hispanic / Latino3 0.0% Hispanic or LatinoMoved from abroad 22 0.4% White86 2.5% Other race44 1.8% Two or more races153 2.1% Hispanic or Latino
Children Nativity (place of birth) in Guymon
Children under 6 years - Living with two parents Both parents native 231 100.0% NativeBoth parents foreign-born 235 100.0% NativeOne native, one foreign-born parent 179 100.0% NativeChildren under 6 years - Living with one parent Native parent 320 100.0% NativeForeign-born parent 400 100.0% NativeChildren 6 to 17 years - Living with two parents Both parents native 731 100.0% NativeBoth parents foreign-born 374 87.6% Native53 12.4% Foreign-bornOne native, one foreign-born parent 121 33.6% Native240 66.4% Foreign-bornChildren 6 to 17 years - Living with one parent Native parent 401 100.0% NativeForeign-born parent 484 53.6% Native419 46.4% Foreign-born
Grandparents responsible for own grandchildren in Guymon
Grandparents (30 to 59 years) White / Caucasian 11 12.3% Responsible for grandchildren78 87.7% Not responsible for grandchildrenAmerican Indian / Alaska Native 5 100.0% Not responsible for grandchildrenOther race 15 43.5% Responsible for grandchildren19 56.5% Not responsible for grandchildrenWhite alone, not Hispanic / Latino 11 30.4% Responsible for grandchildren26 69.6% Not responsible for grandchildrenHispanic or Latino 16 16.2% Responsible for grandchildren80 83.8% Not responsible for grandchildrenGrandparents (60 years and over) White / Caucasian 23 26.0% Responsible for grandchildren64 74.0% Not responsible for grandchildrenOther race 18 100.0% Not responsible for grandchildrenWhite alone, not Hispanic / Latino 22 25.2% Responsible for grandchildren67 74.8% Not responsible for grandchildrenHispanic or Latino 14 100.0% Not responsible for grandchildren