Races in Halfway, Maryland (MD) Detailed Stats
Ancestries, Foreign-born residents, place of birth
Settings
X


Recent posts about races in Halfway, Maryland on our local forum with over 2,400,000 registered users:
 | Johns Hopkins Fall 2017 Reading/Lecture Series (0 replies) |
According to 2022 data, the most numerous races in Halfway, MD are White alone (8,610 residents), Black alone (172 residents), and Hispanic (385 residents). 90.8% of Halfway residents speak English at home. 4.1% of Halfway, MD residents are foreign-born (2.9% born in Latin America, 0.7% born in Asia), which is 287.1% less than the foreign-born rate of 16.0% across the entire state of Maryland.
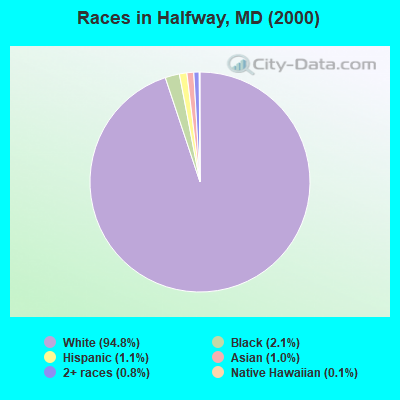
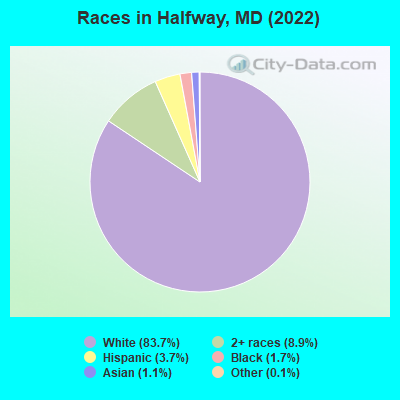
Race distribution in Halfway
2000
2022

- 9,54494.8%White alone
- 2102.1%Black alone
- 1101.1%Hispanic
- 971.0%Asian alone
- 790.8%Two or more races
- 120.1%Native Hawaiian and Other
Pacific Islander alone - 90.09%American Indian alone
- 40.04%Other race alone
-
- 8,61083.7%White alone
- 9118.9%Two or more races
- 3853.7%Hispanic
- 1721.7%Black alone
- 1111.1%Asian alone
- 110.1%Other race alone
- 30.03%American Indian alone
2000
2022
-
- 3,286,54762.1%White alone
- 1,464,73527.7%Black alone
- 227,9164.3%Hispanic
- 209,7384.0%Asian alone
- 82,9461.6%Two or more races
- 13,3120.3%American Indian alone
- 9,3790.2%Other race alone
- 1,9130.04%Native Hawaiian and Other
Pacific Islander alone

-
- 2,906,49247.1%White alone
- 1,800,91429.2%Black alone
- 705,84211.4%Hispanic
- 401,8186.5%Asian alone
- 291,3174.7%Two or more races
- 46,9300.8%Other race alone
- 8,9300.1%American Indian alone
- 2,4170.04%Native Hawaiian and Other
Pacific Islander alone

Income and house value in Halfway
- Median household income in 2022
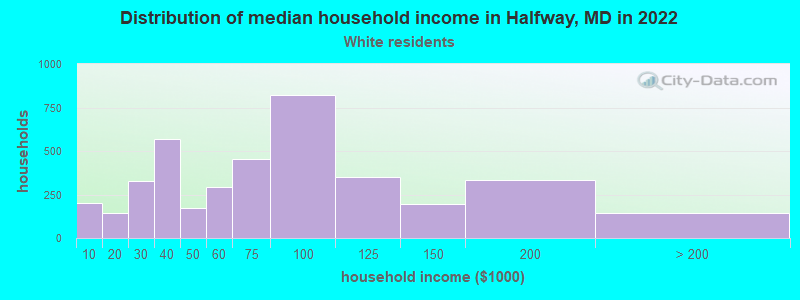
- $70,352White non-Hispanic householders
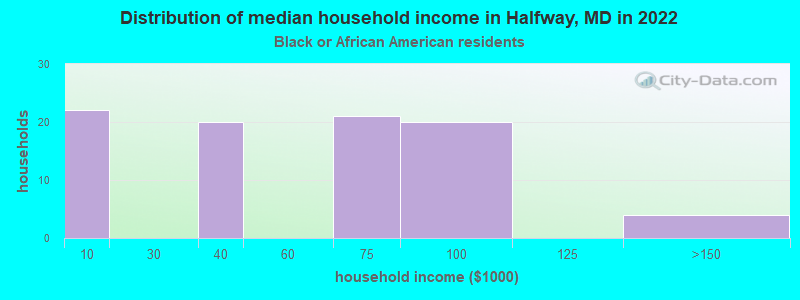
- $72,554Black householders
- $100,918Two or more races householders
- Median 2022 house value
- $265,516White Non-Hispanic householders
- $365,145Black or African American householders
- $332,500Asian householders
- $272,045Some other race householders
- $316,056Two or more races householders
- $309,769Hispanic or Latino householders
Household income for White non-Hispanic householders
Household income for Black householders
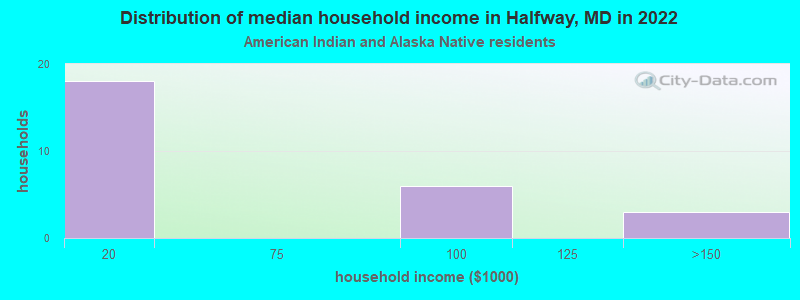
Household income for American Indian and Alaska Native householders
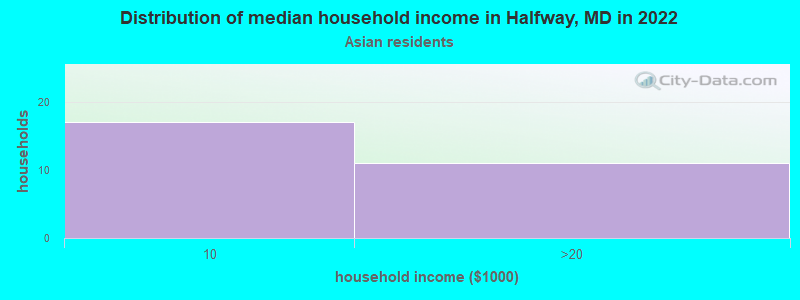
Household income for Asian householders
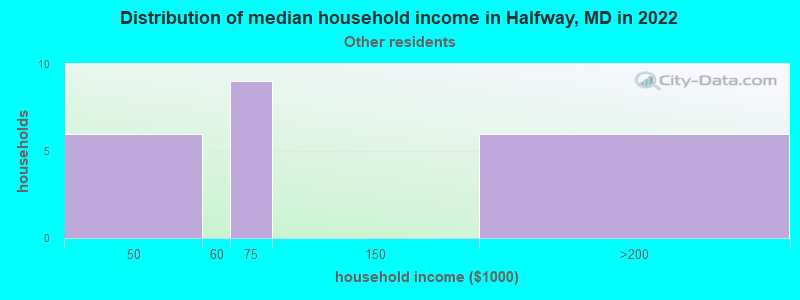
Household income for Some other race householders
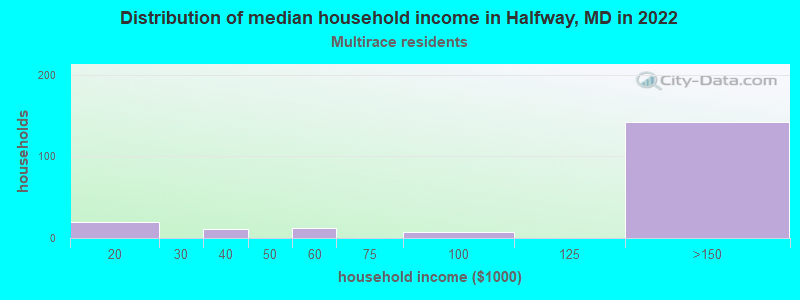
Household income for Two or more races householders
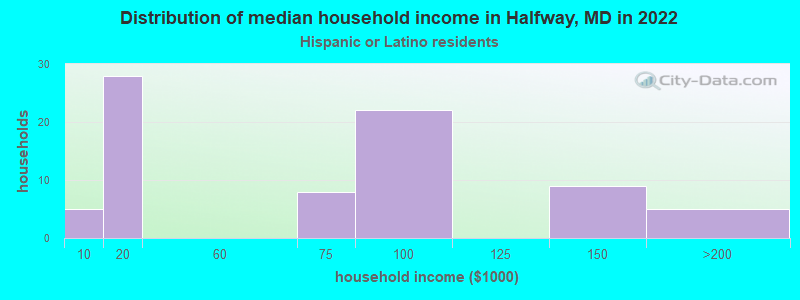
Household income for Hispanic or Latino race householders
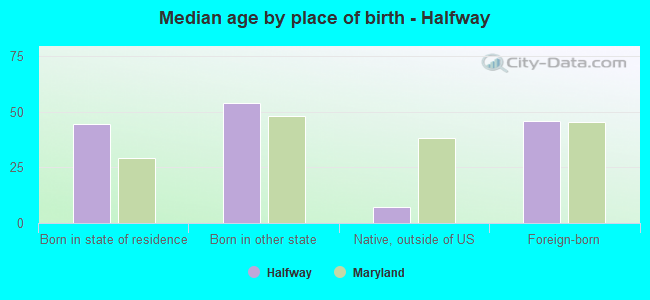
Median age by race in Halfway
- 49.1Median age for White residents
- 48.2Males
- 50.7Females
- 47.3Median age for Black or African American residents
- 73.1Males
- 42.2Females
- 28.1Median age for American Indian / Alaska Native residents
- 28.4Males
- 30.9Females
- 42.9Median age for Asian residents
- 0.0Males
- 58.7Females
- -763,333,332.6Median age for Native Hawaiian / Pacific Islander residents
- -720,061,021.4Males
- -760,942,760.2Females
- 22.5Median age for Other race residents
- 22.1Males
- 30.7Females
- 19.7Median age for Two or more races residents
- 21.7Males
- 15.8Females
- 48.8Median age for White alone residents
- 47.7Males
- 50.2Females
- 17.8Median age for Hispanic or Latino residents
- 21.2Males
- 23.1Females
Owner/renter occupied households by race in Halfway
- House owners and renters - White residents
- 2,89976.3%Owner occupied
- 90223.7%Renter occupied
- House owners and renters - Black or African American residents
- 2425.7%Owner occupied
- 6874.3%Renter occupied
- House owners and renters - American Indian / Alaska Native residents
- 1553.8%Owner occupied
- 1346.2%Renter occupied
- House owners and renters - Asian residents
- 2060.8%Owner occupied
- 1339.2%Renter occupied
- House owners and renters - Other race residents
- 1377.8%Owner occupied
- 422.2%Renter occupied
- House owners and renters - Two or more races residents
- 20980.9%Owner occupied
- 4919.1%Renter occupied
- House owners and renters - White alone residents
- 2,91176.3%Owner occupied
- 90423.7%Renter occupied
- House owners and renters - Hispanic or Latino residents
- 2931.9%Owner occupied
- 6368.1%Renter occupied
Language usage in Halfway
- English speakers - Total
- 90.8% of residents of Halfway speak English at home.
- 7.5% of residents speak Spanish at home
- 45561.3%Speak English very well
- 28738.7%Speak English less than very well
- 1.2% of residents speak other language at home
- 10385.8%Speak English very well
- 1714.2%Speak English less than very well
- English speakers - Born in the United States
- 96.4% of residents of Halfway speak English at home.
- 1.7% of residents speak Spanish at home
- 3278.0%Speak English very well
- 922.0%Speak English less than very well
- English speakers - Native, born elsewhere
- 43.6% of residents of Halfway speak English at home.
- 46.2% of residents speak Spanish at home
- 18100.0%Speak English very well
- 30.8% of residents speak other language at home
- 12100.0%Speak English very well
- English speakers - Foreign-born
- 4.0% of residents of Halfway speak English at home.
- 70.2% of residents speak Spanish at home
- 196.8%Speak English very well
- 26293.2%Speak English less than very well
- 20.8% of residents speak other language at home
- 6983.1%Speak English very well
- 1416.9%Speak English less than very well
White (Caucasian) - Speak only English
| Native: | 96.1% (7,896) |
| Foreign-born: | 4.9% (5) |
White (Caucasian) - Speak another language
| Native: | 4.0% (329) |
| Foreign-born: | 100.0% (110) |
Black or African American - Speak only English
| Native: | 98.5% (162) |
| Foreign-born: | 84.6% (5) |
Asian - Speak only English
| Native: | 60.1% (13) |
| Foreign-born: | 9.1% (5) |
Other race - Speak another language
| Native: | 47.3% (5) |
| Foreign-born: | 100.0% (40) |
Two or more races - Speak another language
| Native: | 5.7% (64) |
| Foreign-born: | 57.8% (27) |
White alone - Speak only English
| Native: | 96.2% (7,930) |
| Foreign-born: | 5.3% (6) |
White alone - Speak another language
| Native: | 3.8% (315) |
| Foreign-born: | 100.0% (113) |
Hispanic or Latino - Speak another language
| Native: | 25.4% (57) |
| Foreign-born: | 100.0% (110) |
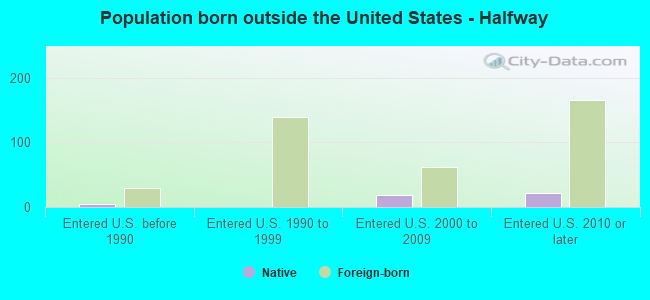
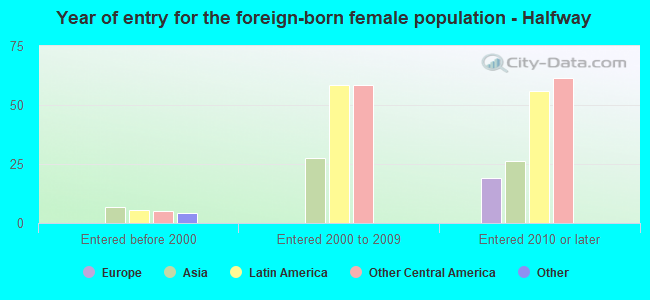
Foreign-born residents in Halfway
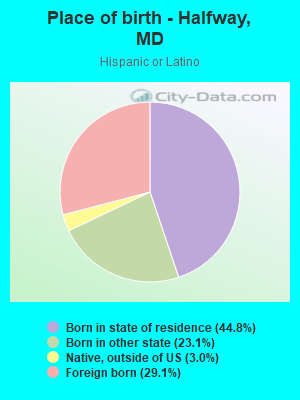
425 residents are foreign born (2.9% Latin America, 0.7% Asia).
| This city: | 4.1% |
| Maryland: | 15.7% |

Marital status for residents in Halfway
Marital status - White (Caucasian) population 15 years and over
- Males
- 30.8%Never married
- 57.1%Now married
- 0.0%Separated
- 2.5%Widowed
- 9.7%Divorced
- Females
- 23.0%Never married
- 48.4%Now married
- 2.7%Separated
- 10.7%Widowed
- 15.2%Divorced
Women who gave birth in the past 12 months
| Now married: | 18.2% (6) |
| Unmarried: | 81.8% (26) |
Women who did not give birth in the past 12 months
| Now married: | 46.6% (848) |
| Unmarried: | 53.4% (971) |
Marital status - Black or African American population 15 years and over
- Males
- 47.2%Never married
- 26.4%Now married
- 0.0%Separated
- 0.0%Widowed
- 26.4%Divorced
- Females
- 71.4%Never married
- 12.1%Now married
- 6.6%Separated
- 0.0%Widowed
- 9.9%Divorced
Women who did not give birth in the past 12 months
| Now married: | 10.9% (6) |
| Unmarried: | 89.1% (48) |
Marital status - American Indian / Alaska Native population 15 years and over
- Males
- 69.2%Never married
- 0.0%Now married
- 0.0%Separated
- 0.0%Widowed
- 30.8%Divorced
- Females
- 76.9%Never married
- 0.0%Now married
- 0.0%Separated
- 0.0%Widowed
- 23.1%Divorced
Women who did not give birth in the past 12 months
| Now married: | 0.0% (0) |
| Unmarried: | 100.0% (15) |
Marital status - Asian population 15 years and over
- Males
- 0.0%Never married
- 100.0%Now married
- 0.0%Separated
- 0.0%Widowed
- 0.0%Divorced
- Females
- 0.0%Never married
- 100.0%Now married
- 0.0%Separated
- 0.0%Widowed
- 0.0%Divorced
Women who gave birth in the past 12 months
| Now married: | 100.0% (13) |
| Unmarried: | 0.0% (0) |
Women who did not give birth in the past 12 months
| Now married: | 100.0% (29) |
| Unmarried: | 0.0% (0) |
Marital status - Other race population 15 years and over
- Males
- 65.0%Never married
- 35.0%Now married
- 0.0%Separated
- 0.0%Widowed
- 0.0%Divorced
- Females
- 0.0%Never married
- 100.0%Now married
- 0.0%Separated
- 0.0%Widowed
- 0.0%Divorced
Women who did not give birth in the past 12 months
| Now married: | 100.0% (23) |
| Unmarried: | 0.0% (0) |
Marital status - Two or more races population 15 years and over
- Males
- 61.4%Never married
- 4.3%Now married
- 33.4%Separated
- 0.0%Widowed
- 0.9%Divorced
- Females
- 90.3%Never married
- 2.2%Now married
- 0.0%Separated
- 7.5%Widowed
- 0.0%Divorced
Women who did not give birth in the past 12 months
| Now married: | 2.5% (6) |
| Unmarried: | 97.5% (238) |
Marital status - White alone, not Hispanic / Latino population 15 years and over
- Males
- 30.9%Never married
- 57.4%Now married
- 0.0%Separated
- 2.5%Widowed
- 9.3%Divorced
- Females
- 22.9%Never married
- 48.4%Now married
- 2.7%Separated
- 10.7%Widowed
- 15.2%Divorced
Women who gave birth in the past 12 months
| Now married: | 18.2% (6) |
| Unmarried: | 81.8% (26) |
Women who did not give birth in the past 12 months
| Now married: | 46.6% (851) |
| Unmarried: | 53.4% (973) |
Marital status - Hispanic or Latino population 15 years and over
- Males
- 66.7%Never married
- 15.5%Now married
- 0.0%Separated
- 0.0%Widowed
- 17.8%Divorced
- Females
- 87.7%Never married
- 12.3%Now married
- 0.0%Separated
- 0.0%Widowed
- 0.0%Divorced
Women who did not give birth in the past 12 months
| Now married: | 12.3% (18) |
| Unmarried: | 87.7% (131) |
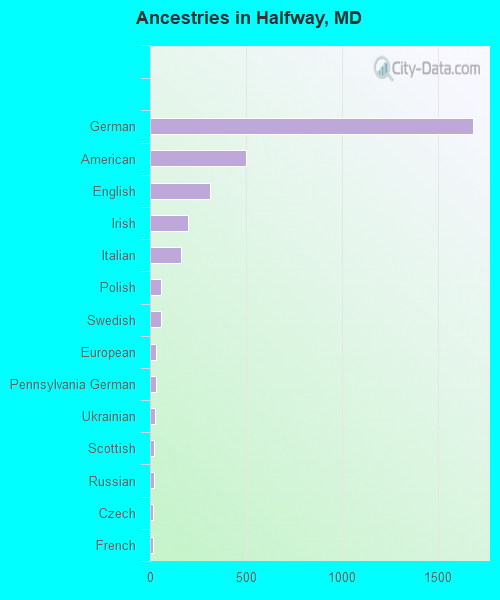
Ancestries in Halfway

- 1,68238.4%German
- 50211.5%American
- 3127.1%English
- 1984.5%Irish
- 1613.7%Italian
- 581.3%Polish
- 571.3%Swedish
- 330.8%European
- 310.7%Pennsylvania German
- 250.6%Ukrainian
- 230.5%Scottish
- 220.5%Russian
- 160.4%Czech
- 160.4%French
- 100.2%Eastern European
- 90.2%Dutch
- 70.2%British
- 60.1%Norwegian
- 30.07%Scotch-Irish
- 20.05%Greek
- 10.02%African
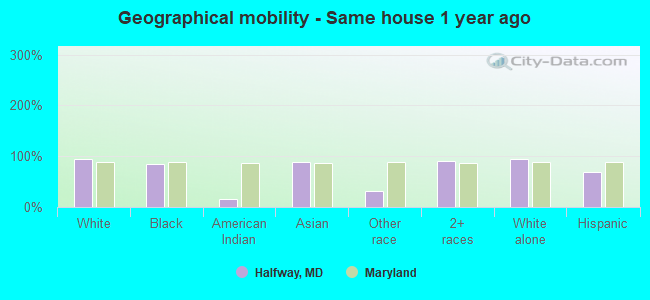
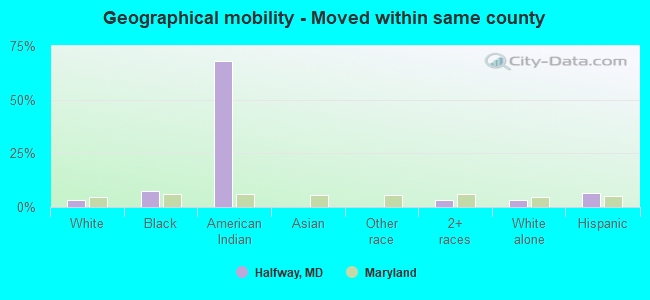
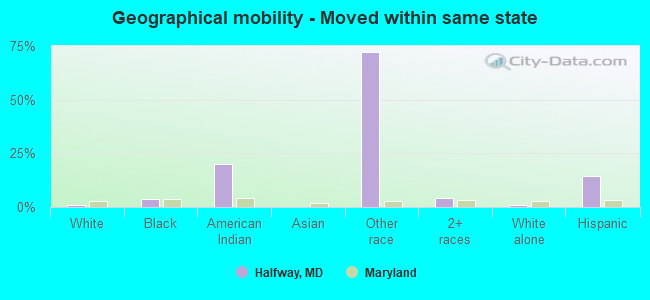
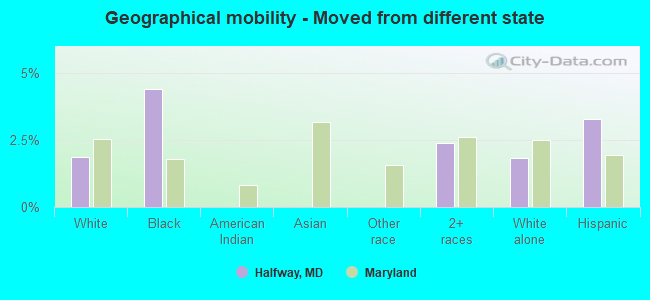
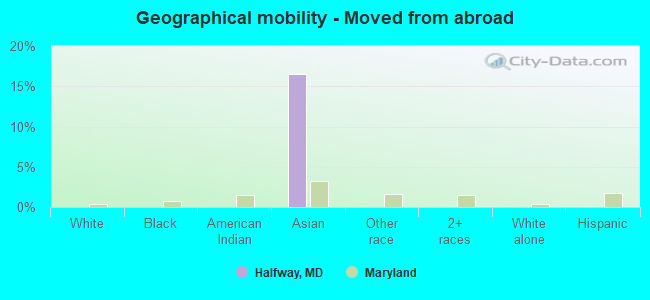
Geographical mobility in Halfway

- Same house 1 year ago
- 8,06894.8%White (Caucasian)
- 14985.0%Black or African American
- 1316.5%American Indian / Alaska Native
- 7789.2%Asian
- 1932.1%Other race
- 1,06590.8%Two or more races
- 8,10394.6%White alone, not Hispanic / Latino
- 25269.6%Hispanic or Latino
-
- Moved within same county
- 2713.2%White / Caucasian
- 137.5%Black or African American
- 5367.9%American Indian / Alaska Native
- 373.1%Two or more races
- 2823.3%White alone, not Hispanic / Latino
- 246.7%Hispanic or Latino
-
- Moved within same state
- 690.8%White / Caucasian
- 63.5%Black or African American
- 1620.2%American Indian / Alaska Native
- 4472.4%Other race
- 464.0%Two or more races
- 680.8%White alone, not Hispanic / Latino
- 5214.3%Hispanic or Latino
-
- Moved from different state
- 1581.9%White / Caucasian
- 84.4%Black or African American
- 282.4%Two or more races
- 1571.8%White alone, not Hispanic / Latino
- 123.3%Hispanic or Latino
-
- Moved from abroad
- 1416.5%Asian
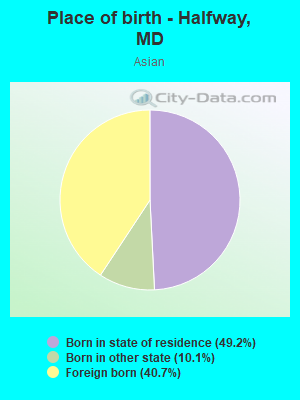
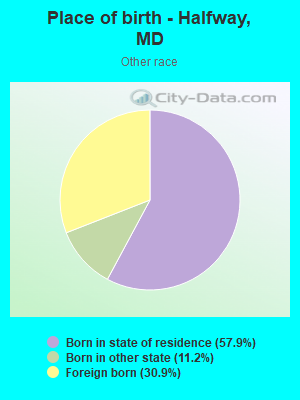
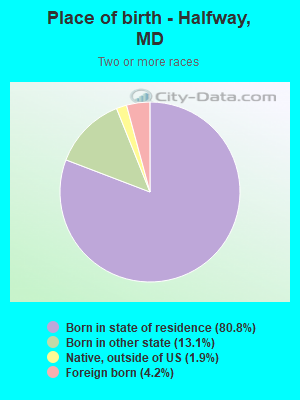
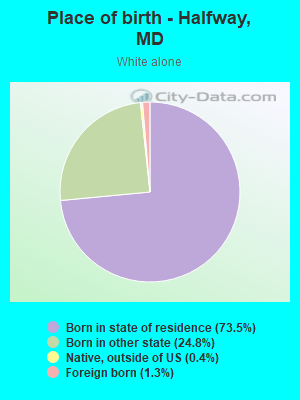
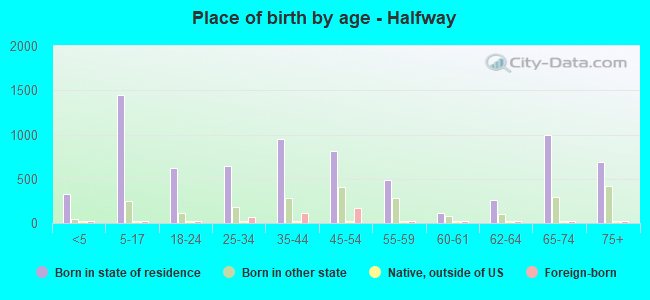
Children Nativity (place of birth) in Halfway
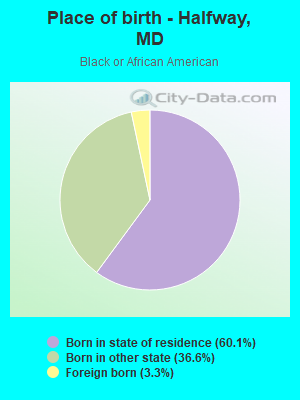
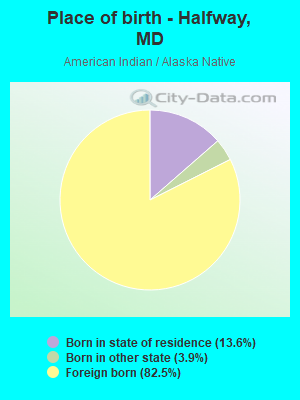
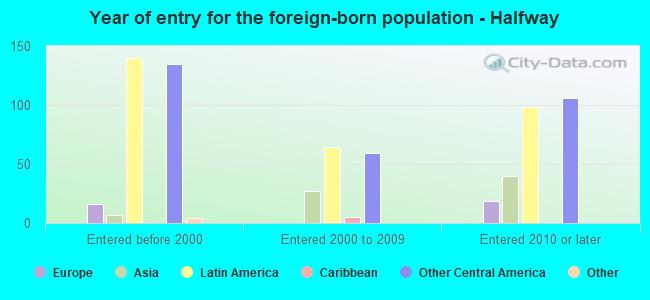
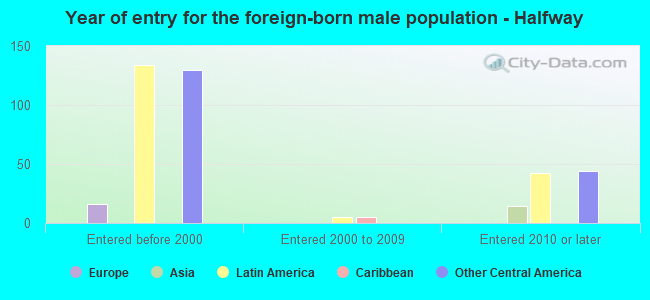
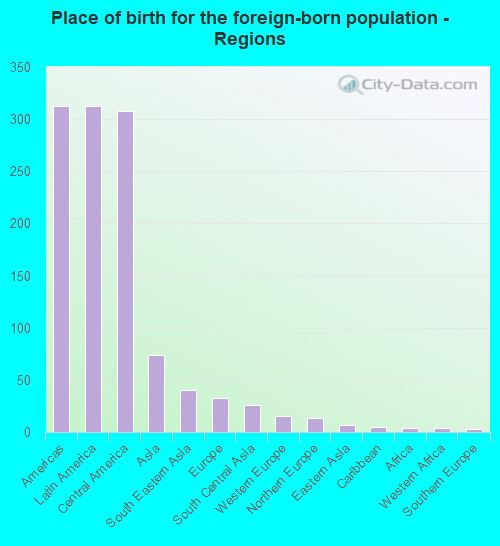
Place of birth for residents in Halfway
![Place of birth for the foreign-born population - Regions]()
- 313Americas
- 313Latin America
- 308Central America
- 74Asia
- 40South Eastern Asia
- 33Europe
- 26South Central Asia
- 15Western Europe
- 13Northern Europe
- 7Eastern Asia
- 5Caribbean
- 4Africa
- 4Western Africa
- 3Southern Europe
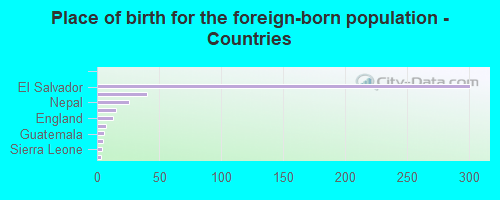
![Place of birth for the foreign-born population - Countries]()
- 301El Salvador
- 40Philippines
- 26Nepal
- 15Germany
- 13England
- 7Japan
- 6Guatemala
- 5Dominican Republic
- 4Sierra Leone
- 3Greece
Grandparents responsible for own grandchildren in Halfway
Zip codes: 21740.