Races in Hamer, South Carolina (SC) Detailed Stats
Ancestries, Foreign-born residents, place of birth
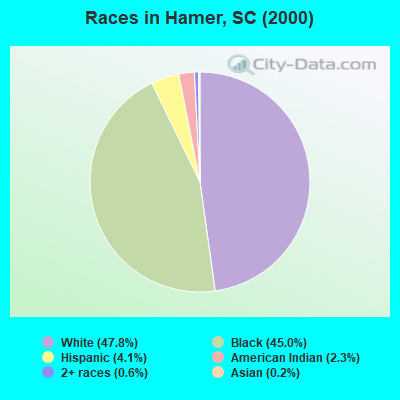
Race distribution in Hamer

- 2,56447.8%White alone
- 2,41345.0%Black alone
- 2204.1%Hispanic
- 1252.3%American Indian alone
- 310.6%Two or more races
- 100.2%Asian alone
- 20.04%Other race alone
- 20.04%Native Hawaiian and Other
Pacific Islander alone
2000
2022
-
- 2,652,29166.1%White alone
- 1,178,48629.4%Black alone
- 95,0762.4%Hispanic
- 35,5680.9%Asian alone
- 33,2900.8%Two or more races
- 12,7650.3%American Indian alone
- 3,2660.08%Other race alone
- 1,2700.03%Native Hawaiian and Other
Pacific Islander alone

-
- 3,301,73962.5%White alone
- 1,313,29024.9%Black alone
- 343,7836.5%Hispanic
- 190,5083.6%Two or more races
- 89,8881.7%Asian alone
- 29,3900.6%Other race alone
- 12,1120.2%American Indian alone
- 1,9240.04%Native Hawaiian and Other
Pacific Islander alone

Income and house value in Hamer
- Median household income in 2022
- $50,934White non-Hispanic householders
- $46,945Black householders
- $39,794American Indian and Alaska Native householders
- $41,664Asian householders
- $42,327Some other race householders
- over $200,000Two or more races householders
- $41,466Hispanic or Latino race householders
- Median 2022 house value
- $136,382White Non-Hispanic householders
- $129,637Black or African American householders
- $289,840American Indian or Alaska Native householders
- $474,283Asian householders
Household income for White non-Hispanic householders

Household income for Black householders

Household income for American Indian and Alaska Native householders

Household income for Asian householders

Household income for Two or more races householders

Household income for Hispanic or Latino race householders

Zip code: 29547