Races in Hamilton, Indiana (IN) Detailed Stats
Ancestries, Foreign-born residents, place of birth

Data:
Latest news about races in Hamilton, IN collected exclusively by city-data.com from local newspapers, TV, and radio stations
0.2% of Hamilton, IN residents are foreign-born , which is 2366.0% less than the foreign-born rate of 6.0% across the entire state of Indiana.
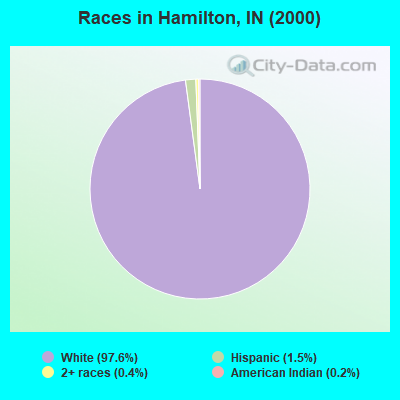
Race distribution in Hamilton

- 1,20397.6%White alone
- 191.5%Hispanic
- 50.4%Two or more races
- 30.2%American Indian alone
- 10.08%Black alone
- 10.08%Asian alone
- 10.08%Native Hawaiian and Other
Pacific Islander alone
2000
2022
-
- 5,219,37385.8%White alone
- 505,4628.3%Black alone
- 214,5363.5%Hispanic
- 61,1151.0%Two or more races
- 58,4241.0%Asian alone
- 13,6540.2%American Indian alone
- 6,3480.1%Other race alone
- 1,5730.03%Native Hawaiian and Other
Pacific Islander alone
-
- 5,192,45576.0%White alone
- 628,0549.2%Black alone
- 534,5287.8%Hispanic
- 263,2423.9%Two or more races
- 172,8802.5%Asian alone
- 33,4670.5%Other race alone
- 5,8660.09%American Indian alone
- 2,5450.04%Native Hawaiian and Other
Pacific Islander alone
Income and house value in Hamilton
- Median household income in 2022
- $64,983White non-Hispanic householders
- $96,790Some other race householders
- $44,877Two or more races householders
- $97,511Hispanic or Latino race householders
- Median 2022 house value
- $204,270White Non-Hispanic householders
- $243,179Some other race householders
- $243,179Hispanic or Latino householders
Foreign-born residents in Hamilton
3 residents are foreign born
| This city: | 0.2% |
| Indiana: | 3.1% |
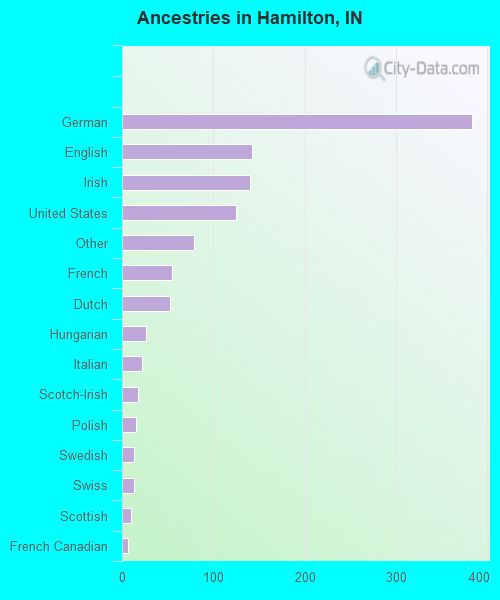
Ancestries in Hamilton

- 38334.5%German
- 14212.8%English
- 14012.6%Irish
- 12511.3%United States
- 797.1%Other
- 555.0%French
- 534.8%Dutch
- 262.3%Hungarian
- 222.0%Italian
- 181.6%Scotch-Irish
- 151.4%Polish
- 131.2%Swedish
- 131.2%Swiss
- 100.9%Scottish
- 70.6%French Canadian
- 20.2%Czech
- 20.2%Norwegian
- 20.2%Slovak
- 20.2%Welsh