Races in Hammond, Indiana (IN) Detailed Stats
Data:
Races - White alone (%)
Races - White alone (% change since 2000)
Races - Black alone (%)
Races - Black alone (% change since 2000)
Races - American Indian alone (%)
Races - American Indian alone (% change since 2000)
Races - Asian alone (%)
Races - Asian alone (% change since 2000)
Races - Hispanic (%)
Races - Hispanic (% change since 2000)
Races - Native Hawaiian and Other Pacific Islander alone (%)
Races - Native Hawaiian and Other Pacific Islander alone (% change since 2000)
Races - Two or more races(%)
Races - Two or more races(% change since 2000)
Races - Other race alone (%)
Races - Other race alone (% change since 2000)
Racial diversity
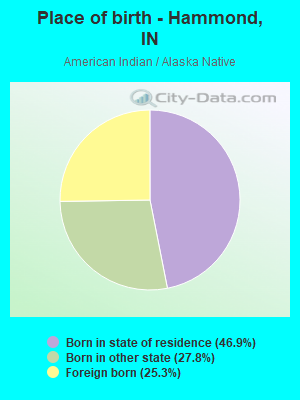
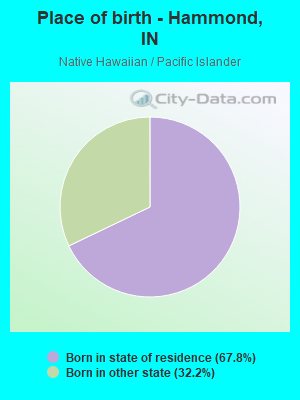
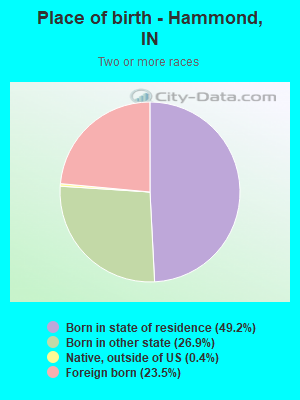
Place of birth - Born in state of residence (%)
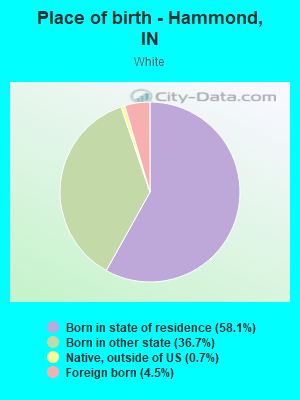
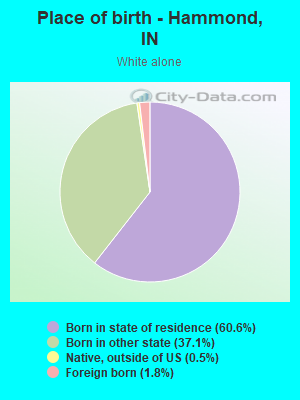
Place of birth - Born in state of residence (%) - White
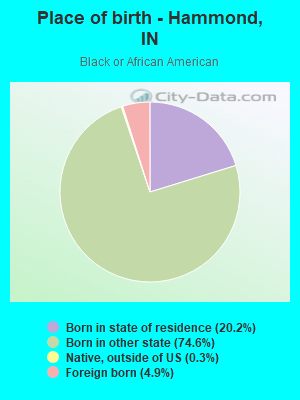
Place of birth - Born in state of residence (%) - Black or African American
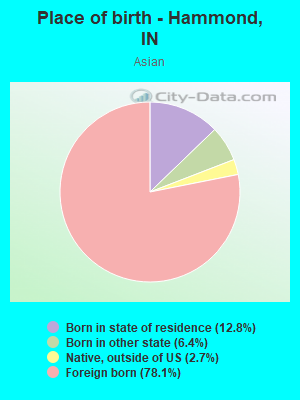
Place of birth - Born in state of residence (%) - Asian
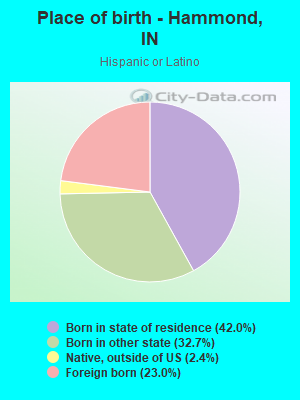
Place of birth - Born in state of residence (%) - Hispanic or Latino
Place of birth - Born in state of residence (%) - American Indian and Alaska Native
Place of birth - Born in state of residence (%) - Multirace
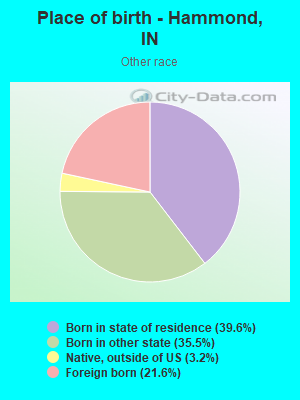
Place of birth - Born in state of residence (%) - Other Race
Place of birth - Born in other state (%)
Place of birth - Born in other state (%) - White
Place of birth - Born in other state (%) - Black or African American
Place of birth - Born in other state (%) - Asian
Place of birth - Born in other state (%) - Hispanic or Latino
Place of birth - Born in other state (%) - American Indian and Alaska Native
Place of birth - Born in other state (%) - Multirace
Place of birth - Born in other state (%) - Other Race
Place of birth - Native, outside of US (%)
Place of birth - Native, outside of US (%) - White
Place of birth - Native, outside of US (%) - Black or African American
Place of birth - Native, outside of US (%) - Asian
Place of birth - Native, outside of US (%) - Hispanic or Latino
Place of birth - Native, outside of US (%) - American Indian and Alaska Native
Place of birth - Native, outside of US (%) - Multirace
Place of birth - Native, outside of US (%) - Other Race
Place of birth - Foreign born (%)
Place of birth - Foreign born (%) - White
Place of birth - Foreign born (%) - Black or African American
Place of birth - Foreign born (%) - Asian
Place of birth - Foreign born (%) - Hispanic or Latino
Place of birth - Foreign born (%) - American Indian and Alaska Native
Place of birth - Foreign born (%) - Multirace
Place of birth - Foreign born (%) - Other Race
Residents speaking English at home (%)
Residents speaking English at home - Born in the United States (%)
Residents speaking English at home - Native, born elsewhere (%)
Residents speaking English at home - Foreign born (%)
Residents speaking Spanish at home (%)
Residents speaking Spanish at home - Born in the United States (%)
Residents speaking Spanish at home - Native, born elsewhere (%)
Residents speaking Spanish at home - Foreign born (%)
Residents speaking other language at home (%)
Residents speaking other language at home - Born in the United States (%)
Residents speaking other language at home - Native, born elsewhere (%)
Residents speaking other language at home - Foreign born (%)
Marital status - Never married (%)
Marital status - Now married (%)
Marital status - Separated (%)
Marital status - Widowed (%)
Marital status - Divorced (%)
Ancestries Reported - Arab (%)
Ancestries Reported - Czech (%)
Ancestries Reported - Danish (%)
Ancestries Reported - Dutch (%)
Ancestries Reported - English (%)
Ancestries Reported - French (%)
Ancestries Reported - French Canadian (%)
Ancestries Reported - German (%)
Ancestries Reported - Greek (%)
Ancestries Reported - Hungarian (%)
Ancestries Reported - Irish (%)
Ancestries Reported - Italian (%)
Ancestries Reported - Lithuanian (%)
Ancestries Reported - Norwegian (%)
Ancestries Reported - Polish (%)
Ancestries Reported - Portuguese (%)
Ancestries Reported - Russian (%)
Ancestries Reported - Scotch-Irish (%)
Ancestries Reported - Scottish (%)
Ancestries Reported - Slovak (%)
Ancestries Reported - Subsaharan African (%)
Ancestries Reported - Swedish (%)
Ancestries Reported - Swiss (%)
Ancestries Reported - Ukrainian (%)
Ancestries Reported - United States (%)
Ancestries Reported - Welsh (%)
Ancestries Reported - West Indian (%)
Ancestries Reported - Other (%)
Geographical mobility - Same house 1 year ago (%)
Geographical mobility - Same house 1 year ago (%) - White
Geographical mobility - Same house 1 year ago (%) - Black or African American
Geographical mobility - Same house 1 year ago (%) - Asian
Geographical mobility - Same house 1 year ago (%) - Hispanic or Latino
Geographical mobility - Same house 1 year ago (%) - American Indian and Alaska Native
Geographical mobility - Same house 1 year ago (%) - Multirace
Geographical mobility - Same house 1 year ago (%) - Other Race
Geographical mobility - Moved within same county (%)
Geographical mobility - Moved within same county (%) - White
Geographical mobility - Moved within same county (%) - Black or African American
Geographical mobility - Moved within same county (%) - Asian
Geographical mobility - Moved within same county (%) - Hispanic or Latino
Geographical mobility - Moved within same county (%) - American Indian and Alaska Native
Geographical mobility - Moved within same county (%) - Multirace
Geographical mobility - Moved within same county (%) - Other Race
Geographical mobility - Moved from different county within same state (%)
Geographical mobility - Moved from different county within same state (%) - White
Geographical mobility - Moved from different county within same state (%) - Black or African American
Geographical mobility - Moved from different county within same state (%) - Asian
Geographical mobility - Moved from different county within same state (%) - Hispanic or Latino
Geographical mobility - Moved from different county within same state (%) - American Indian and Alaska Native
Geographical mobility - Moved from different county within same state (%) - Multirace
Geographical mobility - Moved from different county within same state (%) - Other Race
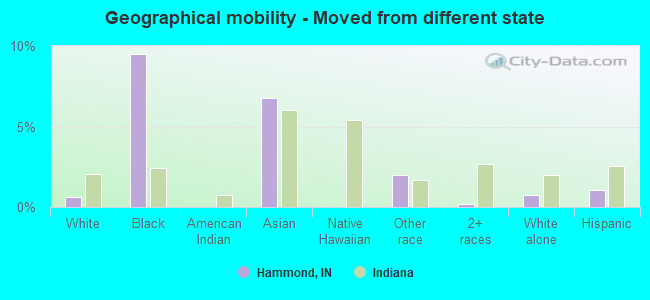
Geographical mobility - Moved from different state (%)
Geographical mobility - Moved from different state (%) - White
Geographical mobility - Moved from different state (%) - Black or African American
Geographical mobility - Moved from different state (%) - Asian
Geographical mobility - Moved from different state (%) - Hispanic or Latino
Geographical mobility - Moved from different state (%) - American Indian and Alaska Native
Geographical mobility - Moved from different state (%) - Multirace
Geographical mobility - Moved from different state (%) - Other Race
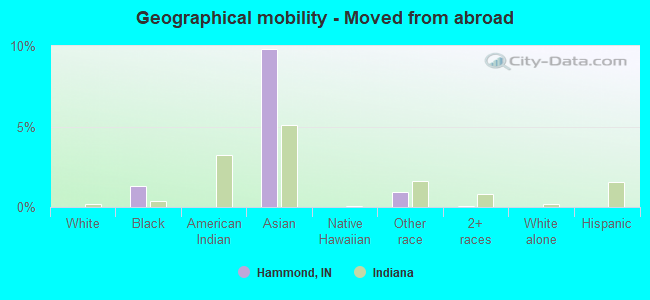
Geographical mobility - Moved from abroad (%)
Geographical mobility - Moved from abroad (%) - White
Geographical mobility - Moved from abroad (%) - Black or African American
Geographical mobility - Moved from abroad (%) - Asian
Geographical mobility - Moved from abroad (%) - Hispanic or Latino
Geographical mobility - Moved from abroad (%) - American Indian and Alaska Native
Geographical mobility - Moved from abroad (%) - Multirace
Geographical mobility - Moved from abroad (%) - Other Race
Place of birth for the foreign-born population - Ireland (%)
Place of birth for the foreign-born population - Denmark (%)
Place of birth for the foreign-born population - Norway (%)
Place of birth for the foreign-born population - Sweden (%)
Place of birth for the foreign-born population - United Kingdom (%)
Place of birth for the foreign-born population - England (%)
Place of birth for the foreign-born population - Scotland (%)
Place of birth for the foreign-born population - Other Northern Europe (%)
Place of birth for the foreign-born population - Austria (%)
Place of birth for the foreign-born population - Belgium (%)
Place of birth for the foreign-born population - France (%)
Place of birth for the foreign-born population - Germany (%)
Place of birth for the foreign-born population - Netherlands (%)
Place of birth for the foreign-born population - Switzerland (%)
Place of birth for the foreign-born population - Other Western Europe (%)
Place of birth for the foreign-born population - Greece (%)
Place of birth for the foreign-born population - Italy (%)
Place of birth for the foreign-born population - Portugal (%)
Place of birth for the foreign-born population - Spain (%)
Place of birth for the foreign-born population - Other Southern Europe (%)
Place of birth for the foreign-born population - Albania (%)
Place of birth for the foreign-born population - Belarus (%)
Place of birth for the foreign-born population - Bosnia and Herzegovina (%)
Place of birth for the foreign-born population - Bulgaria (%)
Place of birth for the foreign-born population - Croatia (%)
Place of birth for the foreign-born population - Czechoslovakia (%)
Place of birth for the foreign-born population - Hungary (%)
Place of birth for the foreign-born population - Latvia (%)
Place of birth for the foreign-born population - Lithuania (%)
Place of birth for the foreign-born population - North Macedonia (Macedonia) (%)
Place of birth for the foreign-born population - Moldova (%)
Place of birth for the foreign-born population - Poland (%)
Place of birth for the foreign-born population - Romania (%)
Place of birth for the foreign-born population - Russia (%)
Place of birth for the foreign-born population - Serbia (%)
Place of birth for the foreign-born population - Ukraine (%)
Place of birth for the foreign-born population - Other Eastern Europe (%)
Place of birth for the foreign-born population - China (%)
Place of birth for the foreign-born population - Hong Kong (%)
Place of birth for the foreign-born population - Taiwan (%)
Place of birth for the foreign-born population - Japan (%)
Place of birth for the foreign-born population - Korea (%)
Place of birth for the foreign-born population - Other Eastern Asia (%)
Place of birth for the foreign-born population - Afghanistan (%)
Place of birth for the foreign-born population - Bangladesh (%)
Place of birth for the foreign-born population - India (%)
Place of birth for the foreign-born population - Iran (%)
Place of birth for the foreign-born population - Kazakhstan (%)
Place of birth for the foreign-born population - Nepal (%)
Place of birth for the foreign-born population - Pakistan (%)
Place of birth for the foreign-born population - Sri Lanka (%)
Place of birth for the foreign-born population - Uzbekistan (%)
Place of birth for the foreign-born population - Other South Central Asia (%)
Place of birth for the foreign-born population - Burma (%)
Place of birth for the foreign-born population - Cambodia (%)
Place of birth for the foreign-born population - Indonesia (%)
Place of birth for the foreign-born population - Laos (%)
Place of birth for the foreign-born population - Malaysia (%)
Place of birth for the foreign-born population - Philippines (%)
Place of birth for the foreign-born population - Singapore (%)
Place of birth for the foreign-born population - Thailand (%)
Place of birth for the foreign-born population - Vietnam (%)
Place of birth for the foreign-born population - Other South Eastern Asia (%)
Place of birth for the foreign-born population - Armenia (%)
Place of birth for the foreign-born population - Iraq (%)
Place of birth for the foreign-born population - Israel (%)
Place of birth for the foreign-born population - Jordan (%)
Place of birth for the foreign-born population - Kuwait (%)
Place of birth for the foreign-born population - Lebanon (%)
Place of birth for the foreign-born population - Saudi Arabia (%)
Place of birth for the foreign-born population - Syria (%)
Place of birth for the foreign-born population - Turkey (%)
Place of birth for the foreign-born population - Yemen (%)
Place of birth for the foreign-born population - Other Western Asia (%)
Place of birth for the foreign-born population - Eritrea (%)
Place of birth for the foreign-born population - Ethiopia (%)
Place of birth for the foreign-born population - Kenya (%)
Place of birth for the foreign-born population - Somalia (%)
Place of birth for the foreign-born population - Uganda (%)
Place of birth for the foreign-born population - Zimbabwe (%)
Place of birth for the foreign-born population - Other Eastern Africa (%)
Place of birth for the foreign-born population - Cameroon (%)
Place of birth for the foreign-born population - Congo (%)
Place of birth for the foreign-born population - Democratic Republic of Congo (Zaire) (%)
Place of birth for the foreign-born population - Other Middle Africa (%)
Place of birth for the foreign-born population - Egypt (%)
Place of birth for the foreign-born population - Morocco (%)
Place of birth for the foreign-born population - Sudan (%)
Place of birth for the foreign-born population - Other Northern Africa (%)
Place of birth for the foreign-born population - South Africa (%)
Place of birth for the foreign-born population - Other Southern Africa (%)
Place of birth for the foreign-born population - Cabo Verde (%)
Place of birth for the foreign-born population - Ghana (%)
Place of birth for the foreign-born population - Liberia (%)
Place of birth for the foreign-born population - Nigeria (%)
Place of birth for the foreign-born population - Senegal (%)
Place of birth for the foreign-born population - Sierra Leone (%)
Place of birth for the foreign-born population - Other Western Africa (%)
Place of birth for the foreign-born population - Australia (%)
Place of birth for the foreign-born population - New Zealand (%)
Place of birth for the foreign-born population - Fiji (%)
Place of birth for the foreign-born population - Micronesia (%)
Place of birth for the foreign-born population - Bahamas (%)
Place of birth for the foreign-born population - Barbados (%)
Place of birth for the foreign-born population - Cuba (%)
Place of birth for the foreign-born population - Dominica (%)
Place of birth for the foreign-born population - Dominican Republic (%)
Place of birth for the foreign-born population - Grenada (%)
Place of birth for the foreign-born population - Haiti (%)
Place of birth for the foreign-born population - Jamaica (%)
Place of birth for the foreign-born population - St. Vincent and the Grenadines (%)
Place of birth for the foreign-born population - Trinidad and Tobago (%)
Place of birth for the foreign-born population - West Indies (%)
Place of birth for the foreign-born population - Other Caribbean (%)
Place of birth for the foreign-born population - Belize (%)
Place of birth for the foreign-born population - Costa Rica (%)
Place of birth for the foreign-born population - El Salvador (%)
Place of birth for the foreign-born population - Guatemala (%)
Place of birth for the foreign-born population - Honduras (%)
Place of birth for the foreign-born population - Mexico (%)
Place of birth for the foreign-born population - Nicaragua (%)
Place of birth for the foreign-born population - Panama (%)
Place of birth for the foreign-born population - Other Central America (%)
Place of birth for the foreign-born population - Argentina (%)
Place of birth for the foreign-born population - Bolivia (%)
Place of birth for the foreign-born population - Brazil (%)
Place of birth for the foreign-born population - Chile (%)
Place of birth for the foreign-born population - Colombia (%)
Place of birth for the foreign-born population - Ecuador (%)
Place of birth for the foreign-born population - Guyana (%)
Place of birth for the foreign-born population - Peru (%)
Place of birth for the foreign-born population - Uruguay (%)
Place of birth for the foreign-born population - Venezuela (%)
Place of birth for the foreign-born population - Other South America (%)
Place of birth for the foreign-born population - Canada (%)
Place of birth for the foreign-born population - Other Northern America (%)
Place of birth for the foreign-born population - Other (%)
Latest news about races in Hammond, IN collected exclusively by city-data.com from local newspapers, TV, and radio stations
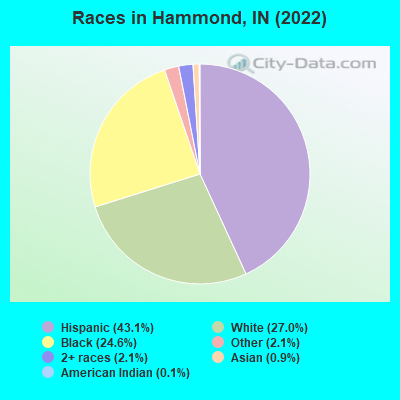
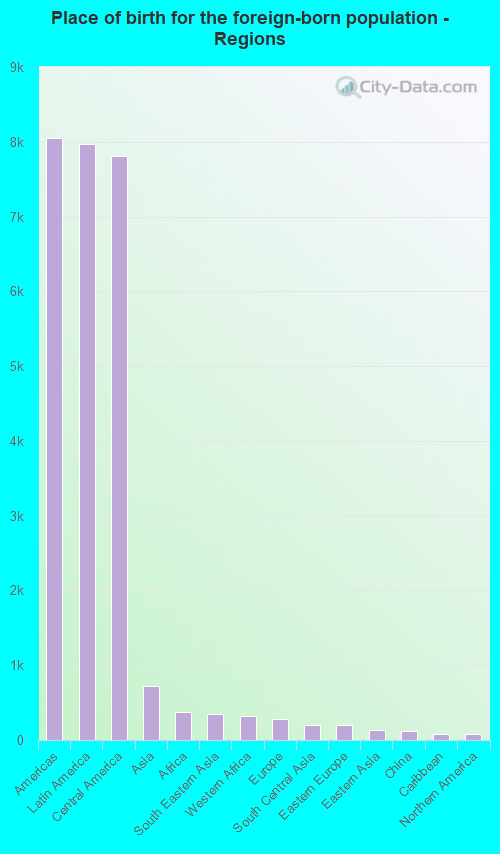
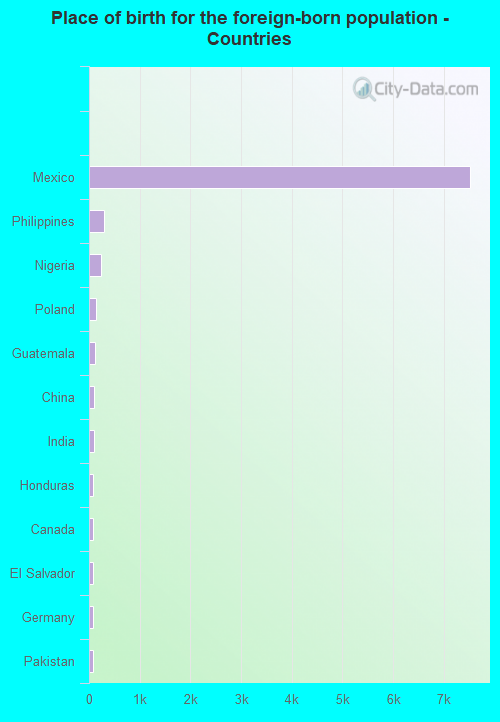
According to 2022 data, the most numerous races in Hammond, IN are White alone (20,710 residents), Black alone (18,824 residents), and Hispanic (33,001 residents). 72.3% of Hammond residents speak English at home. 12.1% of Hammond, IN residents are foreign-born (9.4% born in Latin America), which is 50.6% greater than the foreign-born rate of 6.0% across the entire state of Indiana.
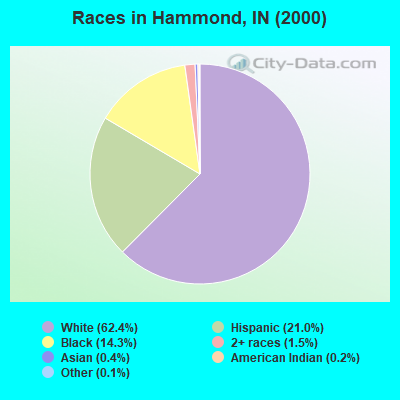
Race distribution in Hammond
2000 2022
5,219,373 85.8% White alone 505,462 8.3% Black alone 214,536 3.5% Hispanic 61,115 1.0% Two or more races 58,424 1.0% Asian alone 13,654 0.2% American Indian alone 6,348 0.1% Other race alone 1,573 0.03% Native Hawaiian and Other
5,192,455 76.0% White alone 628,054 9.2% Black alone 534,528 7.8% Hispanic 263,242 3.9% Two or more races 172,880 2.5% Asian alone 33,467 0.5% Other race alone 5,866 0.09% American Indian alone 2,545 0.04% Native Hawaiian and Other
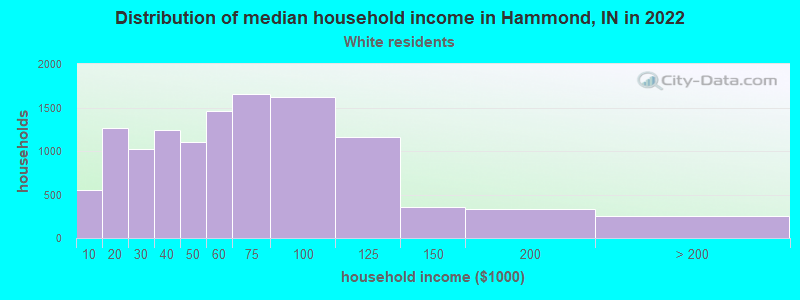
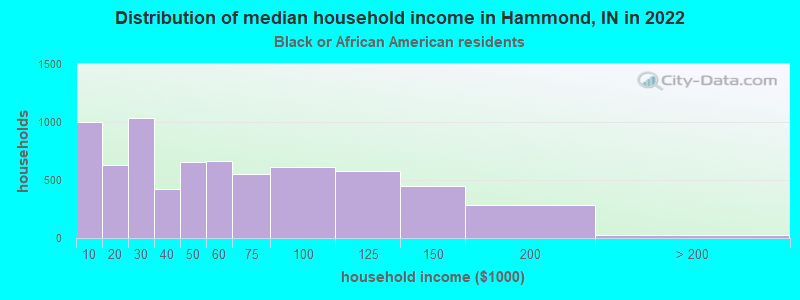
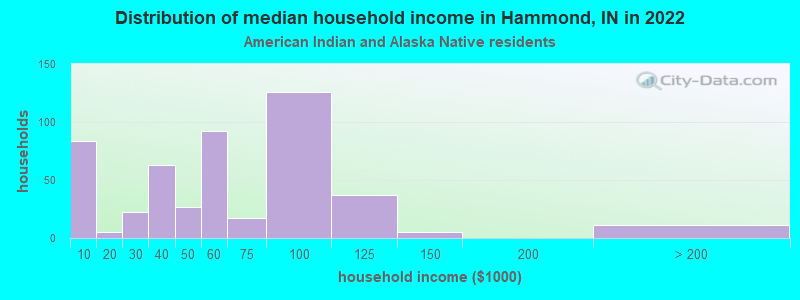
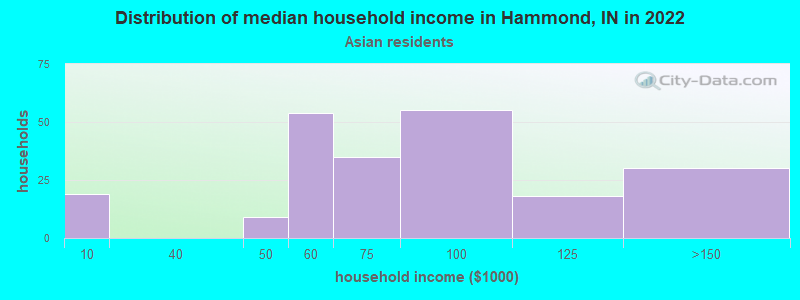
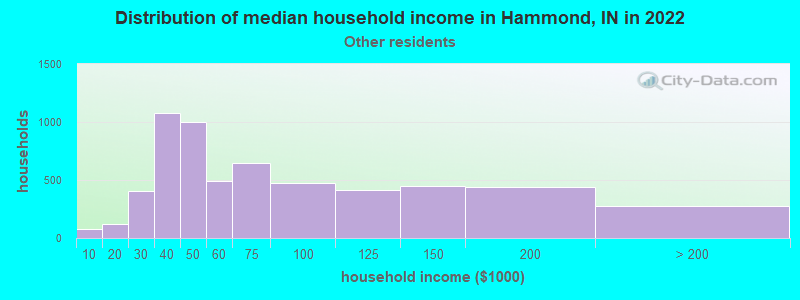
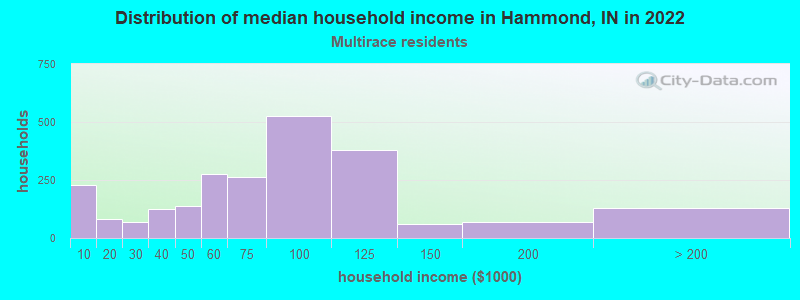
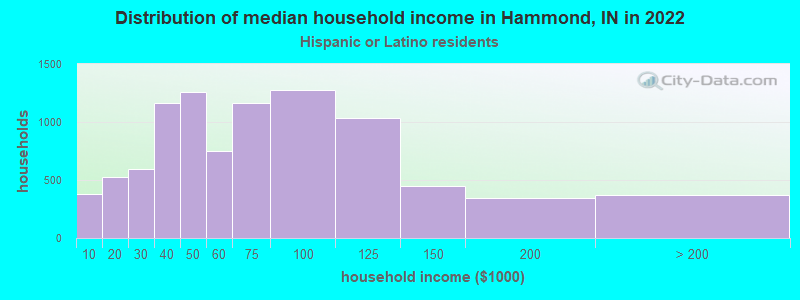
Income and house value in Hammond Median household income in 2022 $54,499 White non-Hispanic householders$43,335 Black householders$39,868 American Indian and Alaska Native householders$85,374 Asian householders$53,851 Some other race householders$79,164 Two or more races householders$59,618 Hispanic or Latino race householdersMedian 2022 house value $153,815 White Non-Hispanic householders$126,410 Black or African American householders$144,745 American Indian or Alaska Native householders $160,763 Asian householders$62,722 Native Hawaiian and other Pacific Islander householders$143,394 Some other race householders$152,657 Two or more races householders$145,517 Hispanic or Latino householders
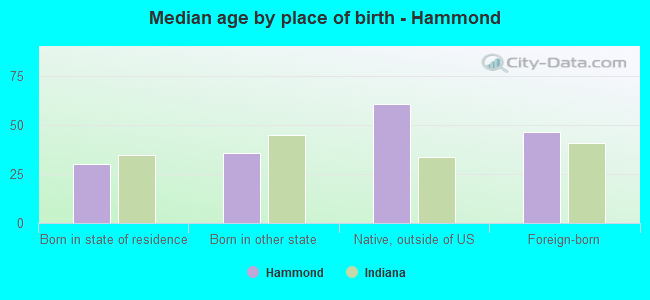
Median age by race in Hammond
47.0 Median age for White residents47.8 46.6 29.8 Median age for Black or African American residents28.2 31.6 42.8 Median age for American Indian / Alaska Native residents22.7 56.8 32.2 Median age for Asian residents29.8 31.9 -666,666,666.0 Median age for Native Hawaiian / Pacific Islander residents-666,666,666.0 -666,666,666.0 33.4 Median age for Other race residents28.5 36.4 28.7 Median age for Two or more races residents28.3 30.2 52.5 Median age for White alone residents56.3 50.9 30.4 Median age for Hispanic or Latino residents28.9 32.8
Owner/renter occupied households by race in Hammond
House owners and renters - White residents 8,938 74.3% Owner occupied3,084 25.7% Renter occupiedHouse owners and renters - Black or African American residents 1,874 27.2% Owner occupied5,015 72.8% Renter occupiedHouse owners and renters - American Indian / Alaska Native residents 369 93.8% Owner occupied24 6.2% Renter occupiedHouse owners and renters - Asian residents 126 49.2% Owner occupied130 50.8% Renter occupiedHouse owners and renters - Other race residents 4,015 68.4% Owner occupied1,858 31.6% Renter occupiedHouse owners and renters - Two or more races residents 2,230 93.0% Owner occupied169 7.0% Renter occupiedHouse owners and renters - White alone residents 7,853 73.8% Owner occupied2,781 26.2% Renter occupiedHouse owners and renters - Hispanic or Latino residents 7,307 78.4% Owner occupied2,011 21.6% Renter occupied
Language usage in Hammond
English speakers - Total 72.3% of residents of Hammond speak English at home.
26.0% of residents speak Spanish at home 13,082 68.6% Speak English very well5,987 31.4% Speak English less than very well1.7% of residents speak other language at home 879 70.6% Speak English very well366 29.4% Speak English less than very well
English speakers - Born in the United States 80.6% of residents of Hammond speak English at home.
18.9% of residents speak Spanish at home 5,311 85.5% Speak English very well902 14.5% Speak English less than very well0.5% of residents speak other language at home 156 100.0% Speak English very well
English speakers - Native, born elsewhere 16.2% of residents of Hammond speak English at home.
83.8% of residents speak Spanish at home 600 76.9% Speak English very well180 23.1% Speak English less than very well
English speakers - Foreign-born 16.4% of residents of Hammond speak English at home.
75.0% of residents speak Spanish at home 3,013 41.1% Speak English very well4,314 58.9% Speak English less than very well8.6% of residents speak other language at home 591 70.5% Speak English very well247 29.5% Speak English less than very well
White (Caucasian) - Speak only English Native:
90.3% (21,895)Foreign-born:
18.1% (212)
White (Caucasian) - Speak another language Native:
9.7% (2,345)Foreign-born:
81.9% (961)
Black or African American - Speak only English Native:
97.9% (15,642)Foreign-born:
81.0% (381)
Black or African American - Speak another language Native:
2.4% (384)Foreign-born:
29.5% (138)
American Indian / Alaska Native - Speak only English Native:
46.3% (313)Foreign-born:
5.6% (15)
American Indian / Alaska Native - Speak another language Native:
62.4% (422)Foreign-born:
95.2% (263)
Asian - Speak only English Native:
59.3% (91)Foreign-born:
58.3% (376)
Asian - Speak another language Native:
40.0% (61)Foreign-born:
51.4% (332)
Other race - Speak only English Native:
53.7% (8,012)Foreign-born:
7.7% (336)
Other race - Speak another language Native:
46.3% (6,900)Foreign-born:
92.3% (4,019)
Two or more races - Speak another language Native:
33.6% (2,248)Foreign-born:
100.0% (2,283)
White alone - Speak only English Native:
97.5% (24,220)Foreign-born:
29.1% (126)
White alone - Speak another language Native:
2.0% (501)Foreign-born:
63.2% (274)
Hispanic or Latino - Speak only English Native:
51.0% (12,076)Foreign-born:
3.3% (253)
Hispanic or Latino - Speak another language Native:
49.0% (11,604)Foreign-born:
96.7% (7,327)
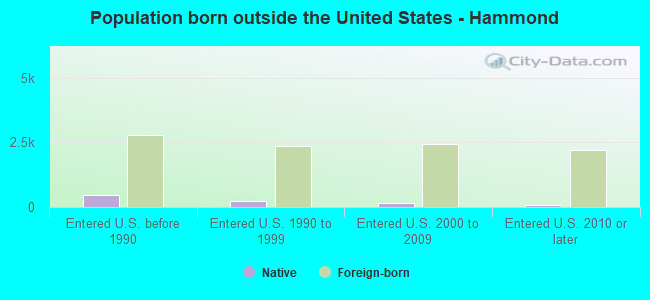
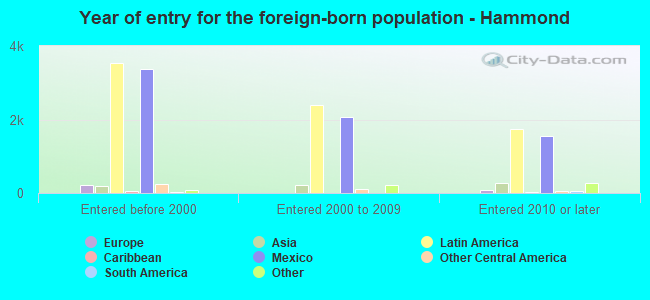
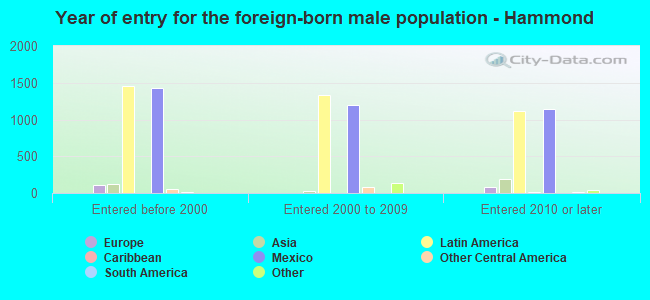
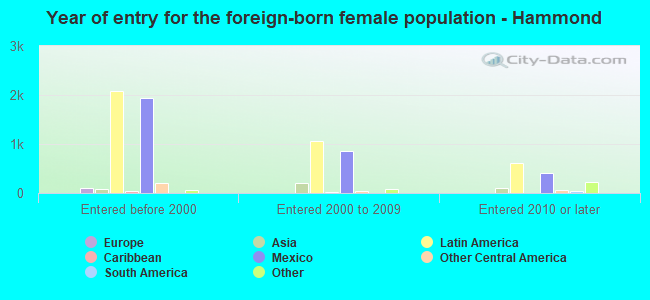
Foreign-born residents in Hammond 9,431 residents are foreign born (9.4% Latin America ).
This city:
12.1%Indiana:
5.6%
Marital status for residents in Hammond Marital status - White (Caucasian) population 15 years and over
Males 47.8% Never married36.3% Now married0.0% Separated5.4% Widowed10.5% DivorcedFemales 41.5% Never married38.3% Now married0.0% Separated5.6% Widowed14.6% DivorcedWomen who gave birth in the past 12 months Now married:
55.7% (243)Unmarried:
44.3% (193)
Women who did not give birth in the past 12 months Now married:
31.1% (2,096)Unmarried:
68.9% (4,633)
Marital status - Black or African American population 15 years and over
Males 56.4% Never married29.0% Now married0.9% Separated2.7% Widowed11.0% DivorcedFemales 47.6% Never married23.8% Now married4.1% Separated11.6% Widowed12.9% DivorcedWomen who gave birth in the past 12 months Now married:
70.4% (100)Unmarried:
29.6% (42)
Women who did not give birth in the past 12 months Now married:
27.7% (1,704)Unmarried:
72.3% (4,452)
Marital status - American Indian / Alaska Native population 15 years and over
Males 42.6% Never married49.4% Now married4.5% Separated0.0% Widowed3.4% DivorcedFemales 41.0% Never married41.4% Now married0.0% Separated14.5% Widowed3.2% DivorcedWomen who did not give birth in the past 12 months Now married:
35.9% (123)Unmarried:
64.1% (219)
Marital status - Asian population 15 years and over
Males 64.4% Never married35.3% Now married0.0% Separated0.0% Widowed0.3% DivorcedFemales 34.7% Never married42.7% Now married11.1% Separated3.4% Widowed8.0% DivorcedWomen who did not give birth in the past 12 months Now married:
53.1% (141)Unmarried:
46.9% (124)
Marital status - Other race population 15 years and over
Males 42.5% Never married45.1% Now married1.9% Separated0.7% Widowed9.8% DivorcedFemales 40.2% Never married46.6% Now married0.0% Separated3.1% Widowed10.0% DivorcedWomen who gave birth in the past 12 months Now married:
6.9% (28)Unmarried:
93.1% (378)
Women who did not give birth in the past 12 months Now married:
39.5% (2,031)Unmarried:
60.5% (3,108)
Marital status - Two or more races population 15 years and over
Males 41.8% Never married42.8% Now married2.0% Separated1.0% Widowed12.4% DivorcedFemales 45.2% Never married37.0% Now married3.5% Separated6.1% Widowed8.2% DivorcedWomen who gave birth in the past 12 months Now married:
100.0% (245)Unmarried:
0.0% (0)
Women who did not give birth in the past 12 months Now married:
39.4% (860)Unmarried:
60.6% (1,325)
Marital status - White alone, not Hispanic / Latino population 15 years and over
Males 46.5% Never married33.9% Now married0.0% Separated6.7% Widowed12.9% DivorcedFemales 41.9% Never married38.0% Now married0.0% Separated6.9% Widowed13.1% DivorcedWomen who gave birth in the past 12 months Now married:
41.1% (147)Unmarried:
58.9% (211)
Women who did not give birth in the past 12 months Now married:
36.0% (1,665)Unmarried:
64.0% (2,961)
Marital status - Hispanic or Latino population 15 years and over
Males 43.3% Never married48.4% Now married2.0% Separated1.1% Widowed5.1% DivorcedFemales 39.6% Never married44.6% Now married1.4% Separated4.4% Widowed10.1% DivorcedWomen who gave birth in the past 12 months Now married:
35.8% (270)Unmarried:
64.2% (485)
Women who did not give birth in the past 12 months Now married:
39.1% (3,326)Unmarried:
60.9% (5,188)
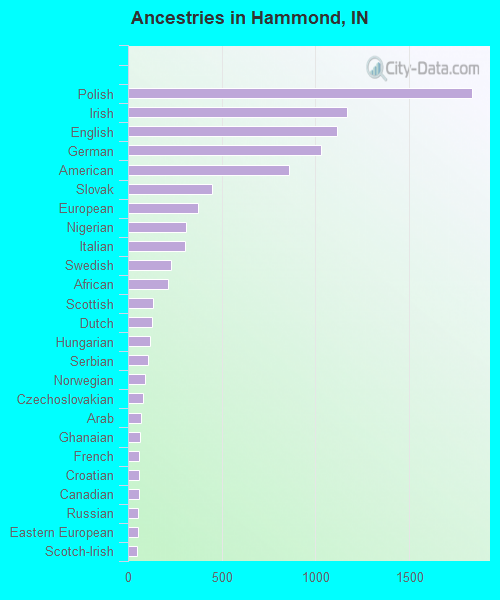
Ancestries in Hammond
1,835 4.6% Polish1,169 2.9% Irish1,117 2.8% English1,030 2.6% German858 2.1% American449 1.1% Slovak375 0.9% European309 0.8% Nigerian304 0.8% Italian227 0.6% Swedish214 0.5% African132 0.3% Scottish130 0.3% Dutch118 0.3% Hungarian106 0.3% Serbian89 0.2% Norwegian80 0.2% Czechoslovakian72 0.2% Arab65 0.2% Ghanaian60 0.1% French59 0.1% Croatian58 0.1% Canadian56 0.1% Russian53 0.1% Eastern European50 0.1% Scotch-Irish36 0.09% Ukrainian32 0.08% Romanian28 0.07% Jamaican26 0.06% Lithuanian25 0.06% Palestinian25 0.06% Greek16 0.04% Brazilian16 0.04% Swiss15 0.04% Jordanian10 0.02% British10 0.02% Danish9 0.02% French Canadian7 0.02% Austrian4 0.01% Pennsylvania German
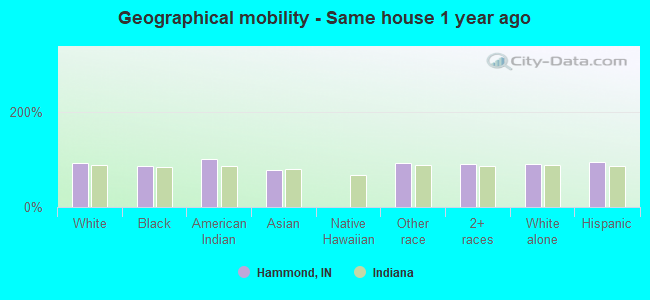
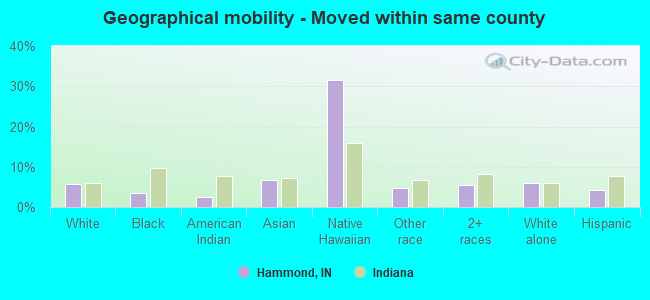
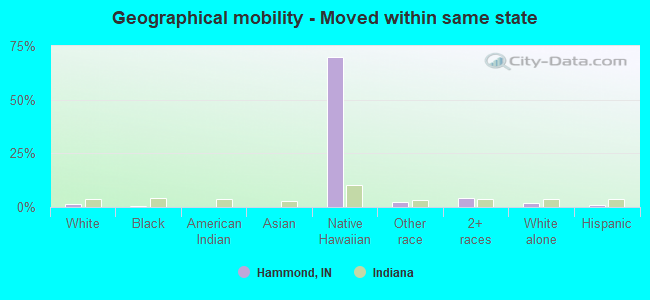
Geographical mobility in Hammond Same house 1 year ago 23,882 92.0% White (Caucasian)15,878 85.3% Black or African American1,150 100.0% American Indian / Alaska Native642 77.8% Asian17,920 93.0% Other race8,238 90.2% Two or more races18,860 91.4% White alone, not Hispanic / Latino30,619 93.7% Hispanic or LatinoMoved within same county 1,480 5.7% White / Caucasian665 3.6% Black or African American28 2.5% American Indian / Alaska Native56 6.8% Asian5 31.5% Native Hawaiian / Pacific Islander898 4.7% Other race489 5.4% Two or more races1,243 6.0% White alone, not Hispanic / Latino1,401 4.3% Hispanic or LatinoMoved within same state 424 1.6% White / Caucasian50 0.3% Black or African American11 69.9% Native Hawaiian / Pacific Islander425 2.2% Other race389 4.3% Two or more races372 1.8% White alone, not Hispanic / Latino313 1.0% Hispanic or LatinoMoved from different state 160 0.6% White / Caucasian1,773 9.5% Black or African American56 6.8% Asian381 2.0% Other race19 0.2% Two or more races160 0.8% White alone, not Hispanic / Latino337 1.0% Hispanic or LatinoMoved from abroad 245 1.3% Black or African American81 9.8% Asian179 0.9% Other race8 0.1% Two or more races
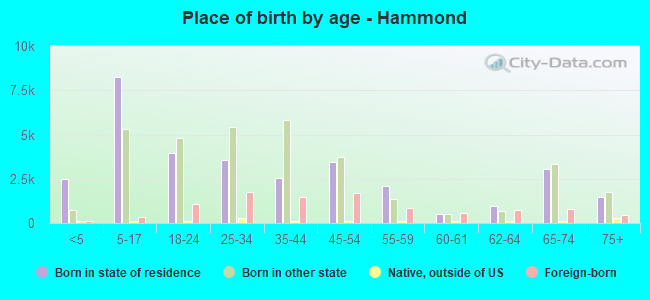
Children Nativity (place of birth) in Hammond
Children under 6 years - Living with two parents Both parents native 1,152 100.0% NativeBoth parents foreign-born 497 100.0% NativeOne native, one foreign-born parent 248 100.0% NativeChildren under 6 years - Living with one parent Native parent 1,724 100.0% NativeChildren 6 to 17 years - Living with two parents Both parents native 2,990 95.5% Native142 4.5% Foreign-bornBoth parents foreign-born 1,645 90.4% Native175 9.6% Foreign-bornOne native, one foreign-born parent 1,126 100.0% NativeChildren 6 to 17 years - Living with one parent Native parent 5,584 100.0% NativeForeign-born parent 1,107 50.0% Native1,107 50.0% Foreign-born
Grandparents responsible for own grandchildren in Hammond
Grandparents (30 to 59 years) White / Caucasian 100 34.5% Responsible for grandchildren191 65.5% Not responsible for grandchildrenBlack or African American 213 51.3% Responsible for grandchildren202 48.7% Not responsible for grandchildrenAmerican Indian / Alaska Native 1 6.7% Responsible for grandchildren13 93.3% Not responsible for grandchildrenOther race 90 33.3% Responsible for grandchildren180 66.7% Not responsible for grandchildrenTwo or more races 61 58.8% Responsible for grandchildren43 41.2% Not responsible for grandchildrenWhite alone, not Hispanic / Latino 91 40.6% Responsible for grandchildren133 59.4% Not responsible for grandchildrenHispanic or Latino 133 31.5% Responsible for grandchildren290 68.5% Not responsible for grandchildrenGrandparents (60 years and over) White / Caucasian 51 13.4% Responsible for grandchildren327 86.6% Not responsible for grandchildrenBlack or African American 35 25.0% Responsible for grandchildren106 75.0% Not responsible for grandchildrenAmerican Indian / Alaska Native 26 100.0% Not responsible for grandchildrenOther race 98 34.7% Responsible for grandchildren184 65.3% Not responsible for grandchildrenTwo or more races 107 88.4% Responsible for grandchildren14 11.6% Not responsible for grandchildrenWhite alone, not Hispanic / Latino 47 14.5% Responsible for grandchildren277 85.5% Not responsible for grandchildrenHispanic or Latino 111 26.7% Responsible for grandchildren305 73.3% Not responsible for grandchildren