Races in Hampton Township, Pennsylvania (PA) Detailed Stats
Ancestries, Foreign-born residents, place of birth

Recent posts about races in Hampton Township, Pennsylvania on our local forum with over 2,400,000 registered users:
 | Asian family looking for your advice to find a house (53 replies) |
| Pittsburgh best school district (61 replies) |
| Hampton Township (above or below Turnpike and other questions) (14 replies) |
| How safe is 8th avenue in Homestead? (60 replies) |
| Pittsburgh population estimated to decline 0.08% in 2016... (101 replies) |
| Why live in Hampton Township? (72 replies) |
2.5% of Hampton Township, PA residents are foreign-born (1.1% born in Europe, 1.0% born in Asia), which is 180.1% less than the foreign-born rate of 7.0% across the entire state of Pennsylvania.
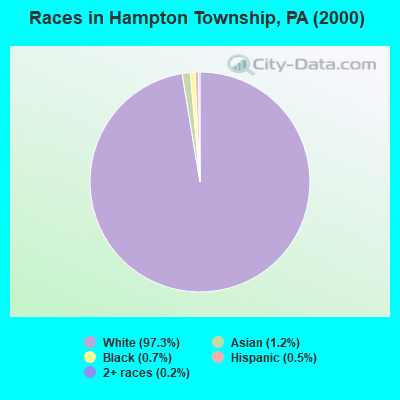
Race distribution in Hampton Township

- 17,04697.3%White alone
- 2151.2%Asian alone
- 1160.7%Black alone
- 930.5%Hispanic
- 400.2%Two or more races
- 80.05%American Indian alone
- 70.04%Other race alone
- 10.01%Native Hawaiian and Other
Pacific Islander alone
2000
2022
-
- 10,322,45584.1%White alone
- 1,202,4379.8%Black alone
- 394,0883.2%Hispanic
- 218,2961.8%Asian alone
- 113,0970.9%Two or more races
- 13,0860.1%Other race alone
- 14,9040.1%American Indian alone
- 2,6910.02%Native Hawaiian and Other
Pacific Islander alone

-
- 9,487,22873.1%White alone
- 1,311,58110.1%Black alone
- 1,115,9978.6%Hispanic
- 493,9423.8%Two or more races
- 487,1243.8%Asian alone
- 63,5820.5%Other race alone
- 10,1300.08%American Indian alone
- 2,4240.02%Native Hawaiian and Other
Pacific Islander alone

Income and house value in Hampton Township
- Median household income in 2022
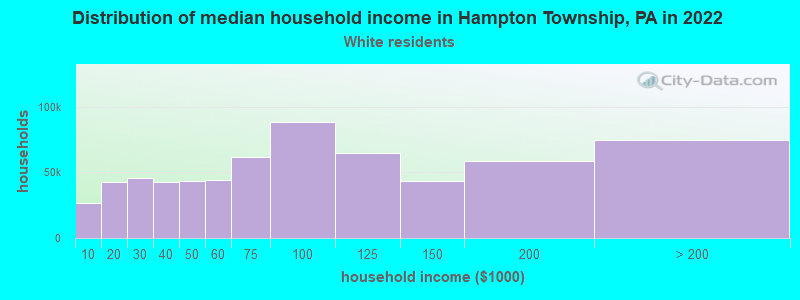
- $114,731White non-Hispanic householders
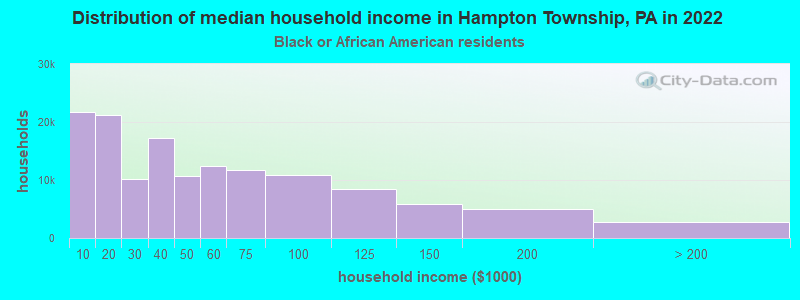
- $90,631Black householders
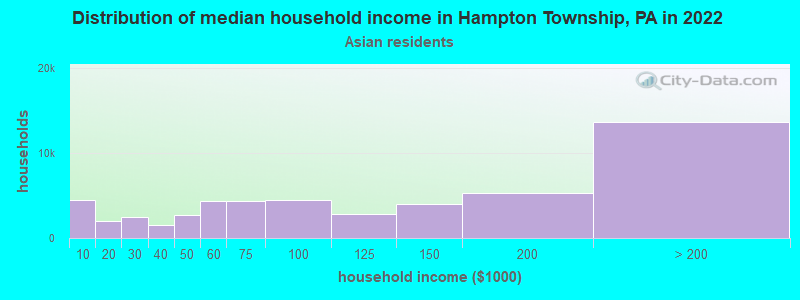
- over $200,000Asian householders
- $31,468Some other race householders
- $168,977Two or more races householders
- $108,375Hispanic or Latino race householders
- Median 2022 house value
- $352,861White Non-Hispanic householders
- $439,682Black or African American householders
- $851,221Asian householders
- $199,131Native Hawaiian and other Pacific Islander householders
- $597,395Some other race householders
- $384,988Two or more races householders
- $597,395Hispanic or Latino householders
Household income for White non-Hispanic householders
Household income for Black householders
Household income for Asian householders
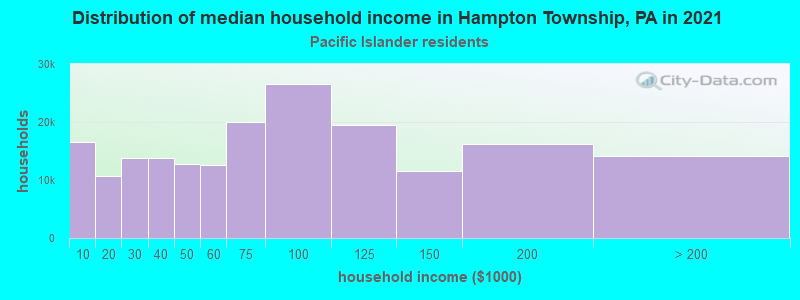
Household income for Native Hawaiian and other Pacific Islander householders
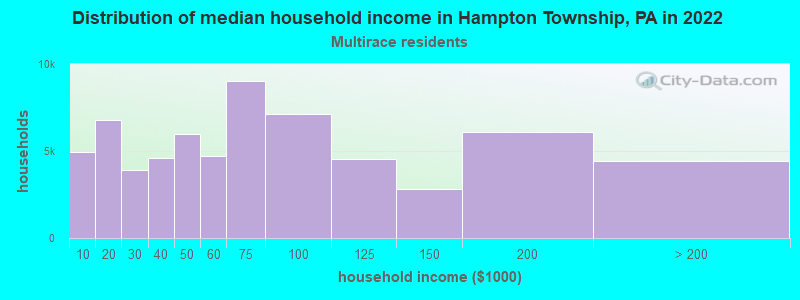
Household income for Two or more races householders
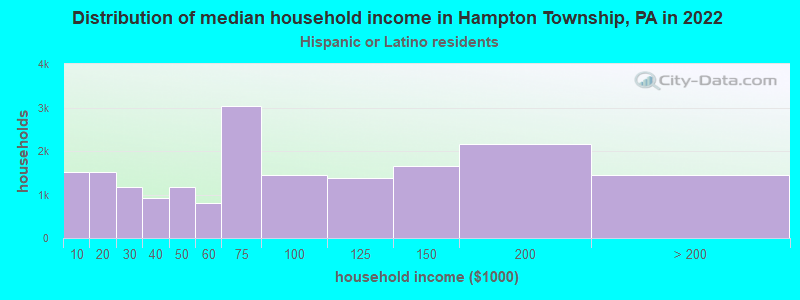
Household income for Hispanic or Latino race householders
Foreign-born residents in Hampton Township
438 residents are foreign born (1.1% Europe, 1.0% Asia).
| This city: | 2.5% |
| Pennsylvania: | 4.1% |
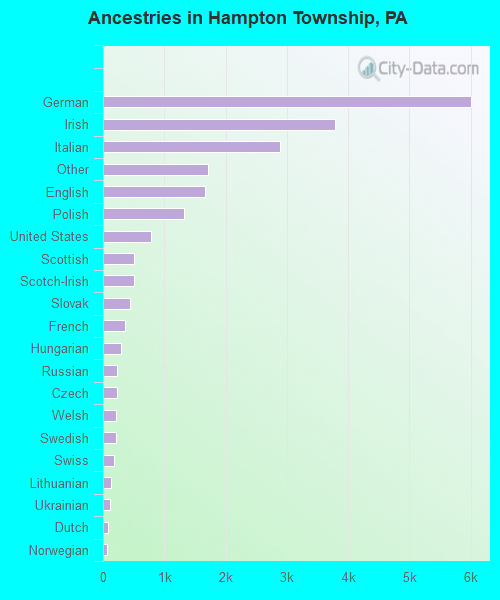
Ancestries in Hampton Township

- 6,00127.5%German
- 3,78517.3%Irish
- 2,88713.2%Italian
- 1,7147.9%Other
- 1,6627.6%English
- 1,3226.1%Polish
- 7793.6%United States
- 5082.3%Scottish
- 5022.3%Scotch-Irish
- 4362.0%Slovak
- 3531.6%French
- 2921.3%Hungarian
- 2361.1%Russian
- 2271.0%Czech
- 2171.0%Welsh
- 2070.9%Swedish
- 1760.8%Swiss
- 1240.6%Lithuanian
- 1100.5%Ukrainian
- 890.4%Dutch
- 680.3%Norwegian
- 500.2%Greek
- 290.1%French Canadian
- 210.10%Arab
- 140.06%West Indian
- 70.03%Danish
Zip codes: 15101.