Races in Hanahan, South Carolina (SC) Detailed Stats
Data:
Races - White alone (%)
Races - White alone (% change since 2000)
Races - Black alone (%)
Races - Black alone (% change since 2000)
Races - American Indian alone (%)
Races - American Indian alone (% change since 2000)
Races - Asian alone (%)
Races - Asian alone (% change since 2000)
Races - Hispanic (%)
Races - Hispanic (% change since 2000)
Races - Native Hawaiian and Other Pacific Islander alone (%)
Races - Native Hawaiian and Other Pacific Islander alone (% change since 2000)
Races - Two or more races(%)
Races - Two or more races(% change since 2000)
Races - Other race alone (%)
Races - Other race alone (% change since 2000)
Racial diversity
Place of birth - Born in state of residence (%)
Place of birth - Born in state of residence (%) - White
Place of birth - Born in state of residence (%) - Black or African American
Place of birth - Born in state of residence (%) - Asian
Place of birth - Born in state of residence (%) - Hispanic or Latino
Place of birth - Born in state of residence (%) - American Indian and Alaska Native
Place of birth - Born in state of residence (%) - Multirace
Place of birth - Born in state of residence (%) - Other Race
Place of birth - Born in other state (%)
Place of birth - Born in other state (%) - White
Place of birth - Born in other state (%) - Black or African American
Place of birth - Born in other state (%) - Asian
Place of birth - Born in other state (%) - Hispanic or Latino
Place of birth - Born in other state (%) - American Indian and Alaska Native
Place of birth - Born in other state (%) - Multirace
Place of birth - Born in other state (%) - Other Race
Place of birth - Native, outside of US (%)
Place of birth - Native, outside of US (%) - White
Place of birth - Native, outside of US (%) - Black or African American
Place of birth - Native, outside of US (%) - Asian
Place of birth - Native, outside of US (%) - Hispanic or Latino
Place of birth - Native, outside of US (%) - American Indian and Alaska Native
Place of birth - Native, outside of US (%) - Multirace
Place of birth - Native, outside of US (%) - Other Race
Place of birth - Foreign born (%)
Place of birth - Foreign born (%) - White
Place of birth - Foreign born (%) - Black or African American
Place of birth - Foreign born (%) - Asian
Place of birth - Foreign born (%) - Hispanic or Latino
Place of birth - Foreign born (%) - American Indian and Alaska Native
Place of birth - Foreign born (%) - Multirace
Place of birth - Foreign born (%) - Other Race
Residents speaking English at home (%)
Residents speaking English at home - Born in the United States (%)
Residents speaking English at home - Native, born elsewhere (%)
Residents speaking English at home - Foreign born (%)
Residents speaking Spanish at home (%)
Residents speaking Spanish at home - Born in the United States (%)
Residents speaking Spanish at home - Native, born elsewhere (%)
Residents speaking Spanish at home - Foreign born (%)
Residents speaking other language at home (%)
Residents speaking other language at home - Born in the United States (%)
Residents speaking other language at home - Native, born elsewhere (%)
Residents speaking other language at home - Foreign born (%)
Marital status - Never married (%)
Marital status - Now married (%)
Marital status - Separated (%)
Marital status - Widowed (%)
Marital status - Divorced (%)
Ancestries Reported - Arab (%)
Ancestries Reported - Czech (%)
Ancestries Reported - Danish (%)
Ancestries Reported - Dutch (%)
Ancestries Reported - English (%)
Ancestries Reported - French (%)
Ancestries Reported - French Canadian (%)
Ancestries Reported - German (%)
Ancestries Reported - Greek (%)
Ancestries Reported - Hungarian (%)
Ancestries Reported - Irish (%)
Ancestries Reported - Italian (%)
Ancestries Reported - Lithuanian (%)
Ancestries Reported - Norwegian (%)
Ancestries Reported - Polish (%)
Ancestries Reported - Portuguese (%)
Ancestries Reported - Russian (%)
Ancestries Reported - Scotch-Irish (%)
Ancestries Reported - Scottish (%)
Ancestries Reported - Slovak (%)
Ancestries Reported - Subsaharan African (%)
Ancestries Reported - Swedish (%)
Ancestries Reported - Swiss (%)
Ancestries Reported - Ukrainian (%)
Ancestries Reported - United States (%)
Ancestries Reported - Welsh (%)
Ancestries Reported - West Indian (%)
Ancestries Reported - Other (%)
Geographical mobility - Same house 1 year ago (%)
Geographical mobility - Same house 1 year ago (%) - White
Geographical mobility - Same house 1 year ago (%) - Black or African American
Geographical mobility - Same house 1 year ago (%) - Asian
Geographical mobility - Same house 1 year ago (%) - Hispanic or Latino
Geographical mobility - Same house 1 year ago (%) - American Indian and Alaska Native
Geographical mobility - Same house 1 year ago (%) - Multirace
Geographical mobility - Same house 1 year ago (%) - Other Race
Geographical mobility - Moved within same county (%)
Geographical mobility - Moved within same county (%) - White
Geographical mobility - Moved within same county (%) - Black or African American
Geographical mobility - Moved within same county (%) - Asian
Geographical mobility - Moved within same county (%) - Hispanic or Latino
Geographical mobility - Moved within same county (%) - American Indian and Alaska Native
Geographical mobility - Moved within same county (%) - Multirace
Geographical mobility - Moved within same county (%) - Other Race
Geographical mobility - Moved from different county within same state (%)
Geographical mobility - Moved from different county within same state (%) - White
Geographical mobility - Moved from different county within same state (%) - Black or African American
Geographical mobility - Moved from different county within same state (%) - Asian
Geographical mobility - Moved from different county within same state (%) - Hispanic or Latino
Geographical mobility - Moved from different county within same state (%) - American Indian and Alaska Native
Geographical mobility - Moved from different county within same state (%) - Multirace
Geographical mobility - Moved from different county within same state (%) - Other Race
Geographical mobility - Moved from different state (%)
Geographical mobility - Moved from different state (%) - White
Geographical mobility - Moved from different state (%) - Black or African American
Geographical mobility - Moved from different state (%) - Asian
Geographical mobility - Moved from different state (%) - Hispanic or Latino
Geographical mobility - Moved from different state (%) - American Indian and Alaska Native
Geographical mobility - Moved from different state (%) - Multirace
Geographical mobility - Moved from different state (%) - Other Race
Geographical mobility - Moved from abroad (%)
Geographical mobility - Moved from abroad (%) - White
Geographical mobility - Moved from abroad (%) - Black or African American
Geographical mobility - Moved from abroad (%) - Asian
Geographical mobility - Moved from abroad (%) - Hispanic or Latino
Geographical mobility - Moved from abroad (%) - American Indian and Alaska Native
Geographical mobility - Moved from abroad (%) - Multirace
Geographical mobility - Moved from abroad (%) - Other Race
Place of birth for the foreign-born population - Ireland (%)
Place of birth for the foreign-born population - Denmark (%)
Place of birth for the foreign-born population - Norway (%)
Place of birth for the foreign-born population - Sweden (%)
Place of birth for the foreign-born population - United Kingdom (%)
Place of birth for the foreign-born population - England (%)
Place of birth for the foreign-born population - Scotland (%)
Place of birth for the foreign-born population - Other Northern Europe (%)
Place of birth for the foreign-born population - Austria (%)
Place of birth for the foreign-born population - Belgium (%)
Place of birth for the foreign-born population - France (%)
Place of birth for the foreign-born population - Germany (%)
Place of birth for the foreign-born population - Netherlands (%)
Place of birth for the foreign-born population - Switzerland (%)
Place of birth for the foreign-born population - Other Western Europe (%)
Place of birth for the foreign-born population - Greece (%)
Place of birth for the foreign-born population - Italy (%)
Place of birth for the foreign-born population - Portugal (%)
Place of birth for the foreign-born population - Spain (%)
Place of birth for the foreign-born population - Other Southern Europe (%)
Place of birth for the foreign-born population - Albania (%)
Place of birth for the foreign-born population - Belarus (%)
Place of birth for the foreign-born population - Bosnia and Herzegovina (%)
Place of birth for the foreign-born population - Bulgaria (%)
Place of birth for the foreign-born population - Croatia (%)
Place of birth for the foreign-born population - Czechoslovakia (%)
Place of birth for the foreign-born population - Hungary (%)
Place of birth for the foreign-born population - Latvia (%)
Place of birth for the foreign-born population - Lithuania (%)
Place of birth for the foreign-born population - North Macedonia (Macedonia) (%)
Place of birth for the foreign-born population - Moldova (%)
Place of birth for the foreign-born population - Poland (%)
Place of birth for the foreign-born population - Romania (%)
Place of birth for the foreign-born population - Russia (%)
Place of birth for the foreign-born population - Serbia (%)
Place of birth for the foreign-born population - Ukraine (%)
Place of birth for the foreign-born population - Other Eastern Europe (%)
Place of birth for the foreign-born population - China (%)
Place of birth for the foreign-born population - Hong Kong (%)
Place of birth for the foreign-born population - Taiwan (%)
Place of birth for the foreign-born population - Japan (%)
Place of birth for the foreign-born population - Korea (%)
Place of birth for the foreign-born population - Other Eastern Asia (%)
Place of birth for the foreign-born population - Afghanistan (%)
Place of birth for the foreign-born population - Bangladesh (%)
Place of birth for the foreign-born population - India (%)
Place of birth for the foreign-born population - Iran (%)
Place of birth for the foreign-born population - Kazakhstan (%)
Place of birth for the foreign-born population - Nepal (%)
Place of birth for the foreign-born population - Pakistan (%)
Place of birth for the foreign-born population - Sri Lanka (%)
Place of birth for the foreign-born population - Uzbekistan (%)
Place of birth for the foreign-born population - Other South Central Asia (%)
Place of birth for the foreign-born population - Burma (%)
Place of birth for the foreign-born population - Cambodia (%)
Place of birth for the foreign-born population - Indonesia (%)
Place of birth for the foreign-born population - Laos (%)
Place of birth for the foreign-born population - Malaysia (%)
Place of birth for the foreign-born population - Philippines (%)
Place of birth for the foreign-born population - Singapore (%)
Place of birth for the foreign-born population - Thailand (%)
Place of birth for the foreign-born population - Vietnam (%)
Place of birth for the foreign-born population - Other South Eastern Asia (%)
Place of birth for the foreign-born population - Armenia (%)
Place of birth for the foreign-born population - Iraq (%)
Place of birth for the foreign-born population - Israel (%)
Place of birth for the foreign-born population - Jordan (%)
Place of birth for the foreign-born population - Kuwait (%)
Place of birth for the foreign-born population - Lebanon (%)
Place of birth for the foreign-born population - Saudi Arabia (%)
Place of birth for the foreign-born population - Syria (%)
Place of birth for the foreign-born population - Turkey (%)
Place of birth for the foreign-born population - Yemen (%)
Place of birth for the foreign-born population - Other Western Asia (%)
Place of birth for the foreign-born population - Eritrea (%)
Place of birth for the foreign-born population - Ethiopia (%)
Place of birth for the foreign-born population - Kenya (%)
Place of birth for the foreign-born population - Somalia (%)
Place of birth for the foreign-born population - Uganda (%)
Place of birth for the foreign-born population - Zimbabwe (%)
Place of birth for the foreign-born population - Other Eastern Africa (%)
Place of birth for the foreign-born population - Cameroon (%)
Place of birth for the foreign-born population - Congo (%)
Place of birth for the foreign-born population - Democratic Republic of Congo (Zaire) (%)
Place of birth for the foreign-born population - Other Middle Africa (%)
Place of birth for the foreign-born population - Egypt (%)
Place of birth for the foreign-born population - Morocco (%)
Place of birth for the foreign-born population - Sudan (%)
Place of birth for the foreign-born population - Other Northern Africa (%)
Place of birth for the foreign-born population - South Africa (%)
Place of birth for the foreign-born population - Other Southern Africa (%)
Place of birth for the foreign-born population - Cabo Verde (%)
Place of birth for the foreign-born population - Ghana (%)
Place of birth for the foreign-born population - Liberia (%)
Place of birth for the foreign-born population - Nigeria (%)
Place of birth for the foreign-born population - Senegal (%)
Place of birth for the foreign-born population - Sierra Leone (%)
Place of birth for the foreign-born population - Other Western Africa (%)
Place of birth for the foreign-born population - Australia (%)
Place of birth for the foreign-born population - New Zealand (%)
Place of birth for the foreign-born population - Fiji (%)
Place of birth for the foreign-born population - Micronesia (%)
Place of birth for the foreign-born population - Bahamas (%)
Place of birth for the foreign-born population - Barbados (%)
Place of birth for the foreign-born population - Cuba (%)
Place of birth for the foreign-born population - Dominica (%)
Place of birth for the foreign-born population - Dominican Republic (%)
Place of birth for the foreign-born population - Grenada (%)
Place of birth for the foreign-born population - Haiti (%)
Place of birth for the foreign-born population - Jamaica (%)
Place of birth for the foreign-born population - St. Vincent and the Grenadines (%)
Place of birth for the foreign-born population - Trinidad and Tobago (%)
Place of birth for the foreign-born population - West Indies (%)
Place of birth for the foreign-born population - Other Caribbean (%)
Place of birth for the foreign-born population - Belize (%)
Place of birth for the foreign-born population - Costa Rica (%)
Place of birth for the foreign-born population - El Salvador (%)
Place of birth for the foreign-born population - Guatemala (%)
Place of birth for the foreign-born population - Honduras (%)
Place of birth for the foreign-born population - Mexico (%)
Place of birth for the foreign-born population - Nicaragua (%)
Place of birth for the foreign-born population - Panama (%)
Place of birth for the foreign-born population - Other Central America (%)
Place of birth for the foreign-born population - Argentina (%)
Place of birth for the foreign-born population - Bolivia (%)
Place of birth for the foreign-born population - Brazil (%)
Place of birth for the foreign-born population - Chile (%)
Place of birth for the foreign-born population - Colombia (%)
Place of birth for the foreign-born population - Ecuador (%)
Place of birth for the foreign-born population - Guyana (%)
Place of birth for the foreign-born population - Peru (%)
Place of birth for the foreign-born population - Uruguay (%)
Place of birth for the foreign-born population - Venezuela (%)
Place of birth for the foreign-born population - Other South America (%)
Place of birth for the foreign-born population - Canada (%)
Place of birth for the foreign-born population - Other Northern America (%)
Place of birth for the foreign-born population - Other (%)
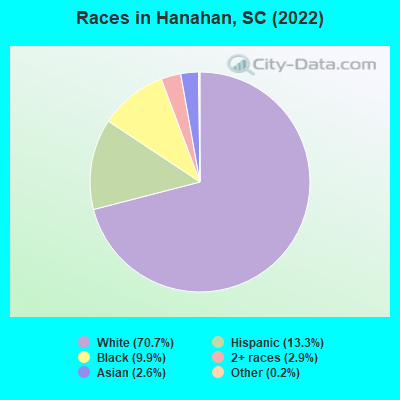
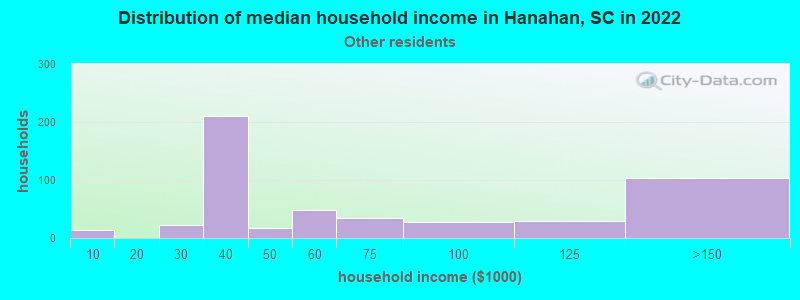
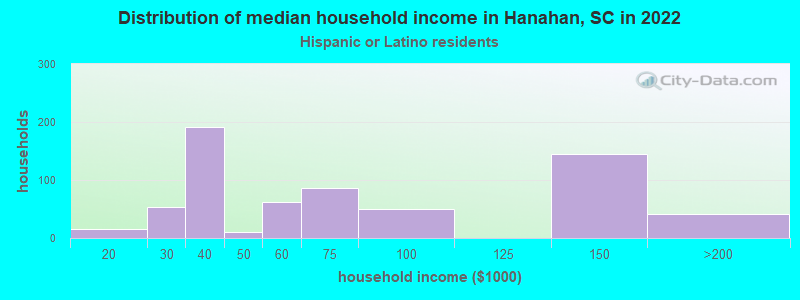
According to 2022 data, the most numerous races in Hanahan, SC are White alone (15,531 residents), Black alone (2,169 residents), and Hispanic (2,928 residents). 88.7% of Hanahan residents speak English at home. 8.1% of Hanahan, SC residents are foreign-born (4.5% born in Latin America, 2.0% born in Asia, 1.1% born in Africa), which is 38.1% greater than the foreign-born rate of 5.0% across the entire state of South Carolina.
Race distribution in Hanahan
2000 2022
2,652,291 66.1% White alone 1,178,486 29.4% Black alone 95,076 2.4% Hispanic 35,568 0.9% Asian alone 33,290 0.8% Two or more races 12,765 0.3% American Indian alone 3,266 0.08% Other race alone 1,270 0.03% Native Hawaiian and Other
3,301,739 62.5% White alone 1,313,290 24.9% Black alone 343,783 6.5% Hispanic 190,508 3.6% Two or more races 89,888 1.7% Asian alone 29,390 0.6% Other race alone 12,112 0.2% American Indian alone 1,924 0.04% Native Hawaiian and Other
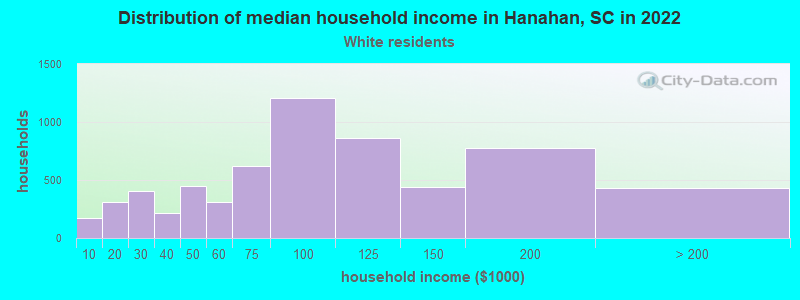
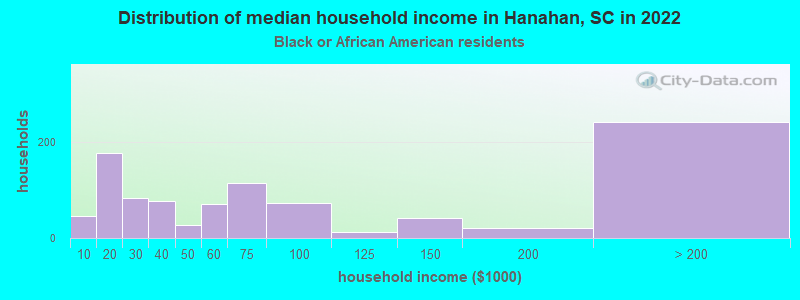
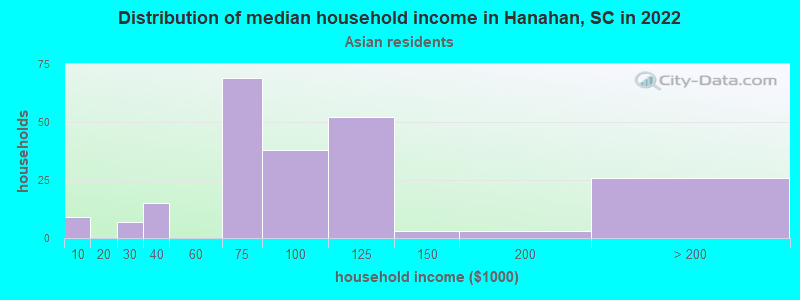
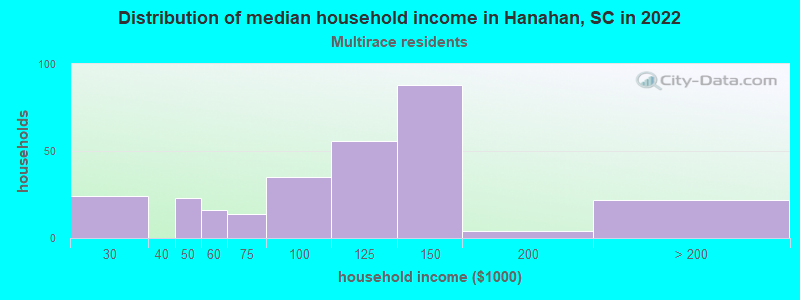
Income and house value in Hanahan Median household income in 2022 $90,169 White non-Hispanic householders$56,679 Black householders$108,197 Asian householders$138,123 Two or more races householders$63,431 Hispanic or Latino race householdersMedian 2022 house value $414,781 White Non-Hispanic householders$334,601 Black or African American householders $343,467 Asian householders$371,222 Some other race householders$366,210 Two or more races householders$392,809 Hispanic or Latino householders
Median age by race in Hanahan
38.0 Median age for White residents37.1 39.6 31.9 Median age for Black or African American residents30.0 32.8 15.8 Median age for American Indian / Alaska Native residents15.7 12.0 34.6 Median age for Asian residents27.1 38.9 -698,412,697.7 Median age for Native Hawaiian / Pacific Islander residents-551,574,375.1 -1,016,109,044.8 17.6 Median age for Other race residents16.4 24.5 25.1 Median age for Two or more races residents26.4 23.1 38.5 Median age for White alone residents37.4 39.8 20.0 Median age for Hispanic or Latino residents18.6 21.8
Owner/renter occupied households by race in Hanahan
House owners and renters - White residents 4,693 75.9% Owner occupied1,489 24.1% Renter occupiedHouse owners and renters - Black or African American residents 278 34.3% Owner occupied533 65.7% Renter occupiedHouse owners and renters - American Indian / Alaska Native residents 8 100.0% Owner occupiedHouse owners and renters - Asian residents 190 84.6% Owner occupied35 15.4% Renter occupiedHouse owners and renters - Other race residents 121 53.6% Owner occupied105 46.4% Renter occupiedHouse owners and renters - Two or more races residents 134 53.6% Owner occupied116 46.4% Renter occupiedHouse owners and renters - White alone residents 4,574 76.2% Owner occupied1,425 23.8% Renter occupiedHouse owners and renters - Hispanic or Latino residents 252 42.3% Owner occupied343 57.7% Renter occupied
Language usage in Hanahan
English speakers - Total 88.7% of residents of Hanahan speak English at home.
7.6% of residents speak Spanish at home 991 64.9% Speak English very well536 35.1% Speak English less than very well2.9% of residents speak other language at home 455 78.9% Speak English very well122 21.1% Speak English less than very well
English speakers - Born in the United States 93.2% of residents of Hanahan speak English at home.
5.8% of residents speak Spanish at home 430 81.4% Speak English very well98 18.6% Speak English less than very well0.2% of residents speak other language at home 22 100.0% Speak English very well
English speakers - Native, born elsewhere 68.3% of residents of Hanahan speak English at home.
24.4% of residents speak Spanish at home 79 90.8% Speak English very well8 9.2% Speak English less than very well6.5% of residents speak other language at home 23 100.0% Speak English less than very well
English speakers - Foreign-born 31.9% of residents of Hanahan speak English at home.
34.5% of residents speak Spanish at home 176 31.9% Speak English very well375 68.1% Speak English less than very well33.8% of residents speak other language at home 425 78.7% Speak English very well115 21.3% Speak English less than very well
White (Caucasian) - Speak only English Native:
100.0% (14,560)Foreign-born:
65.7% (227)
White (Caucasian) - Speak another language Native:
1.7% (244)Foreign-born:
64.9% (225)
Black or African American - Speak only English Native:
98.8% (1,789)Foreign-born:
7.5% (11)
Black or African American - Speak another language Native:
1.1% (21)Foreign-born:
100.0% (145)
American Indian / Alaska Native - Speak only English Native:
97.2% (103)Foreign-born:
84.1% (60)
Asian - Speak only English Native:
62.7% (183)Foreign-born:
54.6% (159)
Asian - Speak another language Native:
36.6% (107)Foreign-born:
58.4% (171)
Other race - Speak only English Native:
8.0% (70)Foreign-born:
0.9% (5)
Other race - Speak another language Native:
85.0% (738)Foreign-born:
86.0% (434)
Two or more races - Speak only English Native:
73.7% (565)Foreign-born:
5.5% (7)
Two or more races - Speak another language Native:
26.6% (204)Foreign-born:
83.4% (108)
White alone - Speak only English Native:
99.8% (14,199)Foreign-born:
51.3% (155)
White alone - Speak another language Native:
0.6% (87)Foreign-born:
38.0% (115)
Hispanic or Latino - Speak only English Native:
43.8% (763)Foreign-born:
25.4% (172)
Hispanic or Latino - Speak another language Native:
50.8% (884)Foreign-born:
79.8% (539)
Foreign-born residents in Hanahan 1,773 residents are foreign born (4.5% Latin America , 2.0% Asia , 1.1% Africa ).
This city:
8.1%South Carolina:
5.3%
Marital status for residents in Hanahan Marital status - White (Caucasian) population 15 years and over
Males 34.0% Never married51.5% Now married1.2% Separated3.5% Widowed9.9% DivorcedFemales 24.2% Never married53.6% Now married2.0% Separated9.0% Widowed11.2% DivorcedWomen who gave birth in the past 12 months Now married:
100.0% (118)Unmarried:
0.0% (0)
Women who did not give birth in the past 12 months Now married:
54.0% (1,968)Unmarried:
46.0% (1,675)
Marital status - Black or African American population 15 years and over
Males 45.0% Never married42.3% Now married1.6% Separated0.0% Widowed11.2% DivorcedFemales 41.1% Never married36.9% Now married0.0% Separated2.4% Widowed19.6% DivorcedWomen who gave birth in the past 12 months Now married:
10.7% (6)Unmarried:
89.3% (53)
Women who did not give birth in the past 12 months Now married:
37.5% (244)Unmarried:
62.5% (406)
Marital status - American Indian / Alaska Native population 15 years and over
Males 0.0% Never married100.0% Now married0.0% Separated0.0% Widowed0.0% DivorcedFemales 0.0% Never married62.5% Now married0.0% Separated0.0% Widowed37.5% DivorcedWomen who did not give birth in the past 12 months Now married:
0.0% (0)Unmarried:
100.0% (4)
Marital status - Asian population 15 years and over
Males 34.3% Never married65.7% Now married0.0% Separated0.0% Widowed0.0% DivorcedFemales 29.7% Never married42.3% Now married3.6% Separated9.6% Widowed14.7% DivorcedWomen who gave birth in the past 12 months Now married:
0.0% (0)Unmarried:
100.0% (21)
Women who did not give birth in the past 12 months Now married:
40.6% (98)Unmarried:
59.4% (143)
Marital status - Other race population 15 years and over
Males 43.6% Never married53.8% Now married0.0% Separated0.0% Widowed2.6% DivorcedFemales 14.6% Never married71.3% Now married10.6% Separated0.0% Widowed3.5% DivorcedWomen who gave birth in the past 12 months Now married:
100.0% (65)Unmarried:
0.0% (0)
Women who did not give birth in the past 12 months Now married:
79.8% (277)Unmarried:
20.2% (70)
Marital status - Two or more races population 15 years and over
Males 41.8% Never married37.6% Now married4.2% Separated0.0% Widowed16.3% DivorcedFemales 38.1% Never married54.3% Now married0.5% Separated7.1% Widowed0.0% DivorcedWomen who did not give birth in the past 12 months Now married:
54.8% (89)Unmarried:
45.2% (73)
Marital status - White alone, not Hispanic / Latino population 15 years and over
Males 33.3% Never married51.9% Now married1.3% Separated3.6% Widowed9.9% DivorcedFemales 24.2% Never married53.3% Now married1.9% Separated9.2% Widowed11.5% DivorcedWomen who gave birth in the past 12 months Now married:
100.0% (118)Unmarried:
0.0% (0)
Women who did not give birth in the past 12 months Now married:
53.7% (1,904)Unmarried:
46.3% (1,640)
Marital status - Hispanic or Latino population 15 years and over
Males 46.0% Never married51.7% Now married0.0% Separated0.0% Widowed2.3% DivorcedFemales 22.1% Never married67.0% Now married8.4% Separated0.0% Widowed2.4% DivorcedWomen who gave birth in the past 12 months Now married:
100.0% (56)Unmarried:
0.0% (0)
Women who did not give birth in the past 12 months Now married:
70.2% (366)Unmarried:
29.8% (155)
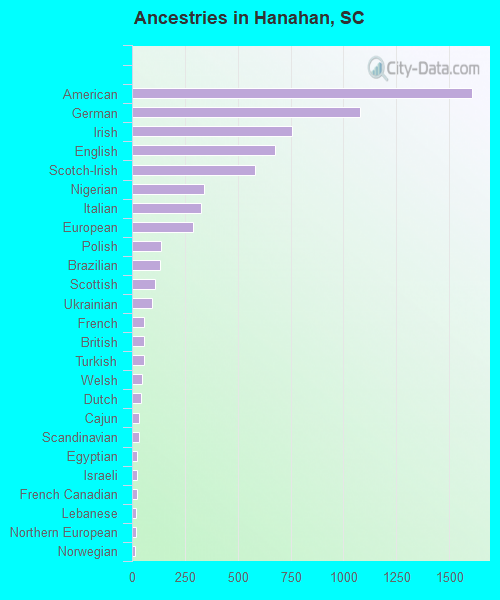
Ancestries in Hanahan
1,608 15.7% American1,076 10.5% German758 7.4% Irish676 6.6% English583 5.7% Scotch-Irish339 3.3% Nigerian327 3.2% Italian287 2.8% European135 1.3% Polish134 1.3% Brazilian110 1.1% Scottish94 0.9% Ukrainian57 0.6% French56 0.5% British56 0.5% Turkish47 0.5% Welsh43 0.4% Dutch33 0.3% Cajun33 0.3% Scandinavian25 0.2% Egyptian23 0.2% Israeli22 0.2% French Canadian18 0.2% Lebanese18 0.2% Northern European16 0.2% Norwegian12 0.1% Moroccan11 0.1% Eastern European11 0.1% Slovak10 0.10% Swedish7 0.07% Lithuanian6 0.06% Canadian
Geographical mobility in Hanahan Same house 1 year ago 14,412 90.9% White (Caucasian)1,752 76.9% Black or African American246 100.0% American Indian / Alaska Native578 88.1% Asian1,057 59.6% Other race727 71.2% Two or more races13,955 90.5% White alone, not Hispanic / Latino1,913 69.0% Hispanic or LatinoMoved within same county 318 2.0% White / Caucasian184 8.1% Black or African American78 11.9% Asian425 24.0% Other race16 1.6% Two or more races303 2.0% White alone, not Hispanic / Latino437 15.8% Hispanic or LatinoMoved within same state 507 3.2% White / Caucasian232 10.2% Black or African American114 6.4% Other race502 3.3% White alone, not Hispanic / Latino136 4.9% Hispanic or LatinoMoved from different state 572 3.6% White / Caucasian14 0.6% Black or African American5 0.7% Asian246 13.9% Other race300 29.3% Two or more races570 3.7% White alone, not Hispanic / Latino332 12.0% Hispanic or LatinoMoved from abroad 197 1.2% White64 6.3% Two or more races221 1.4% White alone, not Hispanic / Latino
Children Nativity (place of birth) in Hanahan
Children under 6 years - Living with two parents Both parents native 964 100.0% NativeBoth parents foreign-born 149 95.2% Native8 4.8% Foreign-bornOne native, one foreign-born parent 161 100.0% NativeChildren under 6 years - Living with one parent Native parent 716 94.8% Native39 5.2% Foreign-bornForeign-born parent 73 100.0% NativeChildren 6 to 17 years - Living with two parents Both parents native 1,799 100.0% NativeBoth parents foreign-born 287 89.6% Native33 10.4% Foreign-bornOne native, one foreign-born parent 363 100.0% NativeChildren 6 to 17 years - Living with one parent Native parent 632 100.0% NativeForeign-born parent 224 49.6% Native227 50.4% Foreign-born
Grandparents responsible for own grandchildren in Hanahan
Grandparents (30 to 59 years) White / Caucasian 55 45.2% Responsible for grandchildren67 54.8% Not responsible for grandchildrenBlack or African American 44 100.0% Not responsible for grandchildrenAmerican Indian / Alaska Native 9 100.0% Responsible for grandchildrenWhite alone, not Hispanic / Latino 55 49.3% Responsible for grandchildren57 50.7% Not responsible for grandchildrenGrandparents (60 years and over) White / Caucasian 16 13.1% Responsible for grandchildren106 86.9% Not responsible for grandchildrenBlack or African American 43 100.0% Not responsible for grandchildrenWhite alone, not Hispanic / Latino 16 12.3% Responsible for grandchildren114 87.7% Not responsible for grandchildren