Races in Harrisburg, North Carolina (NC) Detailed Stats
Data:
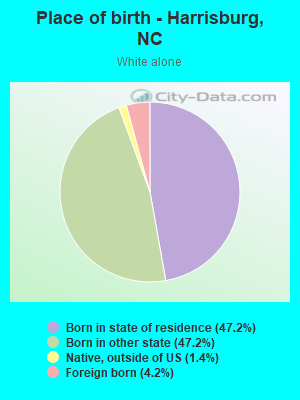
Races - White alone (%)
Races - White alone (% change since 2000)
Races - Black alone (%)
Races - Black alone (% change since 2000)
Races - American Indian alone (%)
Races - American Indian alone (% change since 2000)
Races - Asian alone (%)
Races - Asian alone (% change since 2000)
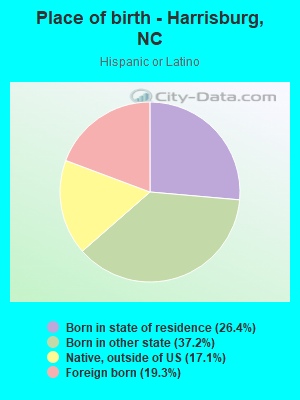
Races - Hispanic (%)
Races - Hispanic (% change since 2000)
Races - Native Hawaiian and Other Pacific Islander alone (%)
Races - Native Hawaiian and Other Pacific Islander alone (% change since 2000)
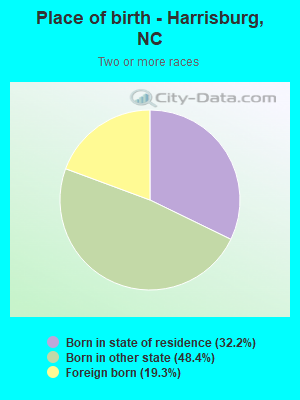
Races - Two or more races(%)
Races - Two or more races(% change since 2000)
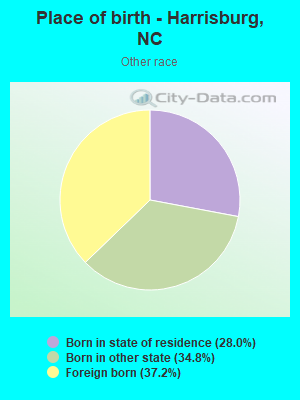
Races - Other race alone (%)
Races - Other race alone (% change since 2000)
Racial diversity
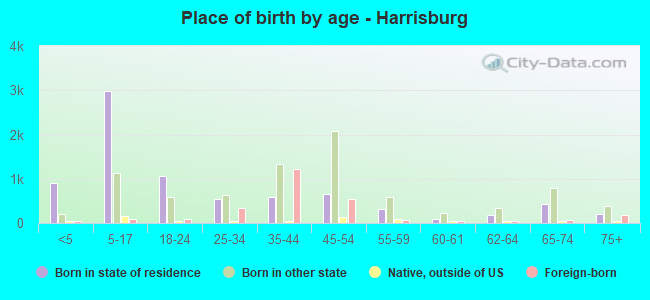
Place of birth - Born in state of residence (%)
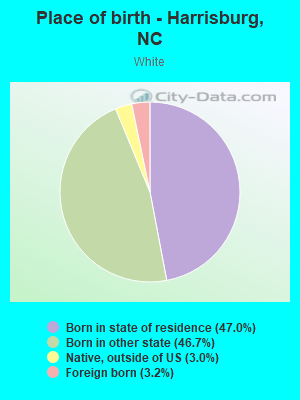
Place of birth - Born in state of residence (%) - White
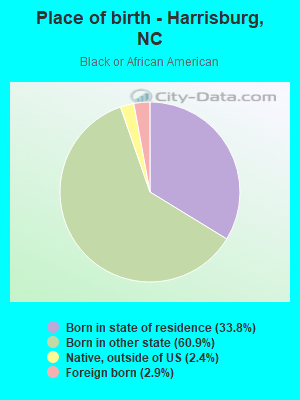
Place of birth - Born in state of residence (%) - Black or African American
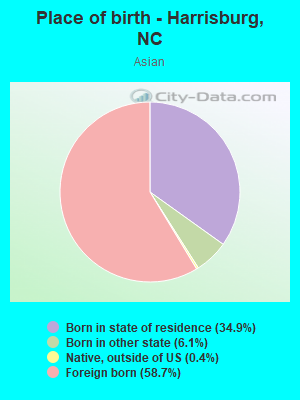
Place of birth - Born in state of residence (%) - Asian
Place of birth - Born in state of residence (%) - Hispanic or Latino
Place of birth - Born in state of residence (%) - American Indian and Alaska Native
Place of birth - Born in state of residence (%) - Multirace
Place of birth - Born in state of residence (%) - Other Race
Place of birth - Born in other state (%)
Place of birth - Born in other state (%) - White
Place of birth - Born in other state (%) - Black or African American
Place of birth - Born in other state (%) - Asian
Place of birth - Born in other state (%) - Hispanic or Latino
Place of birth - Born in other state (%) - American Indian and Alaska Native
Place of birth - Born in other state (%) - Multirace
Place of birth - Born in other state (%) - Other Race
Place of birth - Native, outside of US (%)
Place of birth - Native, outside of US (%) - White
Place of birth - Native, outside of US (%) - Black or African American
Place of birth - Native, outside of US (%) - Asian
Place of birth - Native, outside of US (%) - Hispanic or Latino
Place of birth - Native, outside of US (%) - American Indian and Alaska Native
Place of birth - Native, outside of US (%) - Multirace
Place of birth - Native, outside of US (%) - Other Race
Place of birth - Foreign born (%)
Place of birth - Foreign born (%) - White
Place of birth - Foreign born (%) - Black or African American
Place of birth - Foreign born (%) - Asian
Place of birth - Foreign born (%) - Hispanic or Latino
Place of birth - Foreign born (%) - American Indian and Alaska Native
Place of birth - Foreign born (%) - Multirace
Place of birth - Foreign born (%) - Other Race
Residents speaking English at home (%)
Residents speaking English at home - Born in the United States (%)
Residents speaking English at home - Native, born elsewhere (%)
Residents speaking English at home - Foreign born (%)
Residents speaking Spanish at home (%)
Residents speaking Spanish at home - Born in the United States (%)
Residents speaking Spanish at home - Native, born elsewhere (%)
Residents speaking Spanish at home - Foreign born (%)
Residents speaking other language at home (%)
Residents speaking other language at home - Born in the United States (%)
Residents speaking other language at home - Native, born elsewhere (%)
Residents speaking other language at home - Foreign born (%)
Marital status - Never married (%)
Marital status - Now married (%)
Marital status - Separated (%)
Marital status - Widowed (%)
Marital status - Divorced (%)
Ancestries Reported - Arab (%)
Ancestries Reported - Czech (%)
Ancestries Reported - Danish (%)
Ancestries Reported - Dutch (%)
Ancestries Reported - English (%)
Ancestries Reported - French (%)
Ancestries Reported - French Canadian (%)
Ancestries Reported - German (%)
Ancestries Reported - Greek (%)
Ancestries Reported - Hungarian (%)
Ancestries Reported - Irish (%)
Ancestries Reported - Italian (%)
Ancestries Reported - Lithuanian (%)
Ancestries Reported - Norwegian (%)
Ancestries Reported - Polish (%)
Ancestries Reported - Portuguese (%)
Ancestries Reported - Russian (%)
Ancestries Reported - Scotch-Irish (%)
Ancestries Reported - Scottish (%)
Ancestries Reported - Slovak (%)
Ancestries Reported - Subsaharan African (%)
Ancestries Reported - Swedish (%)
Ancestries Reported - Swiss (%)
Ancestries Reported - Ukrainian (%)
Ancestries Reported - United States (%)
Ancestries Reported - Welsh (%)
Ancestries Reported - West Indian (%)
Ancestries Reported - Other (%)
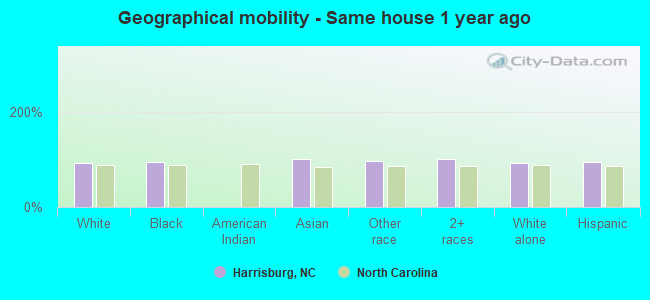
Geographical mobility - Same house 1 year ago (%)
Geographical mobility - Same house 1 year ago (%) - White
Geographical mobility - Same house 1 year ago (%) - Black or African American
Geographical mobility - Same house 1 year ago (%) - Asian
Geographical mobility - Same house 1 year ago (%) - Hispanic or Latino
Geographical mobility - Same house 1 year ago (%) - American Indian and Alaska Native
Geographical mobility - Same house 1 year ago (%) - Multirace
Geographical mobility - Same house 1 year ago (%) - Other Race
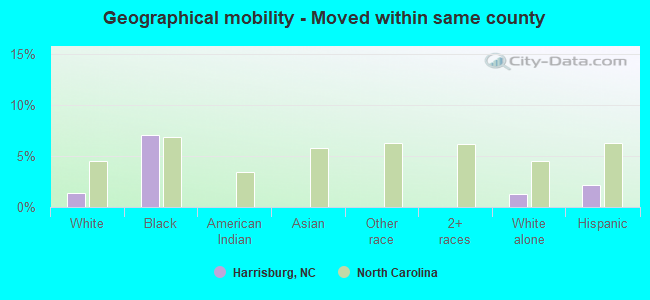
Geographical mobility - Moved within same county (%)
Geographical mobility - Moved within same county (%) - White
Geographical mobility - Moved within same county (%) - Black or African American
Geographical mobility - Moved within same county (%) - Asian
Geographical mobility - Moved within same county (%) - Hispanic or Latino
Geographical mobility - Moved within same county (%) - American Indian and Alaska Native
Geographical mobility - Moved within same county (%) - Multirace
Geographical mobility - Moved within same county (%) - Other Race
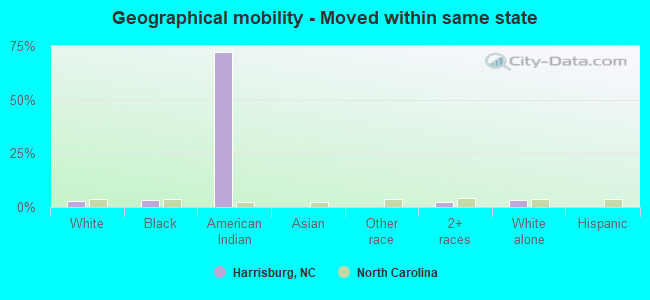
Geographical mobility - Moved from different county within same state (%)
Geographical mobility - Moved from different county within same state (%) - White
Geographical mobility - Moved from different county within same state (%) - Black or African American
Geographical mobility - Moved from different county within same state (%) - Asian
Geographical mobility - Moved from different county within same state (%) - Hispanic or Latino
Geographical mobility - Moved from different county within same state (%) - American Indian and Alaska Native
Geographical mobility - Moved from different county within same state (%) - Multirace
Geographical mobility - Moved from different county within same state (%) - Other Race
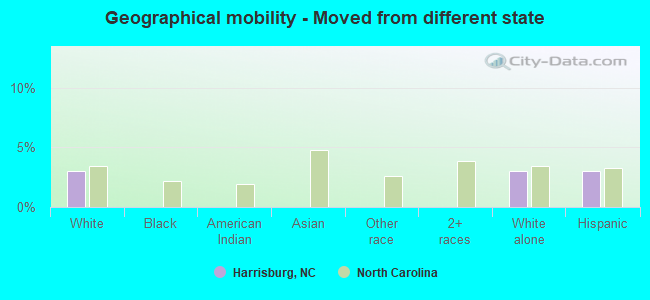
Geographical mobility - Moved from different state (%)
Geographical mobility - Moved from different state (%) - White
Geographical mobility - Moved from different state (%) - Black or African American
Geographical mobility - Moved from different state (%) - Asian
Geographical mobility - Moved from different state (%) - Hispanic or Latino
Geographical mobility - Moved from different state (%) - American Indian and Alaska Native
Geographical mobility - Moved from different state (%) - Multirace
Geographical mobility - Moved from different state (%) - Other Race
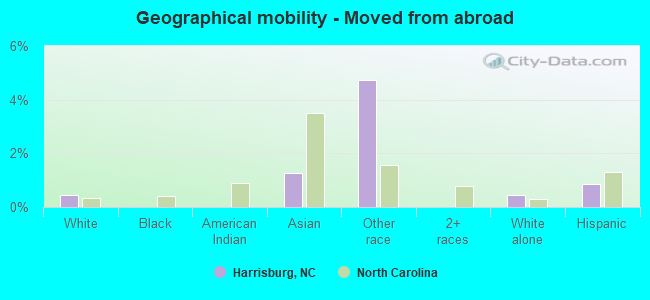
Geographical mobility - Moved from abroad (%)
Geographical mobility - Moved from abroad (%) - White
Geographical mobility - Moved from abroad (%) - Black or African American
Geographical mobility - Moved from abroad (%) - Asian
Geographical mobility - Moved from abroad (%) - Hispanic or Latino
Geographical mobility - Moved from abroad (%) - American Indian and Alaska Native
Geographical mobility - Moved from abroad (%) - Multirace
Geographical mobility - Moved from abroad (%) - Other Race
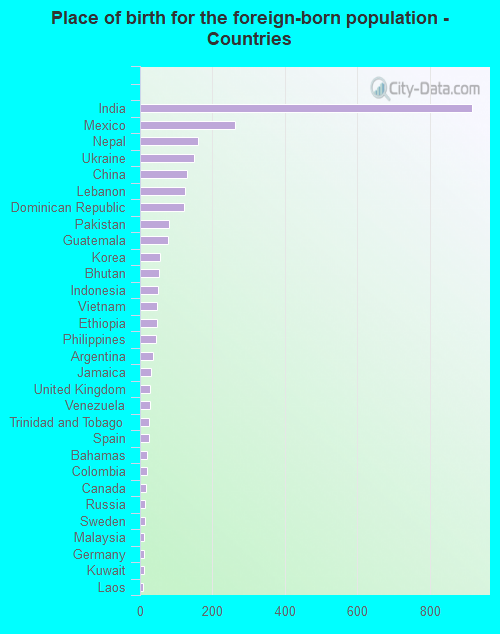
Place of birth for the foreign-born population - Ireland (%)
Place of birth for the foreign-born population - Denmark (%)
Place of birth for the foreign-born population - Norway (%)
Place of birth for the foreign-born population - Sweden (%)
Place of birth for the foreign-born population - United Kingdom (%)
Place of birth for the foreign-born population - England (%)
Place of birth for the foreign-born population - Scotland (%)
Place of birth for the foreign-born population - Other Northern Europe (%)
Place of birth for the foreign-born population - Austria (%)
Place of birth for the foreign-born population - Belgium (%)
Place of birth for the foreign-born population - France (%)
Place of birth for the foreign-born population - Germany (%)
Place of birth for the foreign-born population - Netherlands (%)
Place of birth for the foreign-born population - Switzerland (%)
Place of birth for the foreign-born population - Other Western Europe (%)
Place of birth for the foreign-born population - Greece (%)
Place of birth for the foreign-born population - Italy (%)
Place of birth for the foreign-born population - Portugal (%)
Place of birth for the foreign-born population - Spain (%)
Place of birth for the foreign-born population - Other Southern Europe (%)
Place of birth for the foreign-born population - Albania (%)
Place of birth for the foreign-born population - Belarus (%)
Place of birth for the foreign-born population - Bosnia and Herzegovina (%)
Place of birth for the foreign-born population - Bulgaria (%)
Place of birth for the foreign-born population - Croatia (%)
Place of birth for the foreign-born population - Czechoslovakia (%)
Place of birth for the foreign-born population - Hungary (%)
Place of birth for the foreign-born population - Latvia (%)
Place of birth for the foreign-born population - Lithuania (%)
Place of birth for the foreign-born population - North Macedonia (Macedonia) (%)
Place of birth for the foreign-born population - Moldova (%)
Place of birth for the foreign-born population - Poland (%)
Place of birth for the foreign-born population - Romania (%)
Place of birth for the foreign-born population - Russia (%)
Place of birth for the foreign-born population - Serbia (%)
Place of birth for the foreign-born population - Ukraine (%)
Place of birth for the foreign-born population - Other Eastern Europe (%)
Place of birth for the foreign-born population - China (%)
Place of birth for the foreign-born population - Hong Kong (%)
Place of birth for the foreign-born population - Taiwan (%)
Place of birth for the foreign-born population - Japan (%)
Place of birth for the foreign-born population - Korea (%)
Place of birth for the foreign-born population - Other Eastern Asia (%)
Place of birth for the foreign-born population - Afghanistan (%)
Place of birth for the foreign-born population - Bangladesh (%)
Place of birth for the foreign-born population - India (%)
Place of birth for the foreign-born population - Iran (%)
Place of birth for the foreign-born population - Kazakhstan (%)
Place of birth for the foreign-born population - Nepal (%)
Place of birth for the foreign-born population - Pakistan (%)
Place of birth for the foreign-born population - Sri Lanka (%)
Place of birth for the foreign-born population - Uzbekistan (%)
Place of birth for the foreign-born population - Other South Central Asia (%)
Place of birth for the foreign-born population - Burma (%)
Place of birth for the foreign-born population - Cambodia (%)
Place of birth for the foreign-born population - Indonesia (%)
Place of birth for the foreign-born population - Laos (%)
Place of birth for the foreign-born population - Malaysia (%)
Place of birth for the foreign-born population - Philippines (%)
Place of birth for the foreign-born population - Singapore (%)
Place of birth for the foreign-born population - Thailand (%)
Place of birth for the foreign-born population - Vietnam (%)
Place of birth for the foreign-born population - Other South Eastern Asia (%)
Place of birth for the foreign-born population - Armenia (%)
Place of birth for the foreign-born population - Iraq (%)
Place of birth for the foreign-born population - Israel (%)
Place of birth for the foreign-born population - Jordan (%)
Place of birth for the foreign-born population - Kuwait (%)
Place of birth for the foreign-born population - Lebanon (%)
Place of birth for the foreign-born population - Saudi Arabia (%)
Place of birth for the foreign-born population - Syria (%)
Place of birth for the foreign-born population - Turkey (%)
Place of birth for the foreign-born population - Yemen (%)
Place of birth for the foreign-born population - Other Western Asia (%)
Place of birth for the foreign-born population - Eritrea (%)
Place of birth for the foreign-born population - Ethiopia (%)
Place of birth for the foreign-born population - Kenya (%)
Place of birth for the foreign-born population - Somalia (%)
Place of birth for the foreign-born population - Uganda (%)
Place of birth for the foreign-born population - Zimbabwe (%)
Place of birth for the foreign-born population - Other Eastern Africa (%)
Place of birth for the foreign-born population - Cameroon (%)
Place of birth for the foreign-born population - Congo (%)
Place of birth for the foreign-born population - Democratic Republic of Congo (Zaire) (%)
Place of birth for the foreign-born population - Other Middle Africa (%)
Place of birth for the foreign-born population - Egypt (%)
Place of birth for the foreign-born population - Morocco (%)
Place of birth for the foreign-born population - Sudan (%)
Place of birth for the foreign-born population - Other Northern Africa (%)
Place of birth for the foreign-born population - South Africa (%)
Place of birth for the foreign-born population - Other Southern Africa (%)
Place of birth for the foreign-born population - Cabo Verde (%)
Place of birth for the foreign-born population - Ghana (%)
Place of birth for the foreign-born population - Liberia (%)
Place of birth for the foreign-born population - Nigeria (%)
Place of birth for the foreign-born population - Senegal (%)
Place of birth for the foreign-born population - Sierra Leone (%)
Place of birth for the foreign-born population - Other Western Africa (%)
Place of birth for the foreign-born population - Australia (%)
Place of birth for the foreign-born population - New Zealand (%)
Place of birth for the foreign-born population - Fiji (%)
Place of birth for the foreign-born population - Micronesia (%)
Place of birth for the foreign-born population - Bahamas (%)
Place of birth for the foreign-born population - Barbados (%)
Place of birth for the foreign-born population - Cuba (%)
Place of birth for the foreign-born population - Dominica (%)
Place of birth for the foreign-born population - Dominican Republic (%)
Place of birth for the foreign-born population - Grenada (%)
Place of birth for the foreign-born population - Haiti (%)
Place of birth for the foreign-born population - Jamaica (%)
Place of birth for the foreign-born population - St. Vincent and the Grenadines (%)
Place of birth for the foreign-born population - Trinidad and Tobago (%)
Place of birth for the foreign-born population - West Indies (%)
Place of birth for the foreign-born population - Other Caribbean (%)
Place of birth for the foreign-born population - Belize (%)
Place of birth for the foreign-born population - Costa Rica (%)
Place of birth for the foreign-born population - El Salvador (%)
Place of birth for the foreign-born population - Guatemala (%)
Place of birth for the foreign-born population - Honduras (%)
Place of birth for the foreign-born population - Mexico (%)
Place of birth for the foreign-born population - Nicaragua (%)
Place of birth for the foreign-born population - Panama (%)
Place of birth for the foreign-born population - Other Central America (%)
Place of birth for the foreign-born population - Argentina (%)
Place of birth for the foreign-born population - Bolivia (%)
Place of birth for the foreign-born population - Brazil (%)
Place of birth for the foreign-born population - Chile (%)
Place of birth for the foreign-born population - Colombia (%)
Place of birth for the foreign-born population - Ecuador (%)
Place of birth for the foreign-born population - Guyana (%)
Place of birth for the foreign-born population - Peru (%)
Place of birth for the foreign-born population - Uruguay (%)
Place of birth for the foreign-born population - Venezuela (%)
Place of birth for the foreign-born population - Other South America (%)
Place of birth for the foreign-born population - Canada (%)
Place of birth for the foreign-born population - Other Northern America (%)
Place of birth for the foreign-born population - Other (%)
Latest news about races in Harrisburg, NC collected exclusively by city-data.com from local newspapers, TV, and radio stations
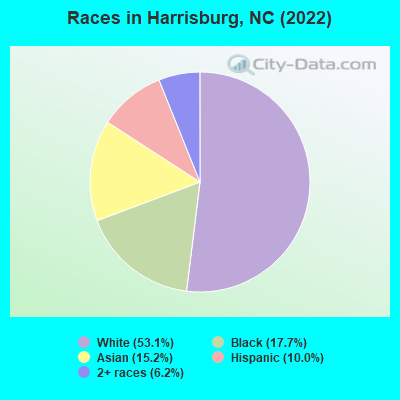
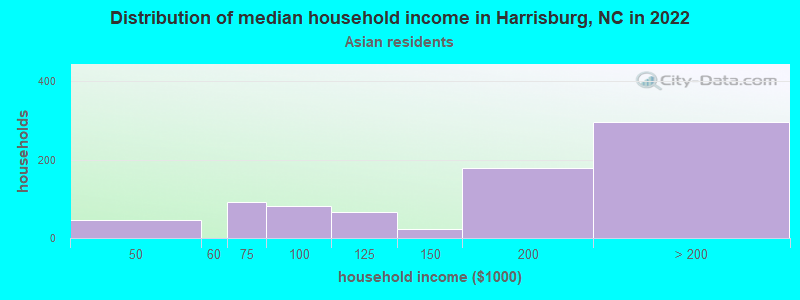
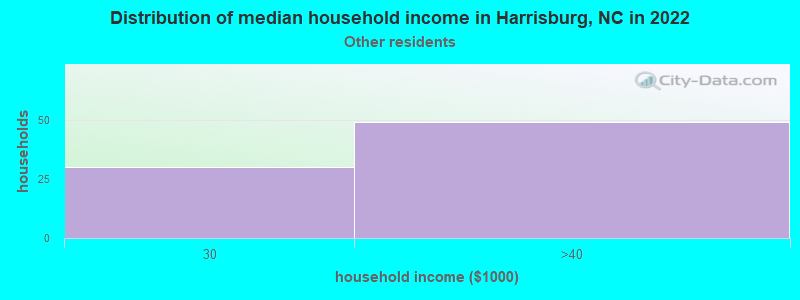
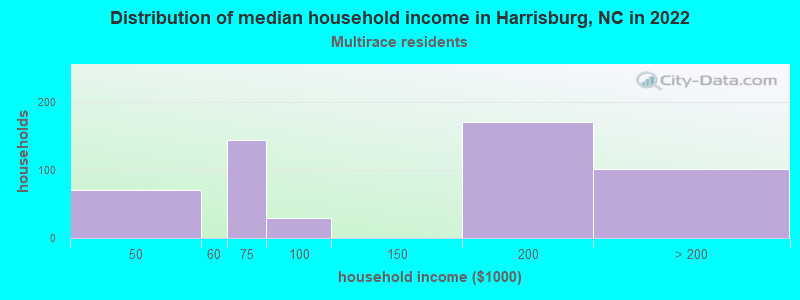
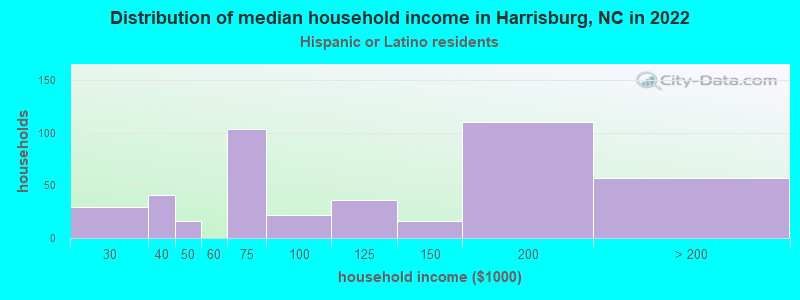
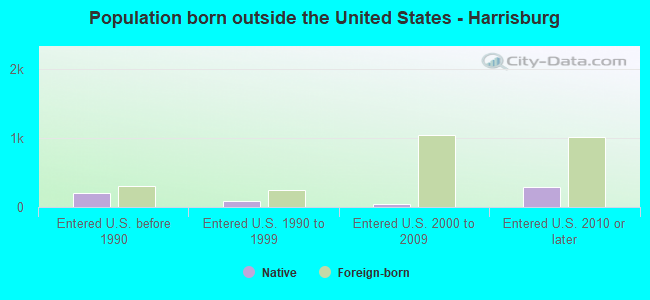
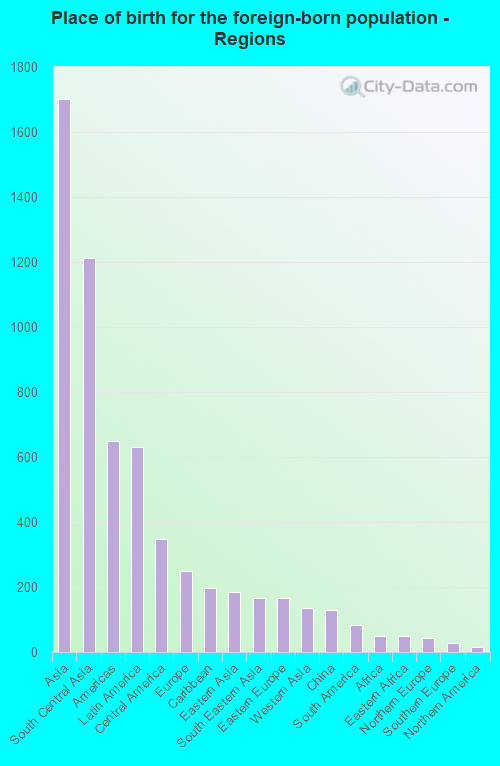
According to 2022 data, the most numerous races in Harrisburg, NC are White alone (10,465 residents), Black alone (3,493 residents), and Hispanic (1,975 residents). 77.5% of Harrisburg residents speak English at home. 13.4% of Harrisburg, NC residents are foreign-born (8.5% born in Asia, 3.2% born in Latin America), which is 40.4% greater than the foreign-born rate of 8.0% across the entire state of North Carolina.
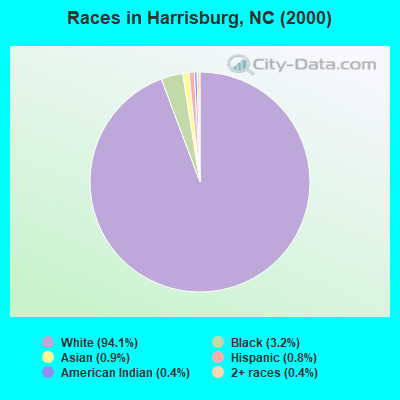
Race distribution in Harrisburg
2000 2022
5,647,155 70.2% White alone 1,723,301 21.4% Black alone 378,963 4.7% Hispanic 112,416 1.4% Asian alone 95,333 1.2% American Indian alone 79,965 1.0% Two or more races 9,015 0.1% Other race alone 3,165 0.04% Native Hawaiian and Other
6,497,519 60.7% White alone 2,155,650 20.1% Black alone 1,114,799 10.4% Hispanic 438,061 4.1% Two or more races 341,052 3.2% Asian alone 91,758 0.9% American Indian alone 50,180 0.5% Other race alone 9,954 0.09% Native Hawaiian and Other
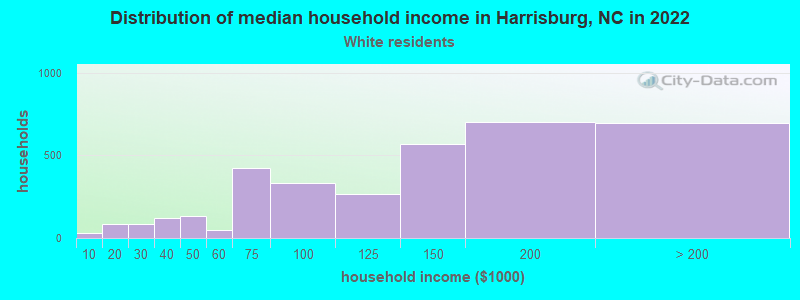
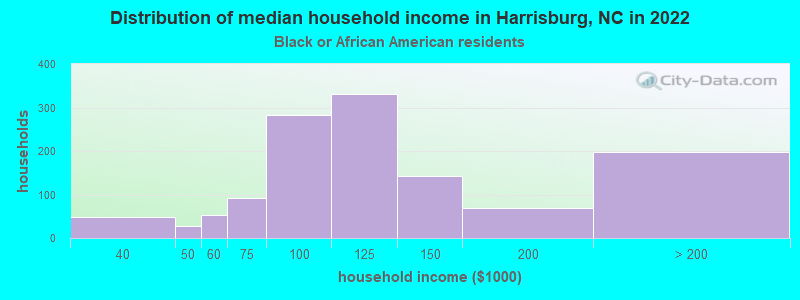
Income and house value in Harrisburg Median household income in 2022 $128,929 White non-Hispanic householders$122,089 Black householdersover $200,000 Asian householdersMedian 2022 house value $480,450 White Non-Hispanic householders$420,503 Black or African American householders
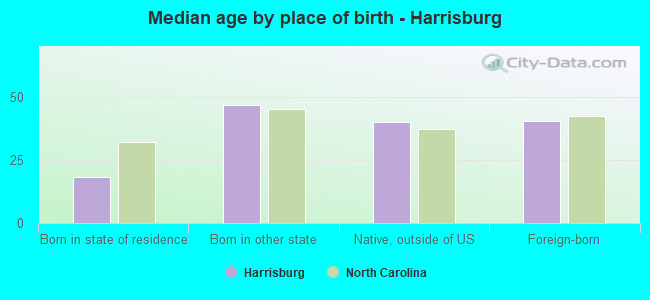
Median age by race in Harrisburg
41.6 Median age for White residents43.8 38.2 40.5 Median age for Black or African American residents39.6 42.8 -1,148,809,522.7 Median age for American Indian / Alaska Native residents-668,604,650.5 -682,971,013.8 33.2 Median age for Asian residents35.4 32.6 -609,884,331.7 Median age for Native Hawaiian / Pacific Islander residents-666,666,666.0 -612,403,100.2 22.5 Median age for Other race residents21.4 26.6 25.4 Median age for Two or more races residents24.7 25.4 41.5 Median age for White alone residents44.0 38.4 21.1 Median age for Hispanic or Latino residents31.4 21.0
Owner/renter occupied households by race in Harrisburg
House owners and renters - White residents 3,188 89.6% Owner occupied369 10.4% Renter occupiedHouse owners and renters - Black or African American residents 888 85.2% Owner occupied154 14.8% Renter occupiedHouse owners and renters - American Indian / Alaska Native residents 4 100.0% Owner occupiedHouse owners and renters - Asian residents 850 99.0% Owner occupied8 1.0% Renter occupiedHouse owners and renters - Other race residents 24 25.7% Owner occupied70 74.3% Renter occupiedHouse owners and renters - Two or more races residents 627 100.0% Owner occupiedHouse owners and renters - White alone residents 3,179 91.9% Owner occupied278 8.1% Renter occupiedHouse owners and renters - Hispanic or Latino residents 256 55.2% Owner occupied207 44.8% Renter occupied
Language usage in Harrisburg
English speakers - Total 77.5% of residents of Harrisburg speak English at home.
8.9% of residents speak Spanish at home 1,304 78.8% Speak English very well351 21.2% Speak English less than very well15.5% of residents speak other language at home 1,774 61.8% Speak English very well1,097 38.2% Speak English less than very well
English speakers - Born in the United States 92.2% of residents of Harrisburg speak English at home.
6.3% of residents speak Spanish at home 480 92.7% Speak English very well38 7.3% Speak English less than very well1.7% of residents speak other language at home 139 100.0% Speak English very well
English speakers - Native, born elsewhere 37.3% of residents of Harrisburg speak English at home.
34.2% of residents speak Spanish at home 207 100.0% Speak English very well
English speakers - Foreign-born 10.3% of residents of Harrisburg speak English at home.
17.3% of residents speak Spanish at home 227 50.6% Speak English very well222 49.4% Speak English less than very well83.9% of residents speak other language at home 1,193 54.7% Speak English very well988 45.3% Speak English less than very well
White (Caucasian) - Speak only English Native:
95.3% (9,434)Foreign-born:
10.9% (38)
White (Caucasian) - Speak another language Native:
3.5% (347)Foreign-born:
90.9% (319)
Black or African American - Speak only English Native:
91.9% (3,030)Foreign-born:
47.7% (47)
Black or African American - Speak another language Native:
10.3% (340)Foreign-born:
51.7% (51)
Asian - Speak only English Native:
38.4% (353)Foreign-born:
14.0% (250)
Asian - Speak another language Native:
58.8% (541)Foreign-born:
86.0% (1,535)
Other race - Speak another language Native:
77.0% (207)Foreign-born:
100.0% (155)
Two or more races - Speak only English Native:
77.4% (1,421)Foreign-born:
2.2% (9)
Two or more races - Speak another language Native:
6.6% (120)Foreign-born:
100.0% (412)
White alone - Speak only English Native:
99.0% (9,462)Foreign-born:
8.9% (39)
White alone - Speak another language Native:
1.0% (94)Foreign-born:
100.0% (438)
Hispanic or Latino - Speak only English Native:
33.8% (469)Foreign-born:
2.2% (8)
Hispanic or Latino - Speak another language Native:
67.0% (928)Foreign-born:
100.0% (385)
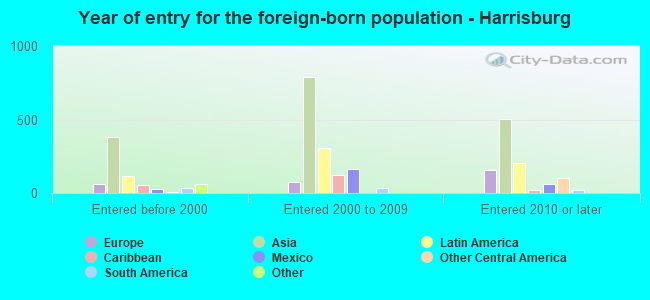
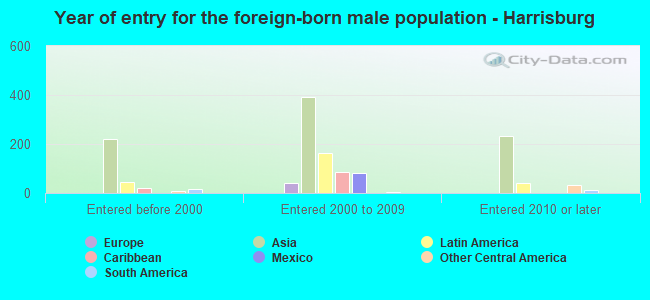
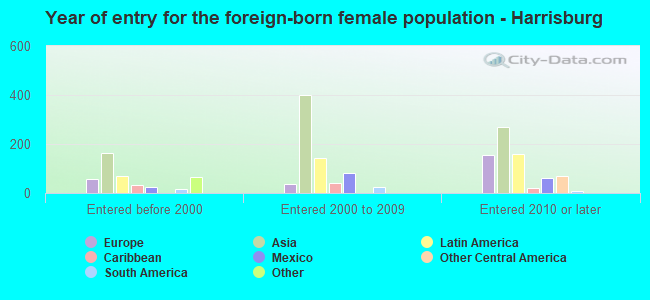
Foreign-born residents in Harrisburg 2,649 residents are foreign born (8.5% Asia , 3.2% Latin America ).
This city:
13.4%North Carolina:
8.3%
Marital status for residents in Harrisburg Marital status - White (Caucasian) population 15 years and over
Males 27.0% Never married67.5% Now married0.0% Separated0.9% Widowed4.6% DivorcedFemales 28.8% Never married56.8% Now married0.6% Separated6.6% Widowed7.1% DivorcedWomen who gave birth in the past 12 months Now married:
63.2% (88)Unmarried:
36.8% (51)
Women who did not give birth in the past 12 months Now married:
50.5% (1,289)Unmarried:
49.5% (1,261)
Marital status - Black or African American population 15 years and over
Males 38.2% Never married60.3% Now married0.0% Separated0.2% Widowed1.3% DivorcedFemales 43.2% Never married41.6% Now married0.0% Separated8.9% Widowed6.3% DivorcedWomen who gave birth in the past 12 months Now married:
100.0% (20)Unmarried:
0.0% (0)
Women who did not give birth in the past 12 months Now married:
28.7% (318)Unmarried:
71.3% (790)
Marital status - Asian population 15 years and over
Males 18.2% Never married80.7% Now married0.0% Separated0.0% Widowed1.1% DivorcedFemales 10.5% Never married82.4% Now married0.0% Separated4.1% Widowed3.0% DivorcedWomen who gave birth in the past 12 months Now married:
100.0% (21)Unmarried:
0.0% (0)
Women who did not give birth in the past 12 months Now married:
87.2% (637)Unmarried:
12.8% (93)
Marital status - Other race population 15 years and over
Males 43.2% Never married56.8% Now married0.0% Separated0.0% Widowed0.0% DivorcedFemales 74.1% Never married25.9% Now married0.0% Separated0.0% Widowed0.0% DivorcedWomen who did not give birth in the past 12 months Now married:
25.9% (86)Unmarried:
74.1% (247)
Marital status - Two or more races population 15 years and over
Males 40.9% Never married58.6% Now married0.0% Separated0.2% Widowed0.2% DivorcedFemales 51.1% Never married48.7% Now married0.0% Separated0.0% Widowed0.2% DivorcedWomen who gave birth in the past 12 months Now married:
100.0% (28)Unmarried:
0.0% (0)
Women who did not give birth in the past 12 months Now married:
38.8% (275)Unmarried:
61.2% (434)
Marital status - White alone, not Hispanic / Latino population 15 years and over
Males 25.5% Never married68.3% Now married0.1% Separated1.0% Widowed5.0% DivorcedFemales 29.3% Never married55.8% Now married0.7% Separated6.9% Widowed7.4% DivorcedWomen who gave birth in the past 12 months Now married:
50.9% (55)Unmarried:
49.1% (53)
Women who did not give birth in the past 12 months Now married:
50.2% (1,283)Unmarried:
49.8% (1,271)
Marital status - Hispanic or Latino population 15 years and over
Males 36.1% Never married63.9% Now married0.0% Separated0.0% Widowed0.0% DivorcedFemales 48.2% Never married51.8% Now married0.0% Separated0.0% Widowed0.0% DivorcedWomen who gave birth in the past 12 months Now married:
100.0% (64)Unmarried:
0.0% (0)
Women who did not give birth in the past 12 months Now married:
41.4% (248)Unmarried:
58.6% (351)
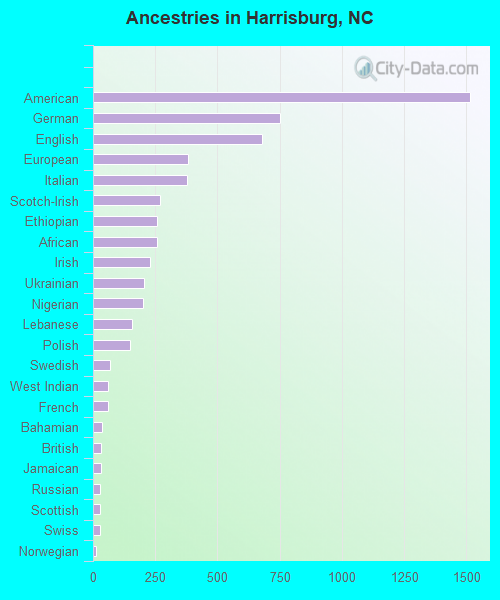
Ancestries in Harrisburg
1,515 14.0% American750 6.9% German680 6.3% English383 3.5% European377 3.5% Italian268 2.5% Scotch-Irish257 2.4% Ethiopian256 2.4% African228 2.1% Irish206 1.9% Ukrainian202 1.9% Nigerian155 1.4% Lebanese148 1.4% Polish67 0.6% Swedish62 0.6% West Indian61 0.6% French37 0.3% Bahamian34 0.3% British34 0.3% Jamaican29 0.3% Russian29 0.3% Scottish28 0.3% Swiss14 0.1% Norwegian11 0.1% Austrian11 0.1% Lithuanian11 0.1% Scandinavian8 0.07% Czech7 0.06% French Canadian6 0.06% Canadian1 0.01% Dutch
Geographical mobility in Harrisburg Same house 1 year ago 10,073 92.9% White (Caucasian)3,213 94.1% Black or African American2,556 100.0% Asian514 96.5% Other race1,810 100.0% Two or more races9,623 92.8% White alone, not Hispanic / Latino1,765 94.9% Hispanic or LatinoMoved within same county 153 1.4% White / Caucasian240 7.0% Black or African American131 1.3% White alone, not Hispanic / Latino41 2.2% Hispanic or LatinoMoved within same state 312 2.9% White / Caucasian106 3.1% Black or African American3 72.2% American Indian / Alaska Native41 2.3% Two or more races319 3.1% White alone, not Hispanic / LatinoMoved from different state 327 3.0% White / Caucasian310 3.0% White alone, not Hispanic / Latino56 3.0% Hispanic or LatinoMoved from abroad 48 0.4% White32 1.3% Asian25 4.7% Other race48 0.5% White alone, not Hispanic / Latino16 0.9% Hispanic or Latino
Children Nativity (place of birth) in Harrisburg
Children under 6 years - Living with two parents Both parents native 579 100.0% NativeBoth parents foreign-born 464 100.0% NativeOne native, one foreign-born parent 196 100.0% NativeChildren under 6 years - Living with one parent Native parent 197 100.0% NativeChildren 6 to 17 years - Living with two parents Both parents native 2,303 100.0% NativeBoth parents foreign-born 563 85.6% Native95 14.4% Foreign-bornOne native, one foreign-born parent 178 100.0% NativeChildren 6 to 17 years - Living with one parent Native parent 648 100.0% NativeForeign-born parent 96 49.2% Native99 50.8% Foreign-born
Grandparents responsible for own grandchildren in Harrisburg
Grandparents (30 to 59 years) White / Caucasian 39 30.3% Responsible for grandchildren90 69.7% Not responsible for grandchildrenWhite alone, not Hispanic / Latino 39 77.0% Responsible for grandchildren12 23.0% Not responsible for grandchildrenHispanic or Latino 176 100.0% Not responsible for grandchildren
Grandparents (60 years and over) White / Caucasian 184 100.0% Not responsible for grandchildrenWhite alone, not Hispanic / Latino 186 100.0% Not responsible for grandchildren