Races in Harrison Township, Pennsylvania (PA) Detailed Stats
Ancestries, Foreign-born residents, place of birth

Recent posts about races in Harrison Township, Pennsylvania on our local forum with over 2,400,000 registered users:
 | Best House for the Money in and around the Burgh. Location is irrelevant. (10 replies) |
| Suburb of the week: Harrison Township (4 replies) |
| Exurb of the Week: Allegheny Township (Westmoreland County) (0 replies) |
| Relocating to Pittsburgh (33 replies) |
1.2% of Harrison Township, PA residents are foreign-born , which is 462.8% less than the foreign-born rate of 7.0% across the entire state of Pennsylvania.
Race distribution in Harrison Township

- 10,32894.5%White alone
- 3993.6%Black alone
- 890.8%Two or more races
- 600.5%Hispanic
- 440.4%Asian alone
- 100.09%Other race alone
- 40.04%American Indian alone
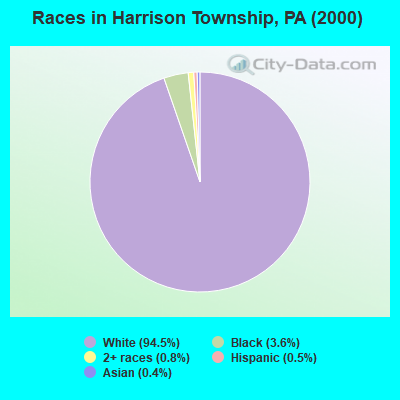
2000
2022
-
- 10,322,45584.1%White alone
- 1,202,4379.8%Black alone
- 394,0883.2%Hispanic
- 218,2961.8%Asian alone
- 113,0970.9%Two or more races
- 13,0860.1%Other race alone
- 14,9040.1%American Indian alone
- 2,6910.02%Native Hawaiian and Other
Pacific Islander alone

-
- 9,487,22873.1%White alone
- 1,311,58110.1%Black alone
- 1,115,9978.6%Hispanic
- 493,9423.8%Two or more races
- 487,1243.8%Asian alone
- 63,5820.5%Other race alone
- 10,1300.08%American Indian alone
- 2,4240.02%Native Hawaiian and Other
Pacific Islander alone

Income and house value in Harrison Township
- Median household income in 2022
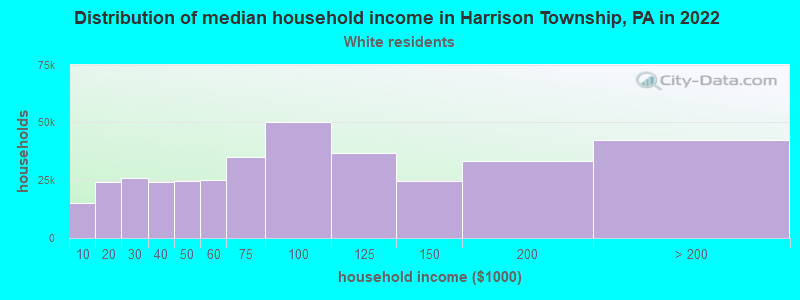
- $65,047White non-Hispanic householders
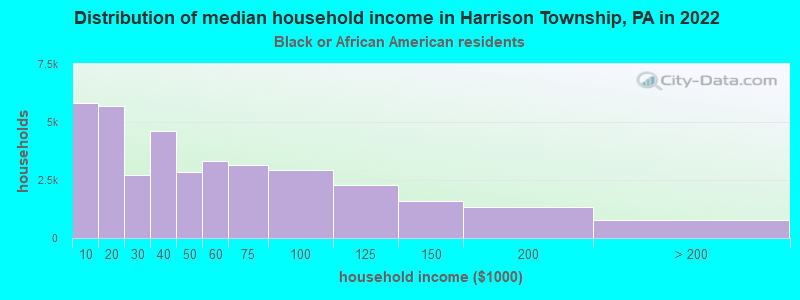
- $24,257Black householders
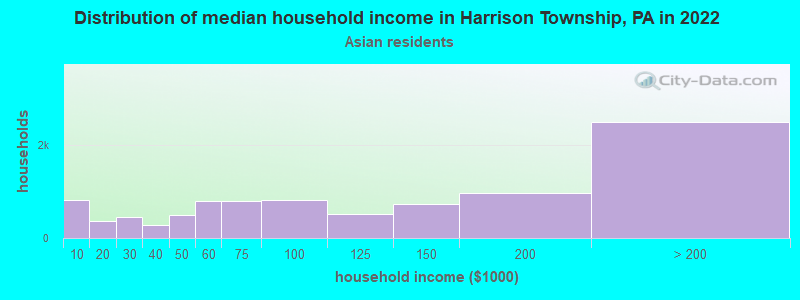
- $48,881Asian householders
- $16,838Two or more races householders
- $155,827Hispanic or Latino race householders
- Median 2022 house value
- $203,645White Non-Hispanic householders
- $172,580Black or African American householders
- $181,342Two or more races householders
Household income for White non-Hispanic householders
Household income for Black householders
Household income for Asian householders
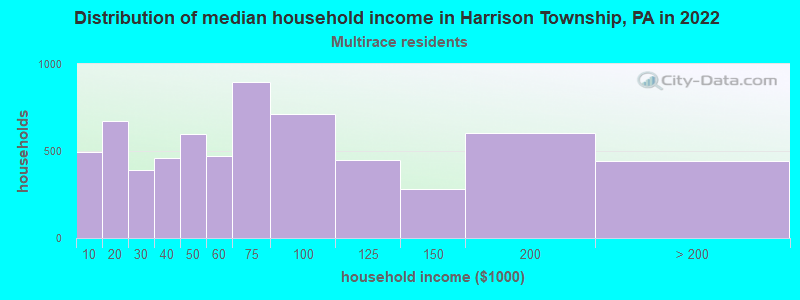
Household income for Two or more races householders
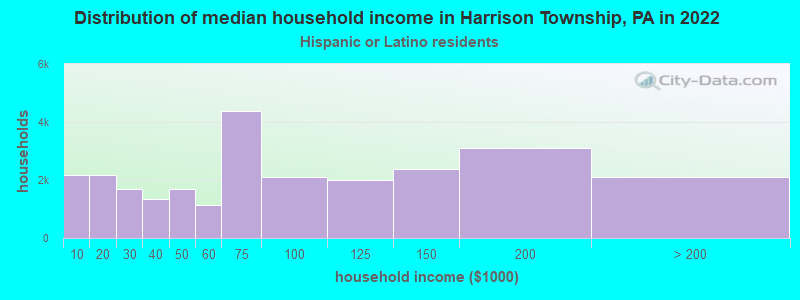
Household income for Hispanic or Latino race householders
Foreign-born residents in Harrison Township
136 residents are foreign born
| This city: | 1.2% |
| Pennsylvania: | 4.1% |
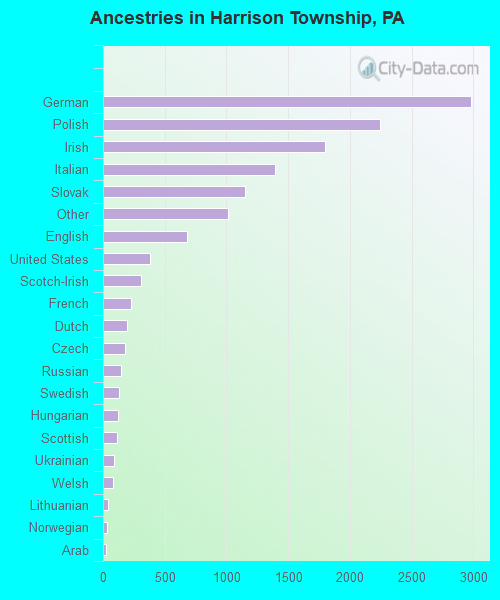
Ancestries in Harrison Township

- 2,97822.3%German
- 2,24616.8%Polish
- 1,79813.4%Irish
- 1,39710.4%Italian
- 1,1508.6%Slovak
- 1,0117.6%Other
- 6775.1%English
- 3782.8%United States
- 3072.3%Scotch-Irish
- 2301.7%French
- 1961.5%Dutch
- 1761.3%Czech
- 1461.1%Russian
- 1281.0%Swedish
- 1190.9%Hungarian
- 1160.9%Scottish
- 860.6%Ukrainian
- 820.6%Welsh
- 370.3%Lithuanian
- 320.2%Norwegian
- 280.2%Arab
- 240.2%Greek
- 170.1%Swiss
- 80.06%French Canadian
- 70.05%Subsaharan African
Zip codes: 15065.