Races in Harrisonville, Kentucky (KY) Detailed Stats
Ancestries, Foreign-born residents, place of birth
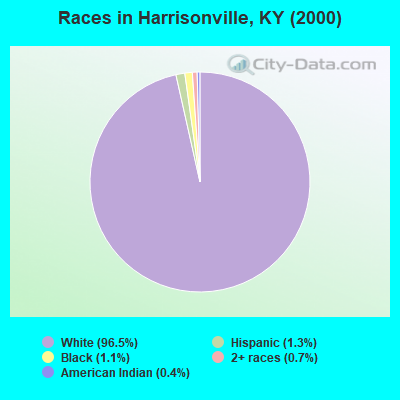
Race distribution in Harrisonville

- 4,11196.5%White alone
- 551.3%Hispanic
- 471.1%Black alone
- 300.7%Two or more races
- 160.4%American Indian alone
- 10.02%Asian alone
2000
2022
-
- 3,608,01389.3%White alone
- 293,6397.3%Black alone
- 59,9391.5%Hispanic
- 37,7500.9%Two or more races
- 29,3680.7%Asian alone
- 7,9390.2%American Indian alone
- 3,8460.10%Other race alone
- 1,2750.03%Native Hawaiian and Other
Pacific Islander alone

-
- 3,710,99882.2%White alone
- 343,1947.6%Black alone
- 187,4834.2%Hispanic
- 187,3944.2%Two or more races
- 62,2401.4%Asian alone
- 13,5290.3%Other race alone
- 4,3020.10%American Indian alone
- 3,1700.07%Native Hawaiian and Other
Pacific Islander alone

Income and house value in Harrisonville
- Median household income in 2022
- $85,981White non-Hispanic householders
- $64,176Black householders
- Median 2022 house value
- $213,365White Non-Hispanic householders
- $145,527Black or African American householders
Household income for White non-Hispanic householders

Household income for Black householders

Zip code: 40076