Races in Hartland, Connecticut (CT) Detailed Stats
Ancestries, Foreign-born residents, place of birth

Discuss Hartland, Connecticut races on our local forum with over 2,400,000 registered users
3.4% of Hartland, CT residents are foreign-born (2.3% born in Europe, 0.6% born in Asia), which is 343.8% less than the foreign-born rate of 15.0% across the entire state of Connecticut.
Race distribution in Hartland

- 1,97298.0%White alone
- 120.6%Hispanic
- 120.6%Asian alone
- 110.5%Two or more races
- 20.10%Black alone
- 10.05%Other race alone
- 10.05%American Indian alone
- 10.05%Native Hawaiian and Other
Pacific Islander alone

2000
2022
-
- 2,638,84577.5%White alone
- 320,3239.4%Hispanic
- 295,5718.7%Black alone
- 81,5642.4%Asian alone
- 52,8961.6%Two or more races
- 8,1410.2%Other race alone
- 7,2670.2%American Indian alone
- 9580.03%Native Hawaiian and Other
Pacific Islander alone

-
- 2,246,91362.0%White alone
- 658,97818.2%Hispanic
- 353,9739.8%Black alone
- 172,9294.8%Asian alone
- 159,6314.4%Two or more races
- 29,7610.8%Other race alone
- 3,4280.09%American Indian alone
- 5920.02%Native Hawaiian and Other
Pacific Islander alone

Income and house value in Hartland
- Median household income in 2022
- $112,436White non-Hispanic householders
- over $200,000Black householders
- $81,127Two or more races householders
- Median 2022 house value
- $351,523White Non-Hispanic householders
- $594,520Black or African American householders
- $279,316Two or more races householders
Household income for White non-Hispanic householders

Household income for Black householders

Household income for Two or more races householders

Foreign-born residents in Hartland
68 residents are foreign born (2.3% Europe, 0.6% Asia).
| This city: | 3.4% |
| Connecticut: | 10.9% |
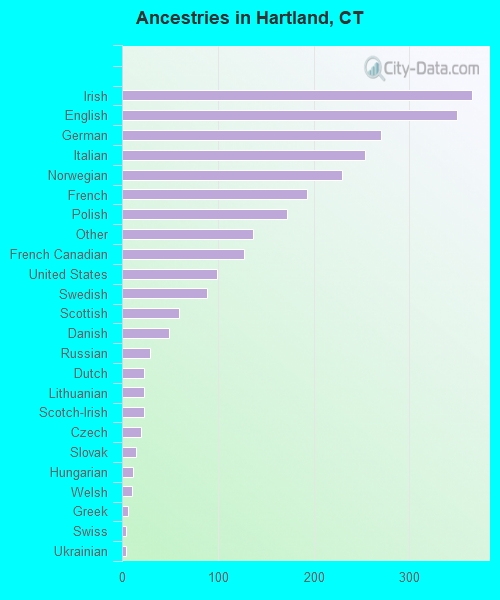
Ancestries in Hartland

- 36514.2%Irish
- 35013.7%English
- 27010.5%German
- 2549.9%Italian
- 2309.0%Norwegian
- 1937.5%French
- 1726.7%Polish
- 1375.3%Other
- 1275.0%French Canadian
- 993.9%United States
- 893.5%Swedish
- 602.3%Scottish
- 491.9%Danish
- 291.1%Russian
- 230.9%Dutch
- 230.9%Lithuanian
- 230.9%Scotch-Irish
- 200.8%Czech
- 150.6%Slovak
- 110.4%Hungarian
- 100.4%Welsh
- 60.2%Greek
- 40.2%Swiss
- 40.2%Ukrainian
- 10.04%Arab
Zip codes: 06091.