Races in Harvey, Louisiana (LA) Detailed Stats
Data:
Races - White alone (%)
Races - White alone (% change since 2000)
Races - Black alone (%)
Races - Black alone (% change since 2000)
Races - American Indian alone (%)
Races - American Indian alone (% change since 2000)
Races - Asian alone (%)
Races - Asian alone (% change since 2000)
Races - Hispanic (%)
Races - Hispanic (% change since 2000)
Races - Native Hawaiian and Other Pacific Islander alone (%)
Races - Native Hawaiian and Other Pacific Islander alone (% change since 2000)
Races - Two or more races(%)
Races - Two or more races(% change since 2000)
Races - Other race alone (%)
Races - Other race alone (% change since 2000)
Racial diversity
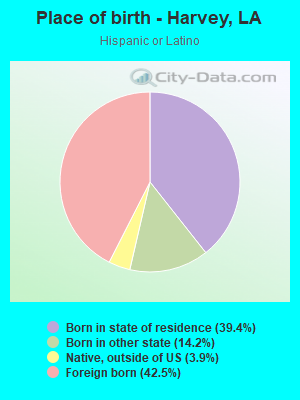
Place of birth - Born in state of residence (%)
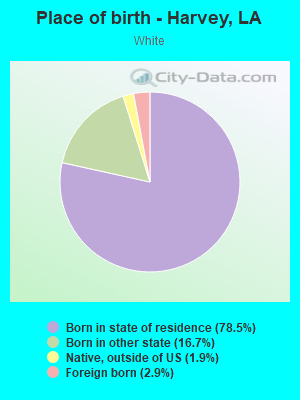
Place of birth - Born in state of residence (%) - White
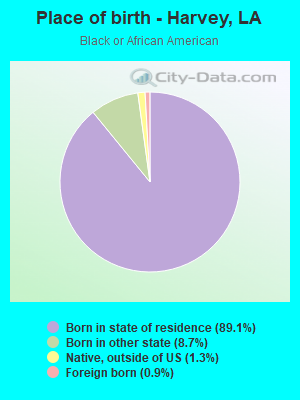
Place of birth - Born in state of residence (%) - Black or African American
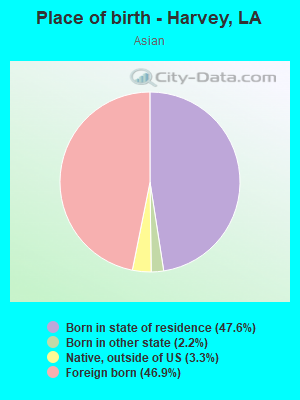
Place of birth - Born in state of residence (%) - Asian
Place of birth - Born in state of residence (%) - Hispanic or Latino
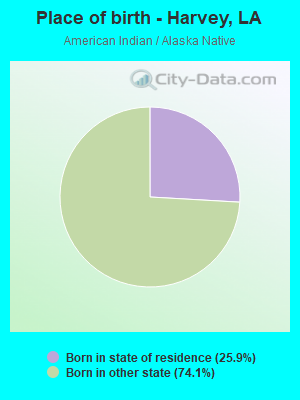
Place of birth - Born in state of residence (%) - American Indian and Alaska Native
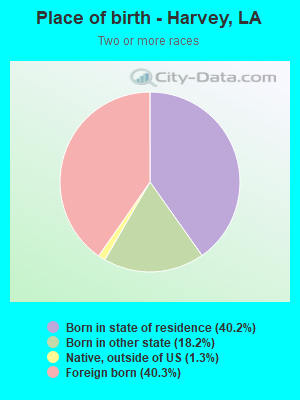
Place of birth - Born in state of residence (%) - Multirace
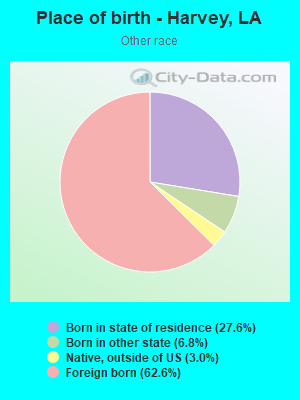
Place of birth - Born in state of residence (%) - Other Race
Place of birth - Born in other state (%)
Place of birth - Born in other state (%) - White
Place of birth - Born in other state (%) - Black or African American
Place of birth - Born in other state (%) - Asian
Place of birth - Born in other state (%) - Hispanic or Latino
Place of birth - Born in other state (%) - American Indian and Alaska Native
Place of birth - Born in other state (%) - Multirace
Place of birth - Born in other state (%) - Other Race
Place of birth - Native, outside of US (%)
Place of birth - Native, outside of US (%) - White
Place of birth - Native, outside of US (%) - Black or African American
Place of birth - Native, outside of US (%) - Asian
Place of birth - Native, outside of US (%) - Hispanic or Latino
Place of birth - Native, outside of US (%) - American Indian and Alaska Native
Place of birth - Native, outside of US (%) - Multirace
Place of birth - Native, outside of US (%) - Other Race
Place of birth - Foreign born (%)
Place of birth - Foreign born (%) - White
Place of birth - Foreign born (%) - Black or African American
Place of birth - Foreign born (%) - Asian
Place of birth - Foreign born (%) - Hispanic or Latino
Place of birth - Foreign born (%) - American Indian and Alaska Native
Place of birth - Foreign born (%) - Multirace
Place of birth - Foreign born (%) - Other Race
Residents speaking English at home (%)
Residents speaking English at home - Born in the United States (%)
Residents speaking English at home - Native, born elsewhere (%)
Residents speaking English at home - Foreign born (%)
Residents speaking Spanish at home (%)
Residents speaking Spanish at home - Born in the United States (%)
Residents speaking Spanish at home - Native, born elsewhere (%)
Residents speaking Spanish at home - Foreign born (%)
Residents speaking other language at home (%)
Residents speaking other language at home - Born in the United States (%)
Residents speaking other language at home - Native, born elsewhere (%)
Residents speaking other language at home - Foreign born (%)
Marital status - Never married (%)
Marital status - Now married (%)
Marital status - Separated (%)
Marital status - Widowed (%)
Marital status - Divorced (%)
Ancestries Reported - Arab (%)
Ancestries Reported - Czech (%)
Ancestries Reported - Danish (%)
Ancestries Reported - Dutch (%)
Ancestries Reported - English (%)
Ancestries Reported - French (%)
Ancestries Reported - French Canadian (%)
Ancestries Reported - German (%)
Ancestries Reported - Greek (%)
Ancestries Reported - Hungarian (%)
Ancestries Reported - Irish (%)
Ancestries Reported - Italian (%)
Ancestries Reported - Lithuanian (%)
Ancestries Reported - Norwegian (%)
Ancestries Reported - Polish (%)
Ancestries Reported - Portuguese (%)
Ancestries Reported - Russian (%)
Ancestries Reported - Scotch-Irish (%)
Ancestries Reported - Scottish (%)
Ancestries Reported - Slovak (%)
Ancestries Reported - Subsaharan African (%)
Ancestries Reported - Swedish (%)
Ancestries Reported - Swiss (%)
Ancestries Reported - Ukrainian (%)
Ancestries Reported - United States (%)
Ancestries Reported - Welsh (%)
Ancestries Reported - West Indian (%)
Ancestries Reported - Other (%)
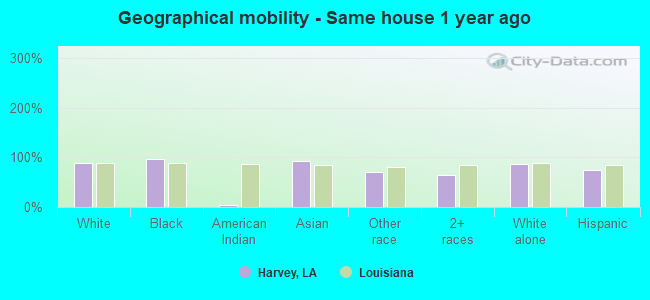
Geographical mobility - Same house 1 year ago (%)
Geographical mobility - Same house 1 year ago (%) - White
Geographical mobility - Same house 1 year ago (%) - Black or African American
Geographical mobility - Same house 1 year ago (%) - Asian
Geographical mobility - Same house 1 year ago (%) - Hispanic or Latino
Geographical mobility - Same house 1 year ago (%) - American Indian and Alaska Native
Geographical mobility - Same house 1 year ago (%) - Multirace
Geographical mobility - Same house 1 year ago (%) - Other Race
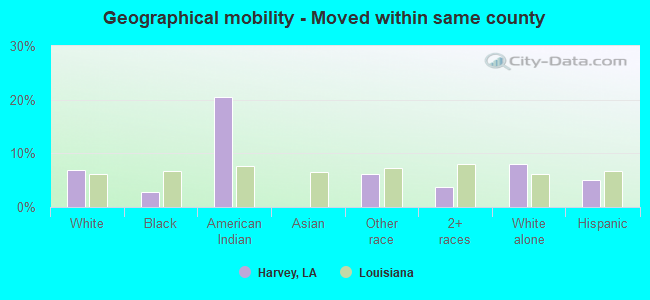
Geographical mobility - Moved within same county (%)
Geographical mobility - Moved within same county (%) - White
Geographical mobility - Moved within same county (%) - Black or African American
Geographical mobility - Moved within same county (%) - Asian
Geographical mobility - Moved within same county (%) - Hispanic or Latino
Geographical mobility - Moved within same county (%) - American Indian and Alaska Native
Geographical mobility - Moved within same county (%) - Multirace
Geographical mobility - Moved within same county (%) - Other Race
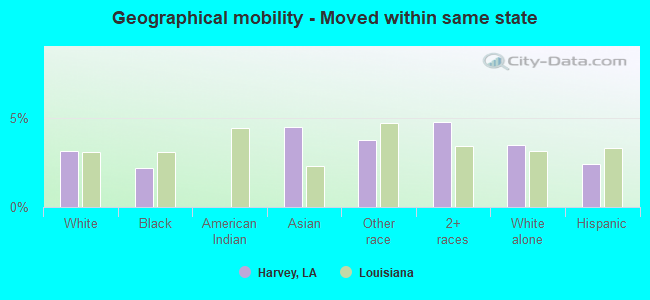
Geographical mobility - Moved from different county within same state (%)
Geographical mobility - Moved from different county within same state (%) - White
Geographical mobility - Moved from different county within same state (%) - Black or African American
Geographical mobility - Moved from different county within same state (%) - Asian
Geographical mobility - Moved from different county within same state (%) - Hispanic or Latino
Geographical mobility - Moved from different county within same state (%) - American Indian and Alaska Native
Geographical mobility - Moved from different county within same state (%) - Multirace
Geographical mobility - Moved from different county within same state (%) - Other Race
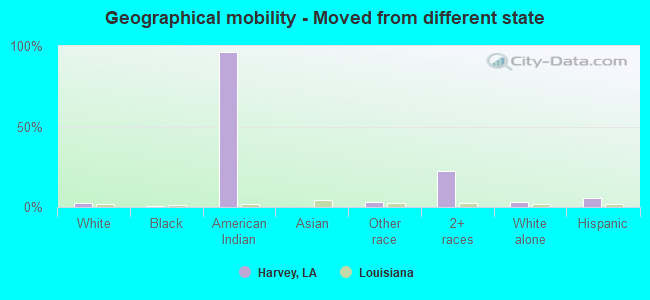
Geographical mobility - Moved from different state (%)
Geographical mobility - Moved from different state (%) - White
Geographical mobility - Moved from different state (%) - Black or African American
Geographical mobility - Moved from different state (%) - Asian
Geographical mobility - Moved from different state (%) - Hispanic or Latino
Geographical mobility - Moved from different state (%) - American Indian and Alaska Native
Geographical mobility - Moved from different state (%) - Multirace
Geographical mobility - Moved from different state (%) - Other Race
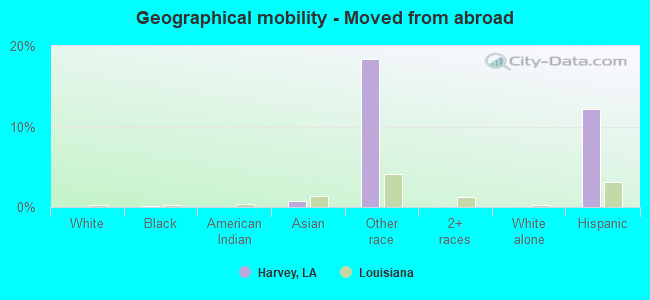
Geographical mobility - Moved from abroad (%)
Geographical mobility - Moved from abroad (%) - White
Geographical mobility - Moved from abroad (%) - Black or African American
Geographical mobility - Moved from abroad (%) - Asian
Geographical mobility - Moved from abroad (%) - Hispanic or Latino
Geographical mobility - Moved from abroad (%) - American Indian and Alaska Native
Geographical mobility - Moved from abroad (%) - Multirace
Geographical mobility - Moved from abroad (%) - Other Race
Place of birth for the foreign-born population - Ireland (%)
Place of birth for the foreign-born population - Denmark (%)
Place of birth for the foreign-born population - Norway (%)
Place of birth for the foreign-born population - Sweden (%)
Place of birth for the foreign-born population - United Kingdom (%)
Place of birth for the foreign-born population - England (%)
Place of birth for the foreign-born population - Scotland (%)
Place of birth for the foreign-born population - Other Northern Europe (%)
Place of birth for the foreign-born population - Austria (%)
Place of birth for the foreign-born population - Belgium (%)
Place of birth for the foreign-born population - France (%)
Place of birth for the foreign-born population - Germany (%)
Place of birth for the foreign-born population - Netherlands (%)
Place of birth for the foreign-born population - Switzerland (%)
Place of birth for the foreign-born population - Other Western Europe (%)
Place of birth for the foreign-born population - Greece (%)
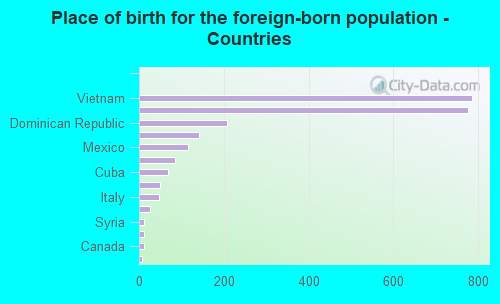
Place of birth for the foreign-born population - Italy (%)
Place of birth for the foreign-born population - Portugal (%)
Place of birth for the foreign-born population - Spain (%)
Place of birth for the foreign-born population - Other Southern Europe (%)
Place of birth for the foreign-born population - Albania (%)
Place of birth for the foreign-born population - Belarus (%)
Place of birth for the foreign-born population - Bosnia and Herzegovina (%)
Place of birth for the foreign-born population - Bulgaria (%)
Place of birth for the foreign-born population - Croatia (%)
Place of birth for the foreign-born population - Czechoslovakia (%)
Place of birth for the foreign-born population - Hungary (%)
Place of birth for the foreign-born population - Latvia (%)
Place of birth for the foreign-born population - Lithuania (%)
Place of birth for the foreign-born population - North Macedonia (Macedonia) (%)
Place of birth for the foreign-born population - Moldova (%)
Place of birth for the foreign-born population - Poland (%)
Place of birth for the foreign-born population - Romania (%)
Place of birth for the foreign-born population - Russia (%)
Place of birth for the foreign-born population - Serbia (%)
Place of birth for the foreign-born population - Ukraine (%)
Place of birth for the foreign-born population - Other Eastern Europe (%)
Place of birth for the foreign-born population - China (%)
Place of birth for the foreign-born population - Hong Kong (%)
Place of birth for the foreign-born population - Taiwan (%)
Place of birth for the foreign-born population - Japan (%)
Place of birth for the foreign-born population - Korea (%)
Place of birth for the foreign-born population - Other Eastern Asia (%)
Place of birth for the foreign-born population - Afghanistan (%)
Place of birth for the foreign-born population - Bangladesh (%)
Place of birth for the foreign-born population - India (%)
Place of birth for the foreign-born population - Iran (%)
Place of birth for the foreign-born population - Kazakhstan (%)
Place of birth for the foreign-born population - Nepal (%)
Place of birth for the foreign-born population - Pakistan (%)
Place of birth for the foreign-born population - Sri Lanka (%)
Place of birth for the foreign-born population - Uzbekistan (%)
Place of birth for the foreign-born population - Other South Central Asia (%)
Place of birth for the foreign-born population - Burma (%)
Place of birth for the foreign-born population - Cambodia (%)
Place of birth for the foreign-born population - Indonesia (%)
Place of birth for the foreign-born population - Laos (%)
Place of birth for the foreign-born population - Malaysia (%)
Place of birth for the foreign-born population - Philippines (%)
Place of birth for the foreign-born population - Singapore (%)
Place of birth for the foreign-born population - Thailand (%)
Place of birth for the foreign-born population - Vietnam (%)
Place of birth for the foreign-born population - Other South Eastern Asia (%)
Place of birth for the foreign-born population - Armenia (%)
Place of birth for the foreign-born population - Iraq (%)
Place of birth for the foreign-born population - Israel (%)
Place of birth for the foreign-born population - Jordan (%)
Place of birth for the foreign-born population - Kuwait (%)
Place of birth for the foreign-born population - Lebanon (%)
Place of birth for the foreign-born population - Saudi Arabia (%)
Place of birth for the foreign-born population - Syria (%)
Place of birth for the foreign-born population - Turkey (%)
Place of birth for the foreign-born population - Yemen (%)
Place of birth for the foreign-born population - Other Western Asia (%)
Place of birth for the foreign-born population - Eritrea (%)
Place of birth for the foreign-born population - Ethiopia (%)
Place of birth for the foreign-born population - Kenya (%)
Place of birth for the foreign-born population - Somalia (%)
Place of birth for the foreign-born population - Uganda (%)
Place of birth for the foreign-born population - Zimbabwe (%)
Place of birth for the foreign-born population - Other Eastern Africa (%)
Place of birth for the foreign-born population - Cameroon (%)
Place of birth for the foreign-born population - Congo (%)
Place of birth for the foreign-born population - Democratic Republic of Congo (Zaire) (%)
Place of birth for the foreign-born population - Other Middle Africa (%)
Place of birth for the foreign-born population - Egypt (%)
Place of birth for the foreign-born population - Morocco (%)
Place of birth for the foreign-born population - Sudan (%)
Place of birth for the foreign-born population - Other Northern Africa (%)
Place of birth for the foreign-born population - South Africa (%)
Place of birth for the foreign-born population - Other Southern Africa (%)
Place of birth for the foreign-born population - Cabo Verde (%)
Place of birth for the foreign-born population - Ghana (%)
Place of birth for the foreign-born population - Liberia (%)
Place of birth for the foreign-born population - Nigeria (%)
Place of birth for the foreign-born population - Senegal (%)
Place of birth for the foreign-born population - Sierra Leone (%)
Place of birth for the foreign-born population - Other Western Africa (%)
Place of birth for the foreign-born population - Australia (%)
Place of birth for the foreign-born population - New Zealand (%)
Place of birth for the foreign-born population - Fiji (%)
Place of birth for the foreign-born population - Micronesia (%)
Place of birth for the foreign-born population - Bahamas (%)
Place of birth for the foreign-born population - Barbados (%)
Place of birth for the foreign-born population - Cuba (%)
Place of birth for the foreign-born population - Dominica (%)
Place of birth for the foreign-born population - Dominican Republic (%)
Place of birth for the foreign-born population - Grenada (%)
Place of birth for the foreign-born population - Haiti (%)
Place of birth for the foreign-born population - Jamaica (%)
Place of birth for the foreign-born population - St. Vincent and the Grenadines (%)
Place of birth for the foreign-born population - Trinidad and Tobago (%)
Place of birth for the foreign-born population - West Indies (%)
Place of birth for the foreign-born population - Other Caribbean (%)
Place of birth for the foreign-born population - Belize (%)
Place of birth for the foreign-born population - Costa Rica (%)
Place of birth for the foreign-born population - El Salvador (%)
Place of birth for the foreign-born population - Guatemala (%)
Place of birth for the foreign-born population - Honduras (%)
Place of birth for the foreign-born population - Mexico (%)
Place of birth for the foreign-born population - Nicaragua (%)
Place of birth for the foreign-born population - Panama (%)
Place of birth for the foreign-born population - Other Central America (%)
Place of birth for the foreign-born population - Argentina (%)
Place of birth for the foreign-born population - Bolivia (%)
Place of birth for the foreign-born population - Brazil (%)
Place of birth for the foreign-born population - Chile (%)
Place of birth for the foreign-born population - Colombia (%)
Place of birth for the foreign-born population - Ecuador (%)
Place of birth for the foreign-born population - Guyana (%)
Place of birth for the foreign-born population - Peru (%)
Place of birth for the foreign-born population - Uruguay (%)
Place of birth for the foreign-born population - Venezuela (%)
Place of birth for the foreign-born population - Other South America (%)
Place of birth for the foreign-born population - Canada (%)
Place of birth for the foreign-born population - Other Northern America (%)
Place of birth for the foreign-born population - Other (%)
Latest news about races in Harvey, LA collected exclusively by city-data.com from local newspapers, TV, and radio stations
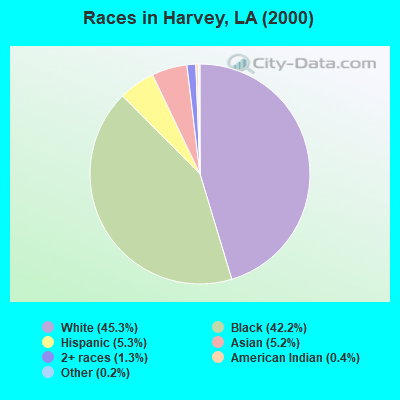
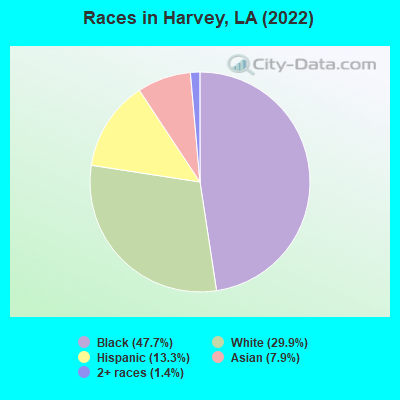
According to 2022 data, the most numerous races in Harvey, LA are White alone (6,264 residents), Black alone (10,013 residents), and Hispanic (2,784 residents). 82.1% of Harvey residents speak English at home. 11.4% of Harvey, LA residents are foreign-born (6.7% born in Latin America, 3.8% born in Asia), which is 65.1% greater than the foreign-born rate of 4.0% across the entire state of Louisiana.
Race distribution in Harvey
2000 2022
2,794,391 62.5% White alone 1,443,390 32.3% Black alone 107,738 2.4% Hispanic 54,256 1.2% Asian alone 39,260 0.9% Two or more races 24,129 0.5% American Indian alone 4,736 0.1% Other race alone 1,076 0.02% Native Hawaiian and Other
2,603,221 56.7% White alone 1,420,055 30.9% Black alone 262,213 5.7% Hispanic 183,270 4.0% Two or more races 81,169 1.8% Asian alone 19,991 0.4% American Indian alone 18,043 0.4% Other race alone 2,279 0.05% Native Hawaiian and Other
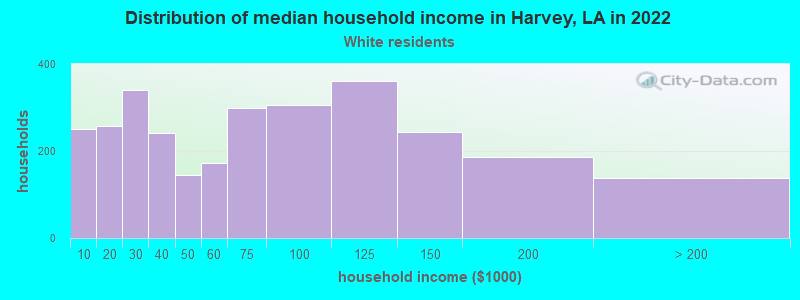
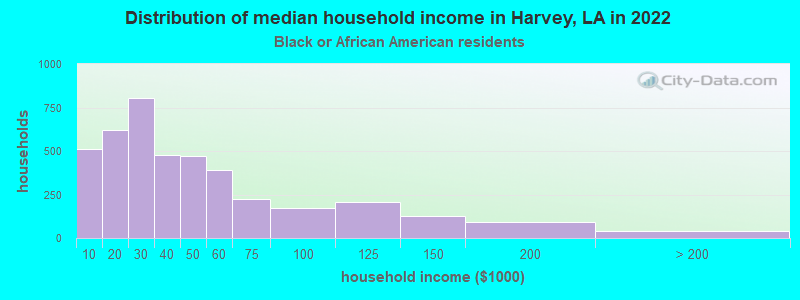
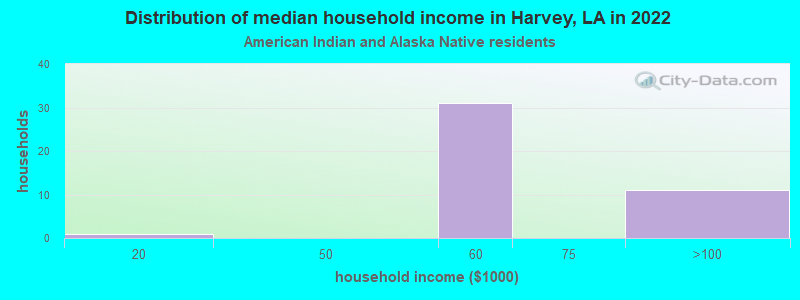
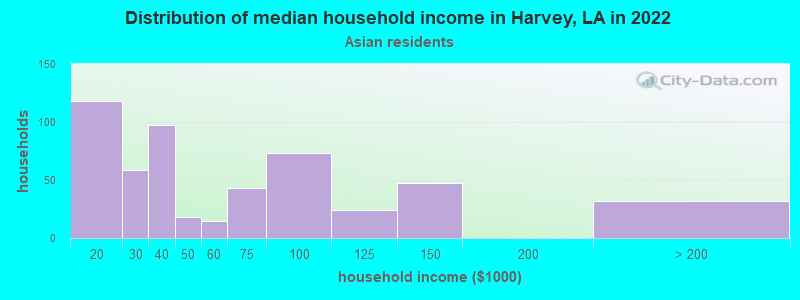
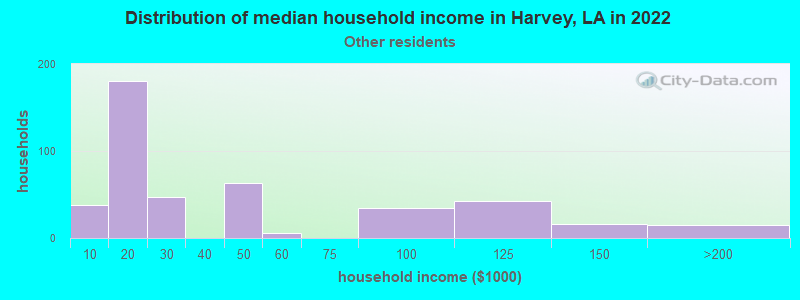
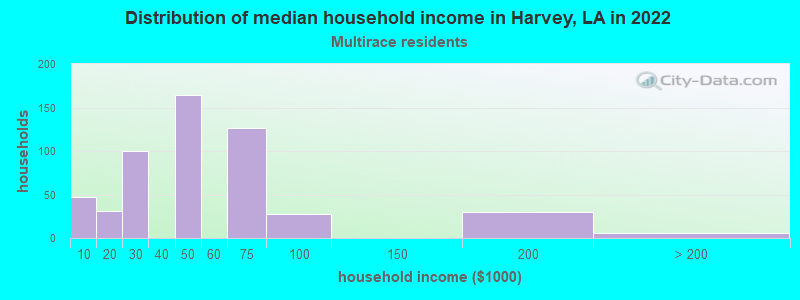
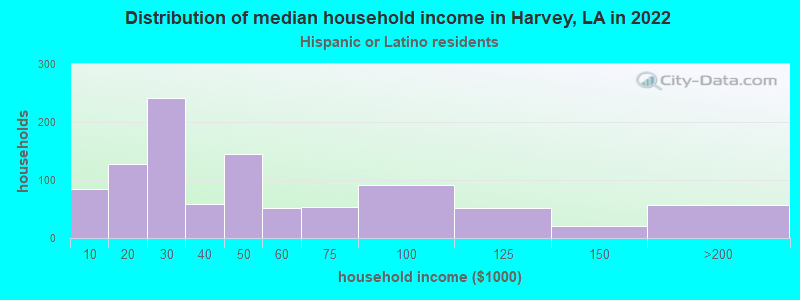
Income and house value in Harvey Median household income in 2022 $67,706 White non-Hispanic householders$33,706 Black householders$59,870 American Indian and Alaska Native householders$51,045 Asian householders$50,219 Two or more races householders$28,467 Hispanic or Latino race householdersMedian 2022 house value $198,726 White Non-Hispanic householders$189,220 Black or African American householders$143,273 American Indian or Alaska Native householders $219,549 Asian householders$169,754 Native Hawaiian and other Pacific Islander householders$184,014 Some other race householders$245,805 Two or more races householders$186,956 Hispanic or Latino householders
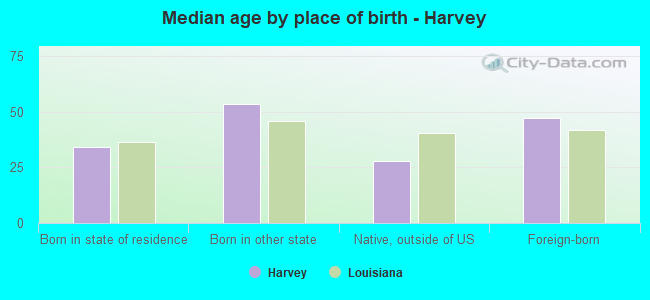
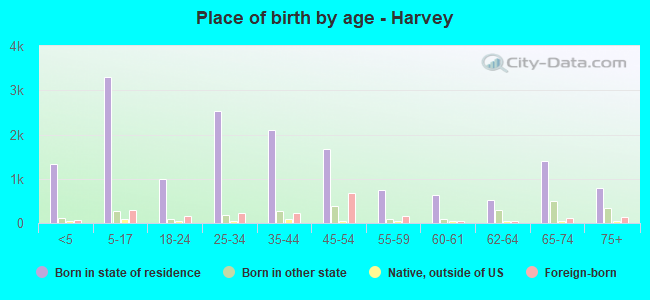
Median age by race in Harvey
48.5 Median age for White residents49.8 45.5 35.9 Median age for Black or African American residents31.5 40.3 48.0 Median age for American Indian / Alaska Native residents-679,966,749.1 64.7 34.5 Median age for Asian residents41.2 25.8 -1,031,509,120.0 Median age for Native Hawaiian / Pacific Islander residents-868,167,201.7 -599,999,999.4 17.7 Median age for Other race residents16.9 17.6 38.3 Median age for Two or more races residents36.0 41.6 50.1 Median age for White alone residents49.9 47.8 22.1 Median age for Hispanic or Latino residents17.0 28.0
Owner/renter occupied households by race in Harvey
House owners and renters - White residents 2,142 73.2% Owner occupied785 26.8% Renter occupiedHouse owners and renters - Black or African American residents 1,629 41.0% Owner occupied2,345 59.0% Renter occupiedHouse owners and renters - American Indian / Alaska Native residents 9 14.6% Owner occupied55 85.4% Renter occupiedHouse owners and renters - Asian residents 318 69.6% Owner occupied139 30.4% Renter occupiedHouse owners and renters - Other race residents 51 12.3% Owner occupied362 87.7% Renter occupiedHouse owners and renters - Two or more races residents 478 74.9% Owner occupied160 25.1% Renter occupiedHouse owners and renters - White alone residents 2,114 74.0% Owner occupied744 26.0% Renter occupiedHouse owners and renters - Hispanic or Latino residents 365 39.4% Owner occupied560 60.6% Renter occupied
Language usage in Harvey
English speakers - Total 82.1% of residents of Harvey speak English at home.
8.6% of residents speak Spanish at home 651 39.1% Speak English very well1,015 60.9% Speak English less than very well9.3% of residents speak other language at home 986 54.5% Speak English very well824 45.5% Speak English less than very well
English speakers - Born in the United States 88.0% of residents of Harvey speak English at home.
7.5% of residents speak Spanish at home 168 89.8% Speak English very well19 10.2% Speak English less than very well5.5% of residents speak other language at home 82 60.3% Speak English very well54 39.7% Speak English less than very well
English speakers - Native, born elsewhere 39.9% of residents of Harvey speak English at home.
11.7% of residents speak Spanish at home 21 47.7% Speak English very well23 52.3% Speak English less than very well35.4% of residents speak other language at home 60 45.1% Speak English very well73 54.9% Speak English less than very well
English speakers - Foreign-born 5.4% of residents of Harvey speak English at home.
46.6% of residents speak Spanish at home 196 20.9% Speak English very well740 79.1% Speak English less than very well48.5% of residents speak other language at home 302 31.0% Speak English very well672 69.0% Speak English less than very well
White (Caucasian) - Speak only English Native:
94.3% (5,878)Foreign-born:
14.4% (29)
White (Caucasian) - Speak another language Native:
5.3% (329)Foreign-born:
79.5% (157)
Black or African American - Speak only English Native:
96.4% (8,995)Foreign-born:
18.0% (16)
Black or African American - Speak another language Native:
3.7% (344)Foreign-born:
82.3% (75)
Asian - Speak only English Native:
26.5% (236)Foreign-born:
3.0% (24)
Asian - Speak another language Native:
75.4% (672)Foreign-born:
97.3% (777)
Other race - Speak only English Native:
8.1% (27)Foreign-born:
13.6% (106)
Other race - Speak another language Native:
73.7% (245)Foreign-born:
86.6% (674)
Two or more races - Speak another language Native:
12.2% (80)Foreign-born:
100.0% (567)
White alone - Speak only English Native:
94.6% (5,722)Foreign-born:
25.8% (16)
White alone - Speak another language Native:
5.1% (307)Foreign-born:
70.7% (43)
Hispanic or Latino - Speak only English Native:
49.9% (549)Foreign-born:
5.2% (59)
Hispanic or Latino - Speak another language Native:
47.3% (520)Foreign-born:
93.7% (1,061)
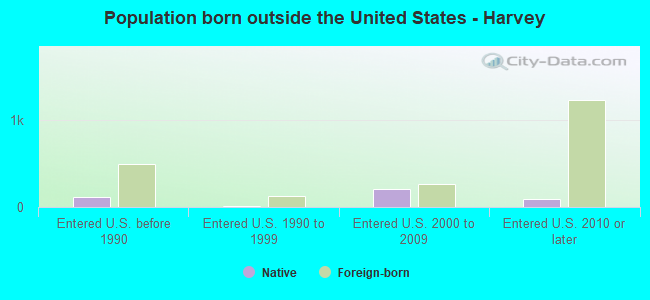
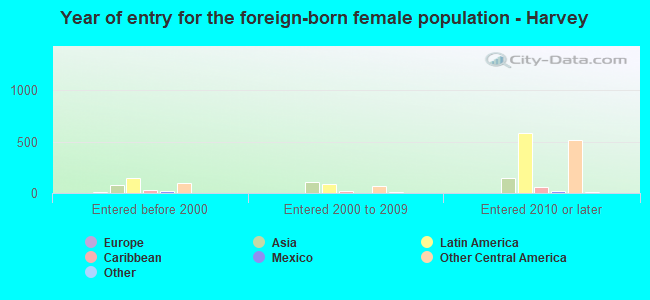
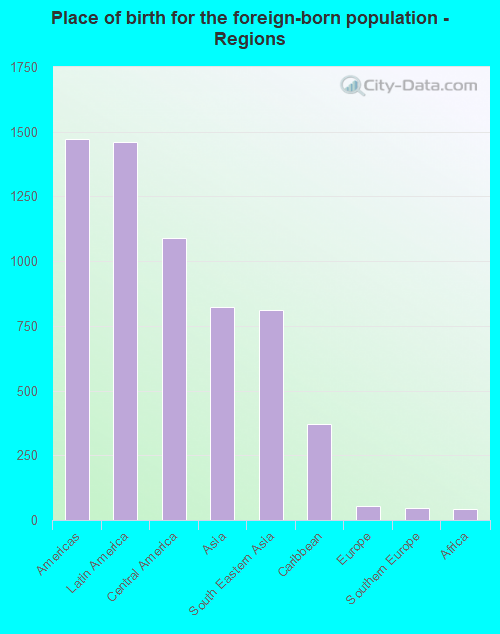
Foreign-born residents in Harvey 2,401 residents are foreign born (6.7% Latin America , 3.8% Asia ).
This city:
11.4%Louisiana:
4.2%
Marital status for residents in Harvey Marital status - White (Caucasian) population 15 years and over
Males 30.1% Never married41.9% Now married6.6% Separated5.9% Widowed15.6% DivorcedFemales 26.5% Never married44.9% Now married0.3% Separated11.3% Widowed16.9% DivorcedWomen who gave birth in the past 12 months Now married:
67.0% (54)Unmarried:
33.0% (27)
Women who did not give birth in the past 12 months Now married:
39.2% (470)Unmarried:
60.8% (727)
Marital status - Black or African American population 15 years and over
Males 47.9% Never married27.3% Now married6.3% Separated3.5% Widowed14.9% DivorcedFemales 46.3% Never married31.6% Now married4.0% Separated10.2% Widowed8.0% DivorcedWomen who gave birth in the past 12 months Now married:
37.3% (79)Unmarried:
62.7% (134)
Women who did not give birth in the past 12 months Now married:
31.2% (673)Unmarried:
68.8% (1,485)
Marital status - American Indian / Alaska Native population 15 years and over
Males 100.0% Never married0.0% Now married0.0% Separated0.0% Widowed0.0% DivorcedFemales 0.0% Never married0.0% Now married73.2% Separated2.4% Widowed24.4% DivorcedWomen who did not give birth in the past 12 months Now married:
100.0% (25)Unmarried:
0.0% (0)
Marital status - Asian population 15 years and over
Males 38.5% Never married55.7% Now married1.7% Separated2.2% Widowed1.9% DivorcedFemales 41.8% Never married50.7% Now married0.0% Separated3.0% Widowed4.5% DivorcedWomen who gave birth in the past 12 months Now married:
0.0% (0)Unmarried:
100.0% (27)
Women who did not give birth in the past 12 months Now married:
46.0% (177)Unmarried:
54.0% (208)
Marital status - Other race population 15 years and over
Males 67.1% Never married29.4% Now married0.0% Separated0.0% Widowed3.5% DivorcedFemales 42.4% Never married27.3% Now married0.0% Separated13.4% Widowed16.9% DivorcedWomen who gave birth in the past 12 months Now married:
55.8% (65)Unmarried:
44.2% (51)
Women who did not give birth in the past 12 months Now married:
9.3% (21)Unmarried:
90.7% (203)
Marital status - Two or more races population 15 years and over
Males 31.5% Never married29.5% Now married0.0% Separated3.4% Widowed35.6% DivorcedFemales 52.4% Never married32.0% Now married1.5% Separated0.0% Widowed14.2% DivorcedWomen who gave birth in the past 12 months Now married:
41.5% (59)Unmarried:
58.5% (83)
Women who did not give birth in the past 12 months Now married:
11.1% (20)Unmarried:
88.9% (157)
Marital status - White alone, not Hispanic / Latino population 15 years and over
Males 30.0% Never married41.8% Now married5.2% Separated6.3% Widowed16.7% DivorcedFemales 25.6% Never married45.7% Now married0.0% Separated11.2% Widowed17.5% DivorcedWomen who gave birth in the past 12 months Now married:
60.3% (44)Unmarried:
39.7% (29)
Women who did not give birth in the past 12 months Now married:
39.6% (460)Unmarried:
60.4% (703)
Marital status - Hispanic or Latino population 15 years and over
Males 50.5% Never married39.3% Now married7.2% Separated1.4% Widowed1.6% DivorcedFemales 47.3% Never married24.4% Now married4.8% Separated8.3% Widowed15.3% DivorcedWomen who gave birth in the past 12 months Now married:
41.6% (68)Unmarried:
58.4% (95)
Women who did not give birth in the past 12 months Now married:
22.2% (105)Unmarried:
77.8% (369)
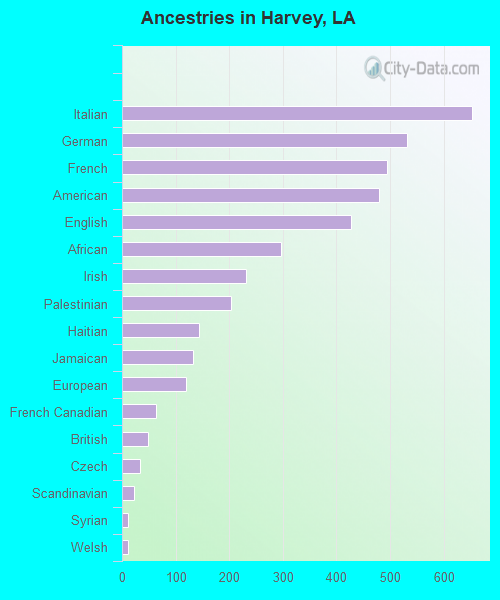
Ancestries in Harvey
652 4.6% Italian532 3.8% German495 3.5% French480 3.4% American428 3.0% English297 2.1% African231 1.6% Irish203 1.4% Palestinian143 1.0% Haitian133 0.9% Jamaican119 0.8% European63 0.4% French Canadian49 0.3% British34 0.2% Czech23 0.2% Scandinavian12 0.09% Syrian11 0.08% Welsh
Children Nativity (place of birth) in Harvey
Children under 6 years - Living with two parents Both parents native 516 100.0% NativeBoth parents foreign-born 43 49.8% Native43 50.2% Foreign-bornOne native, one foreign-born parent 23 100.0% NativeChildren under 6 years - Living with one parent Native parent 723 100.0% NativeForeign-born parent 284 100.0% NativeChildren 6 to 17 years - Living with two parents Both parents native 1,085 99.9% Native1 0.1% Foreign-bornBoth parents foreign-born 527 93.2% Native38 6.8% Foreign-bornOne native, one foreign-born parent 8 100.0% NativeChildren 6 to 17 years - Living with one parent Native parent 1,306 97.2% Native37 2.8% Foreign-bornForeign-born parent 384 71.1% Native156 28.9% Foreign-born
Grandparents responsible for own grandchildren in Harvey
Grandparents (30 to 59 years) White / Caucasian 48 100.0% Responsible for grandchildrenBlack or African American 72 66.4% Responsible for grandchildren37 33.6% Not responsible for grandchildrenWhite alone, not Hispanic / Latino 44 100.0% Responsible for grandchildrenHispanic or Latino 16 100.0% Responsible for grandchildrenGrandparents (60 years and over) White / Caucasian 145 71.0% Responsible for grandchildren59 29.0% Not responsible for grandchildrenBlack or African American 42 53.4% Responsible for grandchildren37 46.6% Not responsible for grandchildrenWhite alone, not Hispanic / Latino 100 59.8% Responsible for grandchildren67 40.2% Not responsible for grandchildrenHispanic or Latino 46 100.0% Responsible for grandchildren