Races in Harwinton, Connecticut (CT) Detailed Stats
Ancestries, Foreign-born residents, place of birth

Recent posts about races in Harwinton, Connecticut on our local forum with over 2,400,000 registered users:
 | 2024 Connecticut Town Tournament VI (Celebrating the 10-Year Anniversary & Dazzleman's Memorial) (1089 replies) |
| Connecticut TOWN TOURNAMENT V (2022) (831 replies) |
| Connecticut TOWN TOURNAMENT IV (2020) (849 replies) |
| West Hartford, CT vs Milford, CT (73 replies) |
| Economic Climate in CT (18750 replies) |
| Killingly, CT - Kind, Respectful & Inclusive or Closed Minded, Dismissive & Afraid? (39 replies) |
3.5% of Harwinton, CT residents are foreign-born (2.2% born in Europe, 0.7% born in Latin America, 0.5% born in Asia), which is 326.0% less than the foreign-born rate of 15.0% across the entire state of Connecticut.
Race distribution in Harwinton

- 5,17197.9%White alone
- 470.9%Hispanic
- 270.5%Asian alone
- 250.5%Two or more races
- 40.08%Black alone
- 30.06%Other race alone
- 30.06%American Indian alone
- 30.06%Native Hawaiian and Other
Pacific Islander alone

2000
2022
-
- 2,638,84577.5%White alone
- 320,3239.4%Hispanic
- 295,5718.7%Black alone
- 81,5642.4%Asian alone
- 52,8961.6%Two or more races
- 8,1410.2%Other race alone
- 7,2670.2%American Indian alone
- 9580.03%Native Hawaiian and Other
Pacific Islander alone

-
- 2,246,91362.0%White alone
- 658,97818.2%Hispanic
- 353,9739.8%Black alone
- 172,9294.8%Asian alone
- 159,6314.4%Two or more races
- 29,7610.8%Other race alone
- 3,4280.09%American Indian alone
- 5920.02%Native Hawaiian and Other
Pacific Islander alone

Income and house value in Harwinton
- Median household income in 2022
- $113,598White non-Hispanic householders
- $2,820American Indian and Alaska Native householders
- $165,805Hispanic or Latino race householders
- Median 2022 house value
- $344,605White Non-Hispanic householders
- $756,662Hispanic or Latino householders
Household income for White non-Hispanic householders

Household income for American Indian and Alaska Native householders

Household income for Hispanic or Latino race householders

Foreign-born residents in Harwinton
186 residents are foreign born (2.2% Europe, 0.7% Latin America, 0.5% Asia).
| This city: | 3.5% |
| Connecticut: | 10.9% |
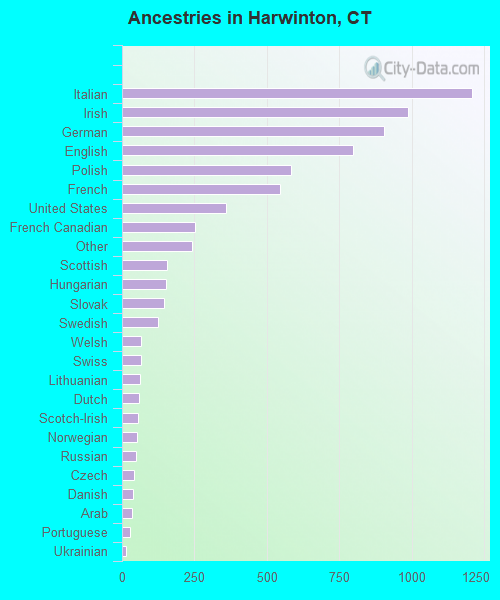
Ancestries in Harwinton

- 1,20717.2%Italian
- 98714.0%Irish
- 90512.9%German
- 79611.3%English
- 5838.3%Polish
- 5477.8%French
- 3605.1%United States
- 2513.6%French Canadian
- 2433.5%Other
- 1552.2%Scottish
- 1532.2%Hungarian
- 1452.1%Slovak
- 1261.8%Swedish
- 671.0%Welsh
- 660.9%Swiss
- 620.9%Lithuanian
- 580.8%Dutch
- 540.8%Scotch-Irish
- 530.8%Norwegian
- 470.7%Russian
- 400.6%Czech
- 380.5%Danish
- 340.5%Arab
- 280.4%Portuguese
- 140.2%Ukrainian
- 60.09%Greek
- 50.07%Subsaharan African
Zip codes: 06791.