Races in Hatboro, Pennsylvania (PA) Detailed Stats
Ancestries, Foreign-born residents, place of birth
Settings
X


Recent posts about races in Hatboro, Pennsylvania on our local forum with over 2,400,000 registered users:
 | What's it like in the Hatboro area? (7 replies) |
| Buying a house around Lansdale/ north wales/ blue bells/ ambler (8 replies) |
| Methacton vs. Central Bucks South Districts (4 replies) |
| Many properties in Havertown.why? (17 replies) |
| Phila. Suburbs for Young Professionals with 1 child (26 replies) |
| Moving to Hatboro: Advice on Utilities? (2 replies) |
Latest news about races in Hatboro, PA collected exclusively by city-data.com from local newspapers, TV, and radio stations
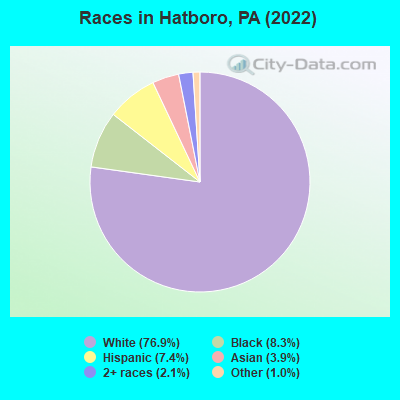
According to 2022 data, the most numerous races in Hatboro, PA are White alone (6,347 residents), Black alone (687 residents), and Hispanic (609 residents). 87.6% of Hatboro residents speak English at home. 8.8% of Hatboro, PA residents are foreign-born (3.1% born in Asia, 2.7% born in Latin America, 1.8% born in Europe), which is 20.3% greater than the foreign-born rate of 7.0% across the entire state of Pennsylvania.
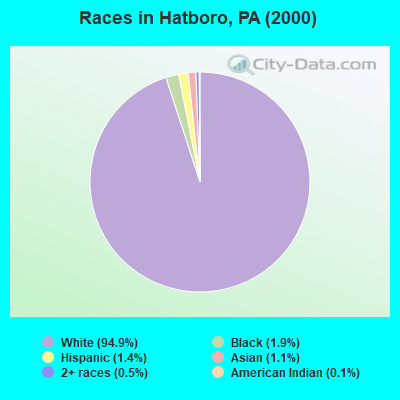
Race distribution in Hatboro
2000
2022

- 7,01694.9%White alone
- 1401.9%Black alone
- 1071.4%Hispanic
- 781.1%Asian alone
- 350.5%Two or more races
- 100.1%American Indian alone
- 70.09%Other race alone
-
- 6,34776.9%White alone
- 6878.3%Black alone
- 6097.4%Hispanic
- 3263.9%Asian alone
- 1772.1%Two or more races
- 801.0%Other race alone
- 70.08%American Indian alone
2000
2022
-
- 10,322,45584.1%White alone
- 1,202,4379.8%Black alone
- 394,0883.2%Hispanic
- 218,2961.8%Asian alone
- 113,0970.9%Two or more races
- 13,0860.1%Other race alone
- 14,9040.1%American Indian alone
- 2,6910.02%Native Hawaiian and Other
Pacific Islander alone

-
- 9,487,22873.1%White alone
- 1,311,58110.1%Black alone
- 1,115,9978.6%Hispanic
- 493,9423.8%Two or more races
- 487,1243.8%Asian alone
- 63,5820.5%Other race alone
- 10,1300.08%American Indian alone
- 2,4240.02%Native Hawaiian and Other
Pacific Islander alone

Income and house value in Hatboro
- Median household income in 2022
- $102,356White non-Hispanic householders
- $124,724Black householders
- $161,911Two or more races householders
- Median 2022 house value
- $354,209White Non-Hispanic householders
- $338,192Black or African American householders
- $590,786American Indian or Alaska Native householders
- $919,000Asian householders
- $295,393Some other race householders
- $393,857Two or more races householders
- $295,393Hispanic or Latino householders
Household income for White non-Hispanic householders

Household income for Black householders

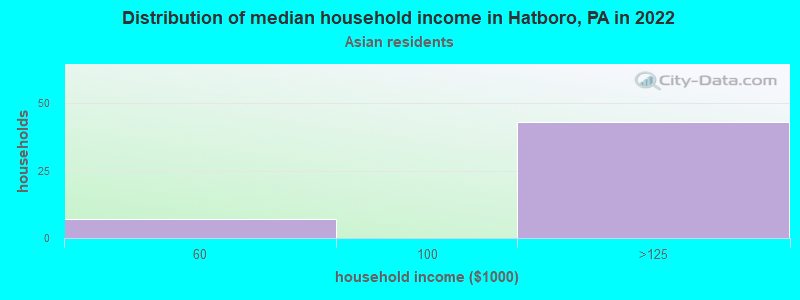
Household income for Asian householders
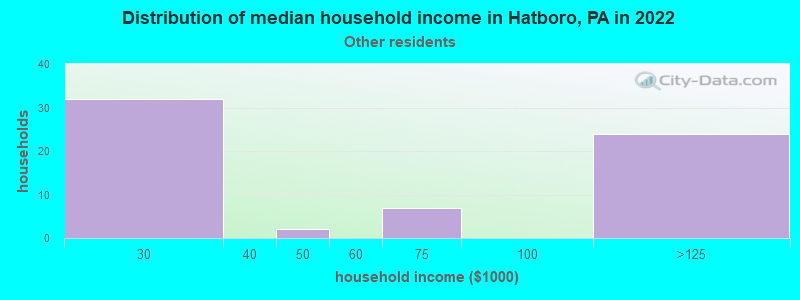
Household income for Some other race householders
Household income for Two or more races householders

Household income for Hispanic or Latino race householders

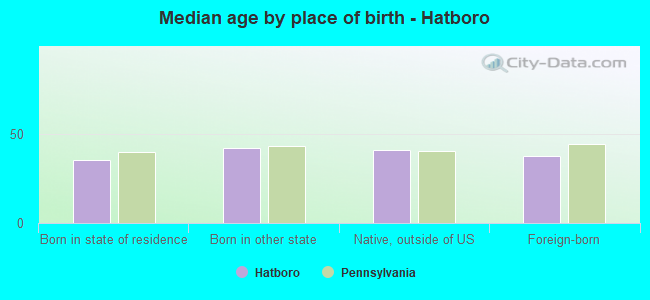
Median age by race in Hatboro
- 38.5Median age for White residents
- 39.7Males
- 37.4Females
- 25.5Median age for Black or African American residents
- 20.4Males
- 33.9Females
- -626,180,836.1Median age for American Indian / Alaska Native residents
- -1,098,934,549.9Males
- -577,519,379.3Females
- 39.6Median age for Asian residents
- -673,796,790.8Males
- 36.3Females
- -680,432,644.4Median age for Native Hawaiian / Pacific Islander residents
- -649,523,808.9Males
- -747,474,746.7Females
- 28.3Median age for Other race residents
- 21.5Males
- 35.1Females
- 21.9Median age for Two or more races residents
- 16.0Males
- 21.7Females
- 39.3Median age for White alone residents
- 39.5Males
- 38.8Females
- 14.7Median age for Hispanic or Latino residents
- 14.3Males
- 19.7Females
Owner/renter occupied households by race in Hatboro
- House owners and renters - White residents
- 1,61759.8%Owner occupied
- 1,08640.2%Renter occupied
- House owners and renters - Black or African American residents
- 6028.1%Owner occupied
- 15371.9%Renter occupied
- House owners and renters - American Indian / Alaska Native residents
- 8100.0%Renter occupied
- House owners and renters - Asian residents
- 48100.0%Renter occupied
- House owners and renters - Other race residents
- 53100.0%Renter occupied
- House owners and renters - Two or more races residents
- 6456.9%Owner occupied
- 4843.1%Renter occupied
- House owners and renters - White alone residents
- 1,60859.2%Owner occupied
- 1,10640.8%Renter occupied
- House owners and renters - Hispanic or Latino residents
- 3127.0%Owner occupied
- 8573.0%Renter occupied
Language usage in Hatboro
- English speakers - Total
- 87.6% of residents of Hatboro speak English at home.
- 5.8% of residents speak Spanish at home
- 27260.0%Speak English very well
- 18140.0%Speak English less than very well
- 6.6% of residents speak other language at home
- 31961.8%Speak English very well
- 19738.2%Speak English less than very well
- English speakers - Born in the United States
- 90.6% of residents of Hatboro speak English at home.
- 3.3% of residents speak Spanish at home
- 39100.0%Speak English very well
- 6.2% of residents speak other language at home
- 73100.0%Speak English very well
- English speakers - Native, born elsewhere
- 49.3% of residents of Hatboro speak English at home.
- 25.4% of residents speak Spanish at home
- 952.9%Speak English very well
- 847.1%Speak English less than very well
- 23.9% of residents speak other language at home
- 16100.0%Speak English very well
- English speakers - Foreign-born
- 21.6% of residents of Hatboro speak English at home.
- 30.3% of residents speak Spanish at home
- 7736.5%Speak English very well
- 13463.5%Speak English less than very well
- 48.9% of residents speak other language at home
- 20259.4%Speak English very well
- 13840.6%Speak English less than very well
White (Caucasian) - Speak only English
| Native: | 97.8% (5,772) |
| Foreign-born: | 29.2% (106) |
White (Caucasian) - Speak another language
| Native: | 2.3% (136) |
| Foreign-born: | 70.3% (256) |
Asian - Speak only English
| Native: | 22.3% (19) |
| Foreign-born: | 22.3% (44) |
Asian - Speak another language
| Native: | 81.8% (69) |
| Foreign-born: | 78.8% (157) |
Other race - Speak another language
| Native: | 77.3% (201) |
| Foreign-born: | 100.0% (88) |
White alone - Speak only English
| Native: | 97.8% (5,615) |
| Foreign-born: | 37.5% (109) |
White alone - Speak another language
| Native: | 2.2% (124) |
| Foreign-born: | 62.4% (182) |
Hispanic or Latino - Speak another language
| Native: | 42.5% (171) |
| Foreign-born: | 100.0% (209) |
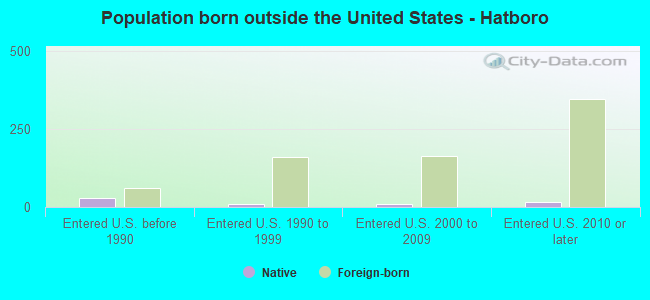
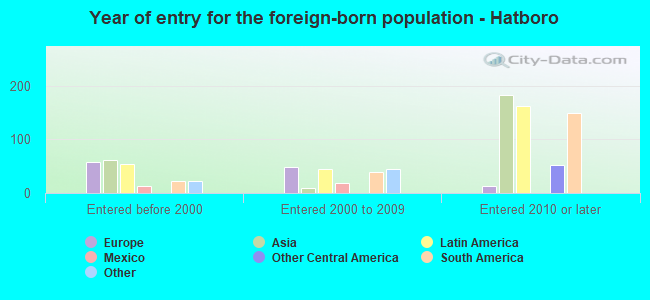
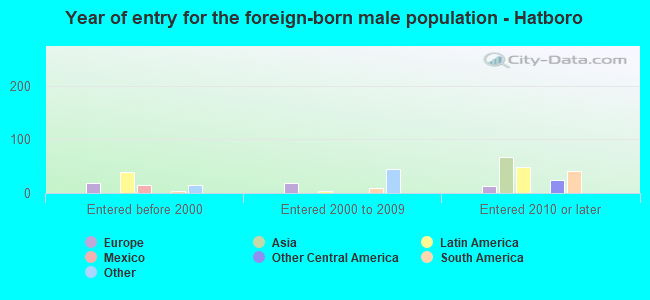
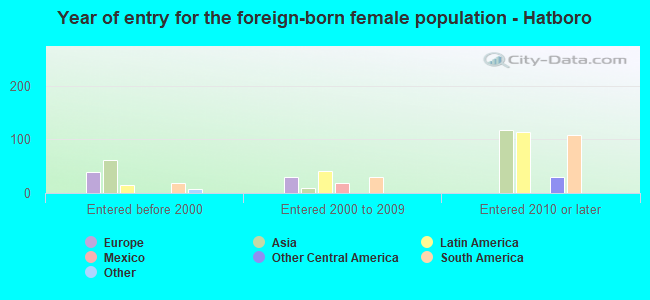
Foreign-born residents in Hatboro
725 residents are foreign born (3.1% Asia, 2.7% Latin America, 1.8% Europe).
| This city: | 8.8% |
| Pennsylvania: | 7.3% |

Marital status for residents in Hatboro
Marital status - White (Caucasian) population 15 years and over
- Males
- 33.6%Never married
- 53.4%Now married
- 2.7%Separated
- 2.5%Widowed
- 7.7%Divorced
- Females
- 30.1%Never married
- 51.3%Now married
- 0.8%Separated
- 6.5%Widowed
- 11.3%Divorced
Women who gave birth in the past 12 months
| Now married: | 100.0% (56) |
| Unmarried: | 0.0% (0) |
Women who did not give birth in the past 12 months
| Now married: | 53.0% (820) |
| Unmarried: | 47.0% (728) |
Marital status - Black or African American population 15 years and over
- Males
- 45.4%Never married
- 40.3%Now married
- 0.0%Separated
- 14.4%Widowed
- 0.0%Divorced
- Females
- 51.0%Never married
- 40.2%Now married
- 0.0%Separated
- 0.0%Widowed
- 8.8%Divorced
Women who did not give birth in the past 12 months
| Now married: | 39.3% (75) |
| Unmarried: | 60.7% (115) |
Marital status - Asian population 15 years and over
- Males
- 100.0%Never married
- 0.0%Now married
- 0.0%Separated
- 0.0%Widowed
- 0.0%Divorced
- Females
- 86.0%Never married
- 10.6%Now married
- 0.0%Separated
- 0.0%Widowed
- 3.4%Divorced
Women who gave birth in the past 12 months
| Now married: | 12.2% (6) |
| Unmarried: | 87.8% (44) |
Women who did not give birth in the past 12 months
| Now married: | 10.9% (13) |
| Unmarried: | 89.1% (109) |
Marital status - Other race population 15 years and over
- Males
- 12.2%Never married
- 86.1%Now married
- 0.0%Separated
- 1.7%Widowed
- 0.0%Divorced
- Females
- 34.8%Never married
- 47.8%Now married
- 0.0%Separated
- 0.0%Widowed
- 17.4%Divorced
Women who did not give birth in the past 12 months
| Now married: | 47.3% (33) |
| Unmarried: | 52.7% (37) |
Marital status - Two or more races population 15 years and over
- Males
- 64.2%Never married
- 35.8%Now married
- 0.0%Separated
- 0.0%Widowed
- 0.0%Divorced
- Females
- 22.2%Never married
- 29.6%Now married
- 0.0%Separated
- 0.0%Widowed
- 48.1%Divorced
Women who did not give birth in the past 12 months
| Now married: | 29.6% (22) |
| Unmarried: | 70.4% (51) |
Marital status - White alone, not Hispanic / Latino population 15 years and over
- Males
- 33.4%Never married
- 53.4%Now married
- 2.8%Separated
- 2.6%Widowed
- 7.9%Divorced
- Females
- 29.8%Never married
- 51.0%Now married
- 0.9%Separated
- 6.7%Widowed
- 11.7%Divorced
Women who gave birth in the past 12 months
| Now married: | 100.0% (44) |
| Unmarried: | 0.0% (0) |
Women who did not give birth in the past 12 months
| Now married: | 53.0% (796) |
| Unmarried: | 47.0% (705) |
Marital status - Hispanic or Latino population 15 years and over
- Males
- 52.0%Never married
- 48.0%Now married
- 0.0%Separated
- 0.0%Widowed
- 0.0%Divorced
- Females
- 35.8%Never married
- 56.8%Now married
- 0.0%Separated
- 0.0%Widowed
- 7.4%Divorced
Women who gave birth in the past 12 months
| Now married: | 100.0% (14) |
| Unmarried: | 0.0% (0) |
Women who did not give birth in the past 12 months
| Now married: | 50.0% (68) |
| Unmarried: | 50.0% (68) |
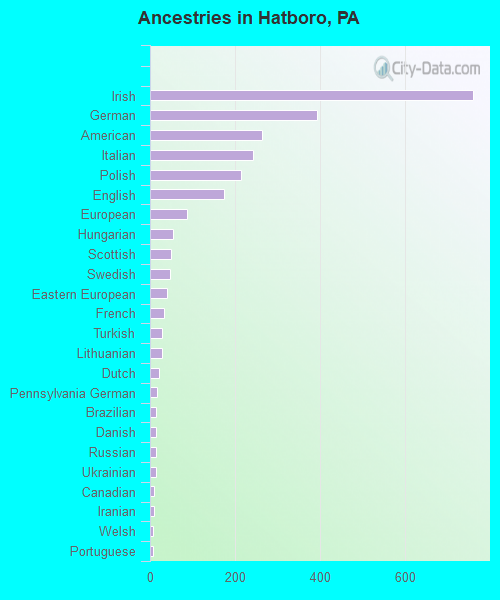
Ancestries in Hatboro

- 75920.6%Irish
- 39210.7%German
- 2637.1%American
- 2416.6%Italian
- 2145.8%Polish
- 1744.7%English
- 872.4%European
- 531.4%Hungarian
- 491.3%Scottish
- 461.3%Swedish
- 391.1%Eastern European
- 340.9%French
- 290.8%Turkish
- 280.8%Lithuanian
- 200.5%Dutch
- 160.4%Pennsylvania German
- 140.4%Brazilian
- 130.4%Danish
- 130.4%Russian
- 130.4%Ukrainian
- 90.2%Canadian
- 90.2%Iranian
- 80.2%Welsh
- 70.2%Portuguese
- 60.2%Icelander
- 60.2%Scotch-Irish
- 50.1%Czech
- 10.03%African
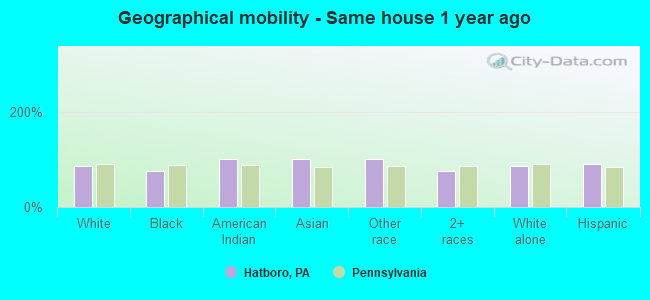
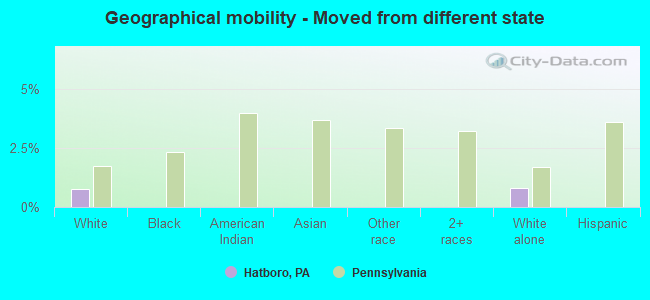
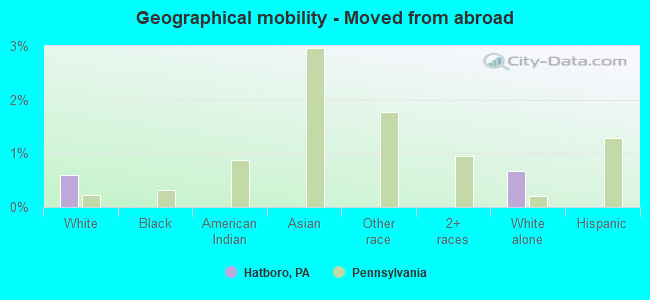
Geographical mobility in Hatboro

- Same house 1 year ago
- 5,53585.1%White (Caucasian)
- 53476.2%Black or African American
- 899.6%American Indian / Alaska Native
- 344100.0%Asian
- 355100.0%Other race
- 17376.0%Two or more races
- 5,30684.7%White alone, not Hispanic / Latino
- 54489.7%Hispanic or Latino
-
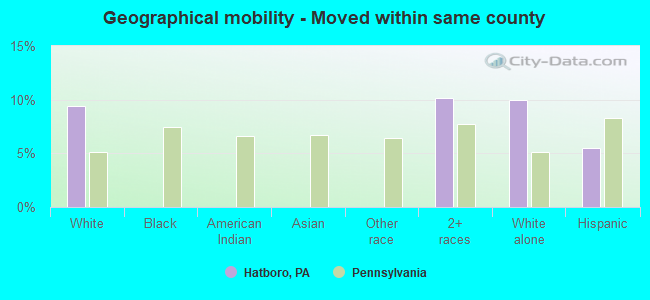
- Moved within same county
- 6149.4%White / Caucasian
- 2310.2%Two or more races
- 62510.0%White alone, not Hispanic / Latino
- 335.5%Hispanic or Latino
-
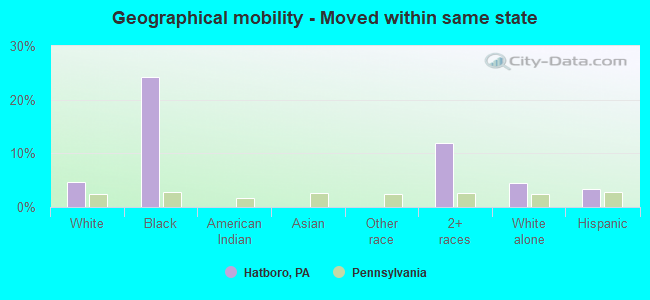
- Moved within same state
- 3044.7%White / Caucasian
- 17024.2%Black or African American
- 2712.0%Two or more races
- 2834.5%White alone, not Hispanic / Latino
- 203.4%Hispanic or Latino
-
- Moved from different state
- 500.8%White / Caucasian
- 510.8%White alone, not Hispanic / Latino
-
- Moved from abroad
- 390.6%White
- 410.7%White alone, not Hispanic / Latino
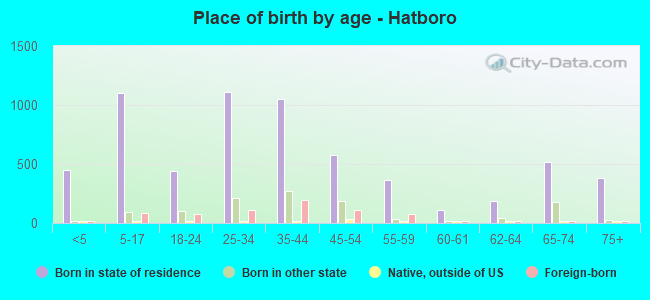
Children Nativity (place of birth) in Hatboro
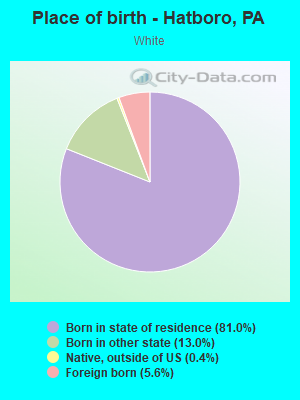
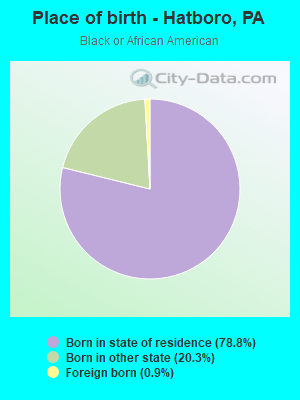
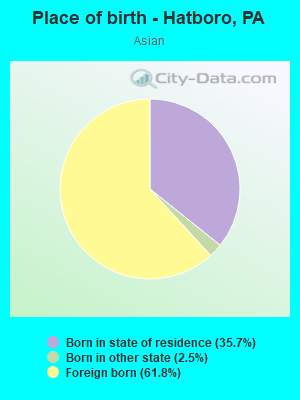
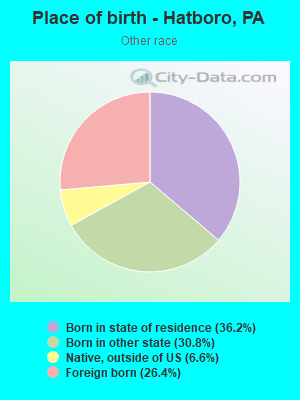
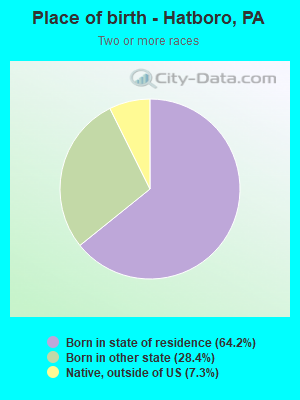
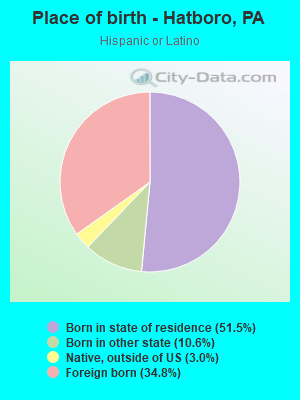
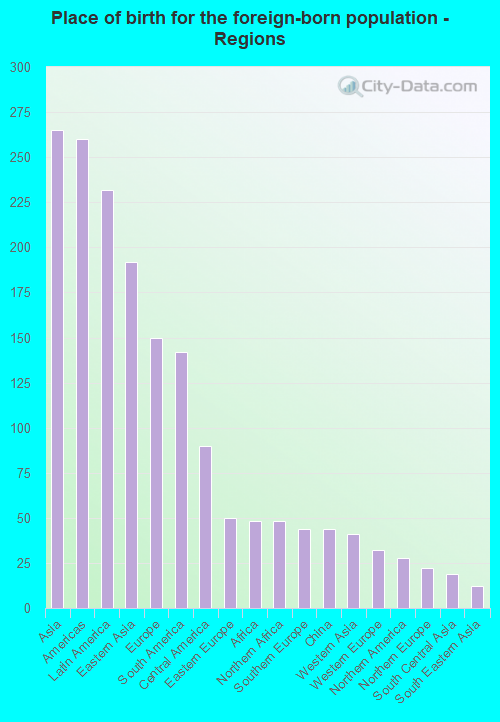
Place of birth for residents in Hatboro
![Place of birth for the foreign-born population - Regions]()
- 265Asia
- 260Americas
- 232Latin America
- 192Eastern Asia
- 150Europe
- 142South America
- 90Central America
- 50Eastern Europe
- 48Africa
- 48Northern Africa
- 44Southern Europe
- 44China
- 41Western Asia
- 32Western Europe
- 28Northern America
- 22Northern Europe
- 19South Central Asia
- 12South Eastern Asia
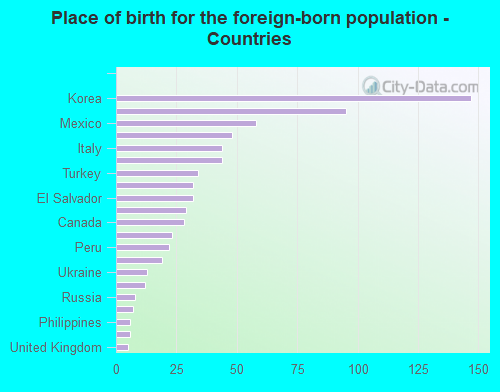
![Place of birth for the foreign-born population - Countries]()
- 147Korea
- 95Colombia
- 58Mexico
- 48Morocco
- 44Italy
- 44China
- 34Turkey
- 32Germany
- 32El Salvador
- 29Lithuania
- 28Canada
- 23Brazil
- 22Peru
- 19Iran
- 13Ukraine
- 12Sweden
- 8Russia
- 7Iraq
- 6Philippines
- 6Vietnam
- 5United Kingdom
Grandparents responsible for own grandchildren in Hatboro
Zip codes: 19040.