Races in Haysville, Kansas (KS) Detailed Stats
Data:
Races - White alone (%)
Races - White alone (% change since 2000)
Races - Black alone (%)
Races - Black alone (% change since 2000)
Races - American Indian alone (%)
Races - American Indian alone (% change since 2000)
Races - Asian alone (%)
Races - Asian alone (% change since 2000)
Races - Hispanic (%)
Races - Hispanic (% change since 2000)
Races - Native Hawaiian and Other Pacific Islander alone (%)
Races - Native Hawaiian and Other Pacific Islander alone (% change since 2000)
Races - Two or more races(%)
Races - Two or more races(% change since 2000)
Races - Other race alone (%)
Races - Other race alone (% change since 2000)
Racial diversity
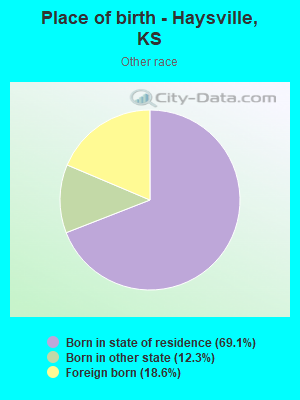
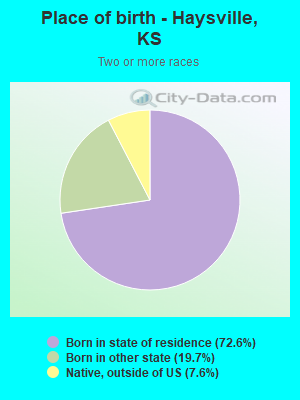
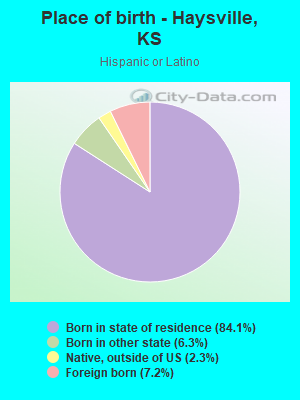
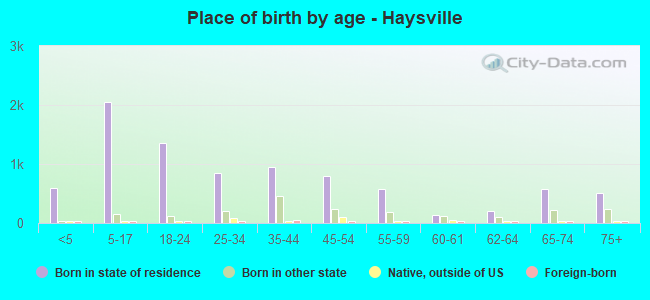
Place of birth - Born in state of residence (%)
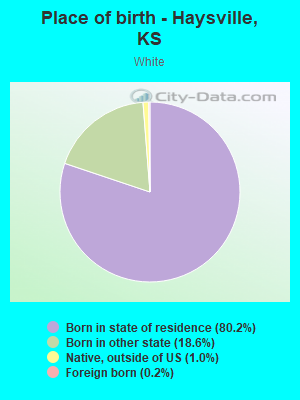
Place of birth - Born in state of residence (%) - White
Place of birth - Born in state of residence (%) - Black or African American
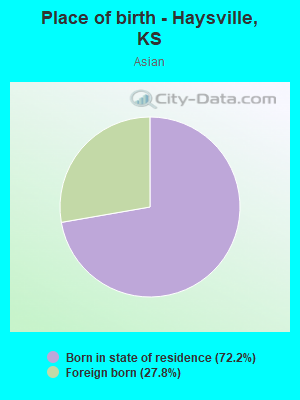
Place of birth - Born in state of residence (%) - Asian
Place of birth - Born in state of residence (%) - Hispanic or Latino
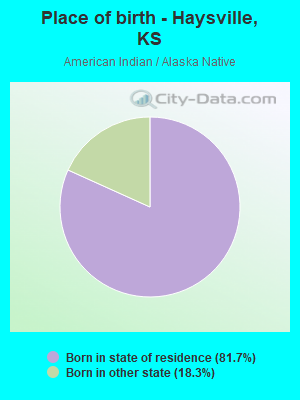
Place of birth - Born in state of residence (%) - American Indian and Alaska Native
Place of birth - Born in state of residence (%) - Multirace
Place of birth - Born in state of residence (%) - Other Race
Place of birth - Born in other state (%)
Place of birth - Born in other state (%) - White
Place of birth - Born in other state (%) - Black or African American
Place of birth - Born in other state (%) - Asian
Place of birth - Born in other state (%) - Hispanic or Latino
Place of birth - Born in other state (%) - American Indian and Alaska Native
Place of birth - Born in other state (%) - Multirace
Place of birth - Born in other state (%) - Other Race
Place of birth - Native, outside of US (%)
Place of birth - Native, outside of US (%) - White
Place of birth - Native, outside of US (%) - Black or African American
Place of birth - Native, outside of US (%) - Asian
Place of birth - Native, outside of US (%) - Hispanic or Latino
Place of birth - Native, outside of US (%) - American Indian and Alaska Native
Place of birth - Native, outside of US (%) - Multirace
Place of birth - Native, outside of US (%) - Other Race
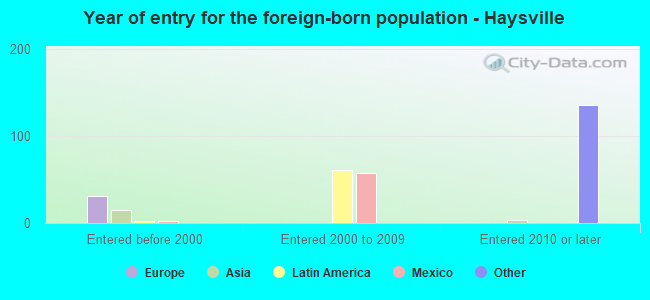
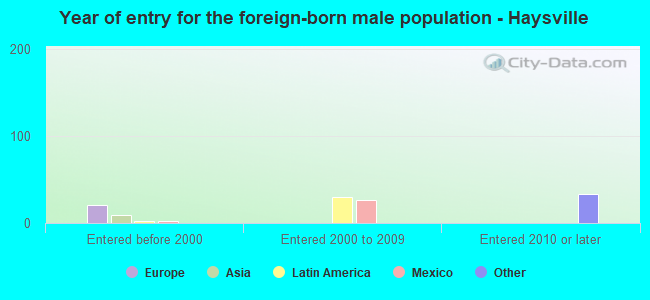
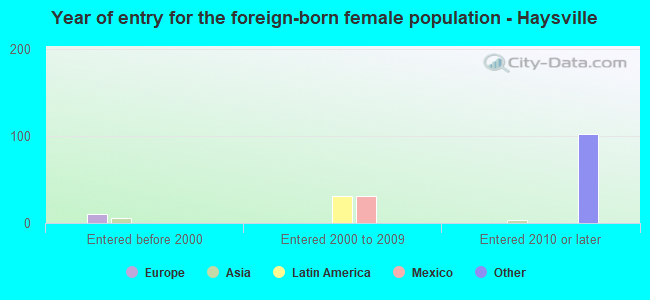
Place of birth - Foreign born (%)
Place of birth - Foreign born (%) - White
Place of birth - Foreign born (%) - Black or African American
Place of birth - Foreign born (%) - Asian
Place of birth - Foreign born (%) - Hispanic or Latino
Place of birth - Foreign born (%) - American Indian and Alaska Native
Place of birth - Foreign born (%) - Multirace
Place of birth - Foreign born (%) - Other Race
Residents speaking English at home (%)
Residents speaking English at home - Born in the United States (%)
Residents speaking English at home - Native, born elsewhere (%)
Residents speaking English at home - Foreign born (%)
Residents speaking Spanish at home (%)
Residents speaking Spanish at home - Born in the United States (%)
Residents speaking Spanish at home - Native, born elsewhere (%)
Residents speaking Spanish at home - Foreign born (%)
Residents speaking other language at home (%)
Residents speaking other language at home - Born in the United States (%)
Residents speaking other language at home - Native, born elsewhere (%)
Residents speaking other language at home - Foreign born (%)
Marital status - Never married (%)
Marital status - Now married (%)
Marital status - Separated (%)
Marital status - Widowed (%)
Marital status - Divorced (%)
Ancestries Reported - Arab (%)
Ancestries Reported - Czech (%)
Ancestries Reported - Danish (%)
Ancestries Reported - Dutch (%)
Ancestries Reported - English (%)
Ancestries Reported - French (%)
Ancestries Reported - French Canadian (%)
Ancestries Reported - German (%)
Ancestries Reported - Greek (%)
Ancestries Reported - Hungarian (%)
Ancestries Reported - Irish (%)
Ancestries Reported - Italian (%)
Ancestries Reported - Lithuanian (%)
Ancestries Reported - Norwegian (%)
Ancestries Reported - Polish (%)
Ancestries Reported - Portuguese (%)
Ancestries Reported - Russian (%)
Ancestries Reported - Scotch-Irish (%)
Ancestries Reported - Scottish (%)
Ancestries Reported - Slovak (%)
Ancestries Reported - Subsaharan African (%)
Ancestries Reported - Swedish (%)
Ancestries Reported - Swiss (%)
Ancestries Reported - Ukrainian (%)
Ancestries Reported - United States (%)
Ancestries Reported - Welsh (%)
Ancestries Reported - West Indian (%)
Ancestries Reported - Other (%)
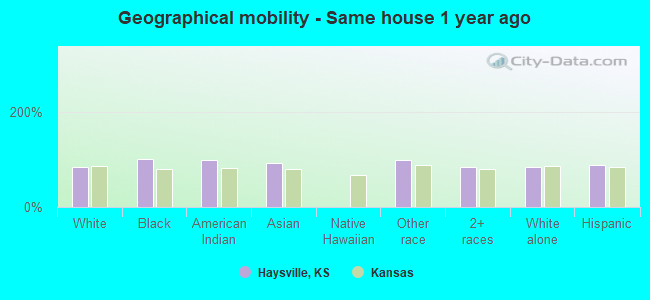
Geographical mobility - Same house 1 year ago (%)
Geographical mobility - Same house 1 year ago (%) - White
Geographical mobility - Same house 1 year ago (%) - Black or African American
Geographical mobility - Same house 1 year ago (%) - Asian
Geographical mobility - Same house 1 year ago (%) - Hispanic or Latino
Geographical mobility - Same house 1 year ago (%) - American Indian and Alaska Native
Geographical mobility - Same house 1 year ago (%) - Multirace
Geographical mobility - Same house 1 year ago (%) - Other Race
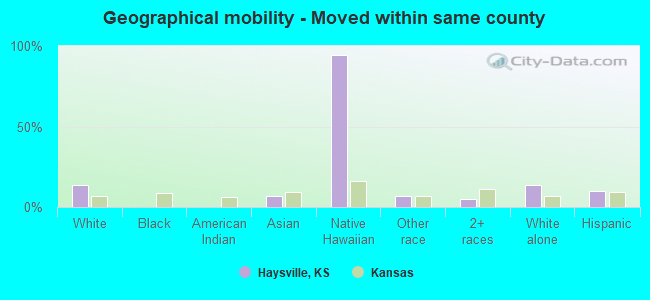
Geographical mobility - Moved within same county (%)
Geographical mobility - Moved within same county (%) - White
Geographical mobility - Moved within same county (%) - Black or African American
Geographical mobility - Moved within same county (%) - Asian
Geographical mobility - Moved within same county (%) - Hispanic or Latino
Geographical mobility - Moved within same county (%) - American Indian and Alaska Native
Geographical mobility - Moved within same county (%) - Multirace
Geographical mobility - Moved within same county (%) - Other Race
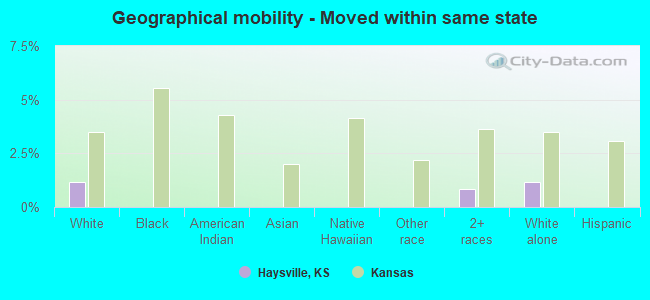
Geographical mobility - Moved from different county within same state (%)
Geographical mobility - Moved from different county within same state (%) - White
Geographical mobility - Moved from different county within same state (%) - Black or African American
Geographical mobility - Moved from different county within same state (%) - Asian
Geographical mobility - Moved from different county within same state (%) - Hispanic or Latino
Geographical mobility - Moved from different county within same state (%) - American Indian and Alaska Native
Geographical mobility - Moved from different county within same state (%) - Multirace
Geographical mobility - Moved from different county within same state (%) - Other Race
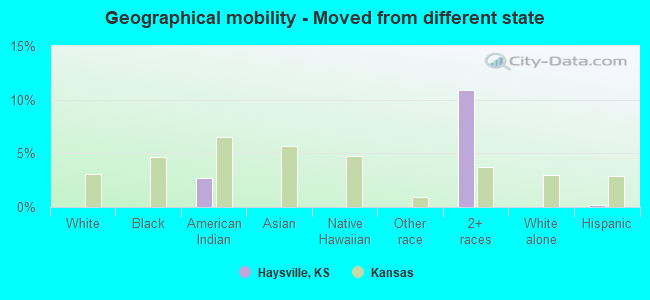
Geographical mobility - Moved from different state (%)
Geographical mobility - Moved from different state (%) - White
Geographical mobility - Moved from different state (%) - Black or African American
Geographical mobility - Moved from different state (%) - Asian
Geographical mobility - Moved from different state (%) - Hispanic or Latino
Geographical mobility - Moved from different state (%) - American Indian and Alaska Native
Geographical mobility - Moved from different state (%) - Multirace
Geographical mobility - Moved from different state (%) - Other Race
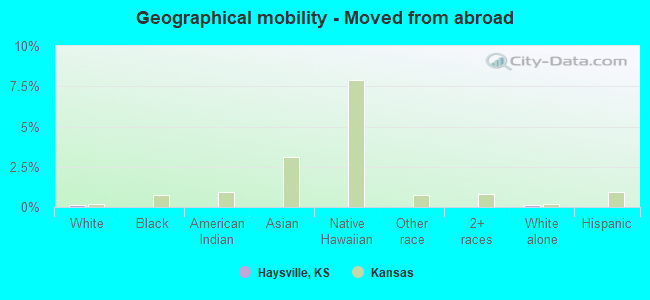
Geographical mobility - Moved from abroad (%)
Geographical mobility - Moved from abroad (%) - White
Geographical mobility - Moved from abroad (%) - Black or African American
Geographical mobility - Moved from abroad (%) - Asian
Geographical mobility - Moved from abroad (%) - Hispanic or Latino
Geographical mobility - Moved from abroad (%) - American Indian and Alaska Native
Geographical mobility - Moved from abroad (%) - Multirace
Geographical mobility - Moved from abroad (%) - Other Race
Place of birth for the foreign-born population - Ireland (%)
Place of birth for the foreign-born population - Denmark (%)
Place of birth for the foreign-born population - Norway (%)
Place of birth for the foreign-born population - Sweden (%)
Place of birth for the foreign-born population - United Kingdom (%)
Place of birth for the foreign-born population - England (%)
Place of birth for the foreign-born population - Scotland (%)
Place of birth for the foreign-born population - Other Northern Europe (%)
Place of birth for the foreign-born population - Austria (%)
Place of birth for the foreign-born population - Belgium (%)
Place of birth for the foreign-born population - France (%)
Place of birth for the foreign-born population - Germany (%)
Place of birth for the foreign-born population - Netherlands (%)
Place of birth for the foreign-born population - Switzerland (%)
Place of birth for the foreign-born population - Other Western Europe (%)
Place of birth for the foreign-born population - Greece (%)
Place of birth for the foreign-born population - Italy (%)
Place of birth for the foreign-born population - Portugal (%)
Place of birth for the foreign-born population - Spain (%)
Place of birth for the foreign-born population - Other Southern Europe (%)
Place of birth for the foreign-born population - Albania (%)
Place of birth for the foreign-born population - Belarus (%)
Place of birth for the foreign-born population - Bosnia and Herzegovina (%)
Place of birth for the foreign-born population - Bulgaria (%)
Place of birth for the foreign-born population - Croatia (%)
Place of birth for the foreign-born population - Czechoslovakia (%)
Place of birth for the foreign-born population - Hungary (%)
Place of birth for the foreign-born population - Latvia (%)
Place of birth for the foreign-born population - Lithuania (%)
Place of birth for the foreign-born population - North Macedonia (Macedonia) (%)
Place of birth for the foreign-born population - Moldova (%)
Place of birth for the foreign-born population - Poland (%)
Place of birth for the foreign-born population - Romania (%)
Place of birth for the foreign-born population - Russia (%)
Place of birth for the foreign-born population - Serbia (%)
Place of birth for the foreign-born population - Ukraine (%)
Place of birth for the foreign-born population - Other Eastern Europe (%)
Place of birth for the foreign-born population - China (%)
Place of birth for the foreign-born population - Hong Kong (%)
Place of birth for the foreign-born population - Taiwan (%)
Place of birth for the foreign-born population - Japan (%)
Place of birth for the foreign-born population - Korea (%)
Place of birth for the foreign-born population - Other Eastern Asia (%)
Place of birth for the foreign-born population - Afghanistan (%)
Place of birth for the foreign-born population - Bangladesh (%)
Place of birth for the foreign-born population - India (%)
Place of birth for the foreign-born population - Iran (%)
Place of birth for the foreign-born population - Kazakhstan (%)
Place of birth for the foreign-born population - Nepal (%)
Place of birth for the foreign-born population - Pakistan (%)
Place of birth for the foreign-born population - Sri Lanka (%)
Place of birth for the foreign-born population - Uzbekistan (%)
Place of birth for the foreign-born population - Other South Central Asia (%)
Place of birth for the foreign-born population - Burma (%)
Place of birth for the foreign-born population - Cambodia (%)
Place of birth for the foreign-born population - Indonesia (%)
Place of birth for the foreign-born population - Laos (%)
Place of birth for the foreign-born population - Malaysia (%)
Place of birth for the foreign-born population - Philippines (%)
Place of birth for the foreign-born population - Singapore (%)
Place of birth for the foreign-born population - Thailand (%)
Place of birth for the foreign-born population - Vietnam (%)
Place of birth for the foreign-born population - Other South Eastern Asia (%)
Place of birth for the foreign-born population - Armenia (%)
Place of birth for the foreign-born population - Iraq (%)
Place of birth for the foreign-born population - Israel (%)
Place of birth for the foreign-born population - Jordan (%)
Place of birth for the foreign-born population - Kuwait (%)
Place of birth for the foreign-born population - Lebanon (%)
Place of birth for the foreign-born population - Saudi Arabia (%)
Place of birth for the foreign-born population - Syria (%)
Place of birth for the foreign-born population - Turkey (%)
Place of birth for the foreign-born population - Yemen (%)
Place of birth for the foreign-born population - Other Western Asia (%)
Place of birth for the foreign-born population - Eritrea (%)
Place of birth for the foreign-born population - Ethiopia (%)
Place of birth for the foreign-born population - Kenya (%)
Place of birth for the foreign-born population - Somalia (%)
Place of birth for the foreign-born population - Uganda (%)
Place of birth for the foreign-born population - Zimbabwe (%)
Place of birth for the foreign-born population - Other Eastern Africa (%)
Place of birth for the foreign-born population - Cameroon (%)
Place of birth for the foreign-born population - Congo (%)
Place of birth for the foreign-born population - Democratic Republic of Congo (Zaire) (%)
Place of birth for the foreign-born population - Other Middle Africa (%)
Place of birth for the foreign-born population - Egypt (%)
Place of birth for the foreign-born population - Morocco (%)
Place of birth for the foreign-born population - Sudan (%)
Place of birth for the foreign-born population - Other Northern Africa (%)
Place of birth for the foreign-born population - South Africa (%)
Place of birth for the foreign-born population - Other Southern Africa (%)
Place of birth for the foreign-born population - Cabo Verde (%)
Place of birth for the foreign-born population - Ghana (%)
Place of birth for the foreign-born population - Liberia (%)
Place of birth for the foreign-born population - Nigeria (%)
Place of birth for the foreign-born population - Senegal (%)
Place of birth for the foreign-born population - Sierra Leone (%)
Place of birth for the foreign-born population - Other Western Africa (%)
Place of birth for the foreign-born population - Australia (%)
Place of birth for the foreign-born population - New Zealand (%)
Place of birth for the foreign-born population - Fiji (%)
Place of birth for the foreign-born population - Micronesia (%)
Place of birth for the foreign-born population - Bahamas (%)
Place of birth for the foreign-born population - Barbados (%)
Place of birth for the foreign-born population - Cuba (%)
Place of birth for the foreign-born population - Dominica (%)
Place of birth for the foreign-born population - Dominican Republic (%)
Place of birth for the foreign-born population - Grenada (%)
Place of birth for the foreign-born population - Haiti (%)
Place of birth for the foreign-born population - Jamaica (%)
Place of birth for the foreign-born population - St. Vincent and the Grenadines (%)
Place of birth for the foreign-born population - Trinidad and Tobago (%)
Place of birth for the foreign-born population - West Indies (%)
Place of birth for the foreign-born population - Other Caribbean (%)
Place of birth for the foreign-born population - Belize (%)
Place of birth for the foreign-born population - Costa Rica (%)
Place of birth for the foreign-born population - El Salvador (%)
Place of birth for the foreign-born population - Guatemala (%)
Place of birth for the foreign-born population - Honduras (%)
Place of birth for the foreign-born population - Mexico (%)
Place of birth for the foreign-born population - Nicaragua (%)
Place of birth for the foreign-born population - Panama (%)
Place of birth for the foreign-born population - Other Central America (%)
Place of birth for the foreign-born population - Argentina (%)
Place of birth for the foreign-born population - Bolivia (%)
Place of birth for the foreign-born population - Brazil (%)
Place of birth for the foreign-born population - Chile (%)
Place of birth for the foreign-born population - Colombia (%)
Place of birth for the foreign-born population - Ecuador (%)
Place of birth for the foreign-born population - Guyana (%)
Place of birth for the foreign-born population - Peru (%)
Place of birth for the foreign-born population - Uruguay (%)
Place of birth for the foreign-born population - Venezuela (%)
Place of birth for the foreign-born population - Other South America (%)
Place of birth for the foreign-born population - Canada (%)
Place of birth for the foreign-born population - Other Northern America (%)
Place of birth for the foreign-born population - Other (%)
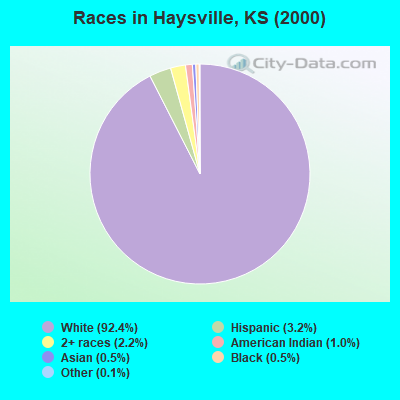
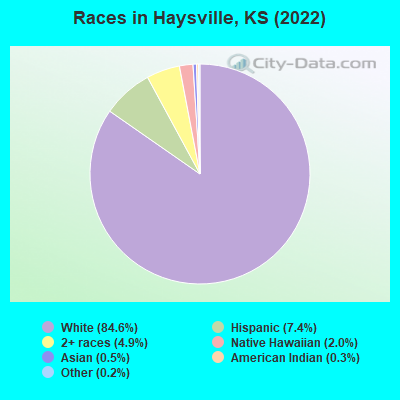
According to 2022 data, the most numerous races in Haysville, KS are White alone (9,262 residents), Hispanic (812 residents), and Black alone (5 residents). 97.2% of Haysville residents speak English at home. 2.0% of Haysville, KS residents are foreign-born , which is 253.2% less than the foreign-born rate of 7.0% across the entire state of Kansas.
Race distribution in Haysville
2000 2022
2,233,997 83.1% White alone 188,252 7.0% Hispanic 151,407 5.6% Black alone 46,301 1.7% Asian alone 42,508 1.6% Two or more races 22,322 0.8% American Indian alone 2,477 0.09% Other race alone 1,154 0.04% Native Hawaiian and Other
2,147,943 73.1% White alone 381,746 13.0% Hispanic 147,666 5.0% Black alone 145,362 4.9% Two or more races 85,085 2.9% Asian alone 13,263 0.5% Other race alone 12,065 0.4% American Indian alone 4,020 0.1% Native Hawaiian and Other
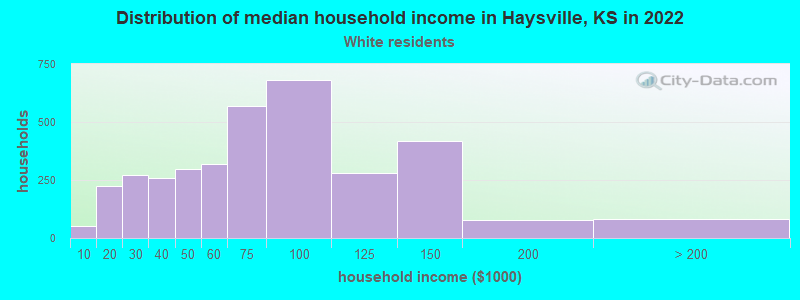
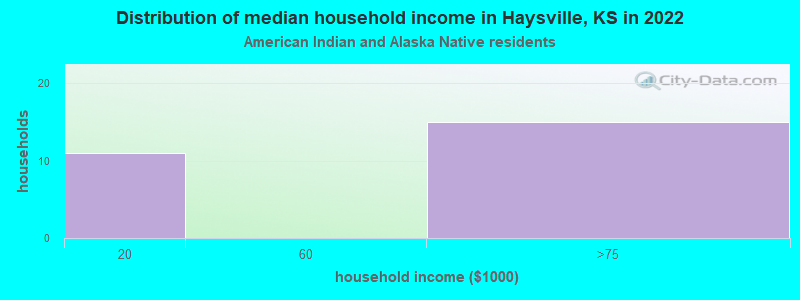
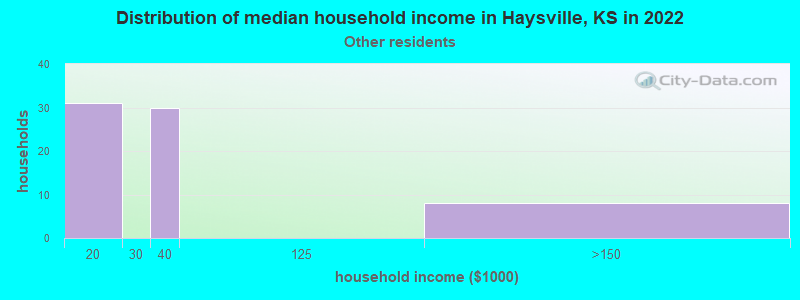
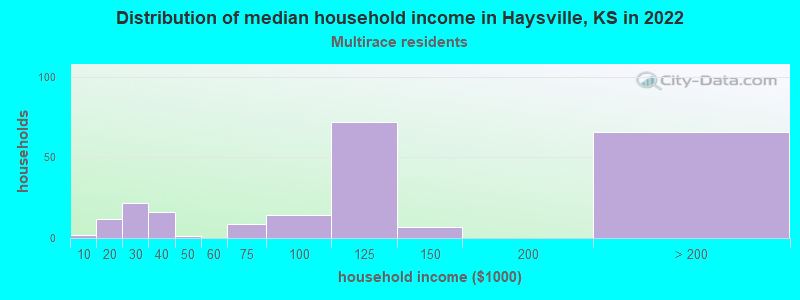
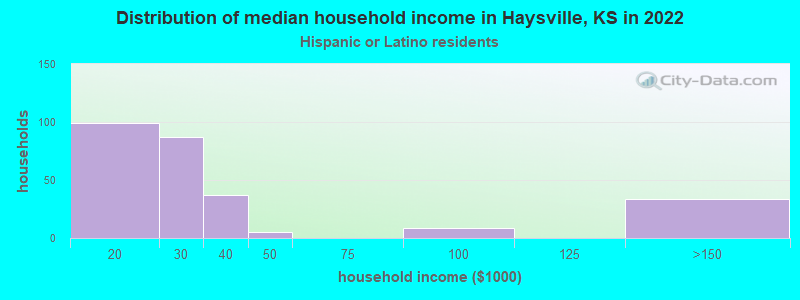
Income and house value in Haysville Median household income in 2022 $66,042 White non-Hispanic householders$87,408 American Indian and Alaska Native householders$116,495 Two or more races householders$25,063 Hispanic or Latino race householdersMedian 2022 house value $168,741 White Non-Hispanic householders$203,446 Black or African American householders$203,446 American Indian or Alaska Native householders $489,468 Asian householders$126,615 Some other race householders$184,298 Two or more races householders$185,495 Hispanic or Latino householders
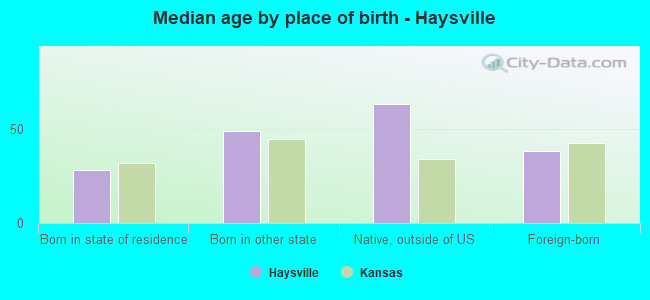
Median age by race in Haysville
38.2 Median age for White residents36.2 39.5 -692,537,312.7 Median age for Black or African American residents-716,867,469.2 -676,441,837.1 25.9 Median age for American Indian / Alaska Native residents22.1 47.1 30.5 Median age for Asian residents-760,162,600.9 33.7 41.1 Median age for Native Hawaiian / Pacific Islander residents-1,324,483,774.5 30.5 25.0 Median age for Other race residents17.5 37.7 28.4 Median age for Two or more races residents29.1 24.7 38.7 Median age for White alone residents37.8 39.1 23.9 Median age for Hispanic or Latino residents23.9 25.8
Owner/renter occupied households by race in Haysville
House owners and renters - White residents 2,899 78.7% Owner occupied785 21.3% Renter occupiedHouse owners and renters - American Indian / Alaska Native residents 4 82.1% Owner occupied1 17.9% Renter occupiedHouse owners and renters - Asian residents 10 100.0% Owner occupiedHouse owners and renters - Native Hawaiian / Pacific Islander residents 52 100.0% Renter occupiedHouse owners and renters - Other race residents 107 100.0% Owner occupiedHouse owners and renters - Two or more races residents 160 80.1% Owner occupied40 19.9% Renter occupiedHouse owners and renters - White alone residents 2,804 77.9% Owner occupied797 22.1% Renter occupiedHouse owners and renters - Hispanic or Latino residents 267 94.5% Owner occupied16 5.5% Renter occupied
Language usage in Haysville
English speakers - Total 97.2% of residents of Haysville speak English at home.
2.3% of residents speak Spanish at home 155 66.2% Speak English very well79 33.8% Speak English less than very well1.6% of residents speak other language at home 68 40.5% Speak English very well100 59.5% Speak English less than very well
English speakers - Born in the United States 93.3% of residents of Haysville speak English at home.
4.3% of residents speak Spanish at home 56 64.4% Speak English very well31 35.6% Speak English less than very well2.7% of residents speak other language at home 54 100.0% Speak English very well
All residents speak only English at home
English speakers - Foreign-born 21.1% of residents of Haysville speak English at home.
23.9% of residents speak Spanish at home 26 51.0% Speak English very well25 49.0% Speak English less than very well46.5% of residents speak other language at home 11 11.1% Speak English very well88 88.9% Speak English less than very well
White (Caucasian) - Speak only English Native:
100.0% (8,840)Foreign-born:
100.0% (21)
White (Caucasian) - Speak another language Native:
0.5% (47)Foreign-born:
26.2% (5)
Asian - Speak only English Native:
100.0% (43)Foreign-born:
85.4% (15)
Native Hawaiian / Pacific Islander - Speak another language Native:
57.0% (52)Foreign-born:
85.0% (173)
Other race - Speak only English Native:
41.2% (112)Foreign-born:
2.6% (2)
Other race - Speak another language Native:
57.6% (157)Foreign-born:
98.9% (63)
White alone - Speak only English Native:
99.6% (8,695)Foreign-born:
62.0% (21)
White alone - Speak another language Native:
0.6% (57)Foreign-born:
32.6% (11)
Hispanic or Latino - Speak only English Native:
88.7% (639)Foreign-born:
4.8% (3)
Hispanic or Latino - Speak another language Native:
18.9% (136)Foreign-born:
94.5% (56)
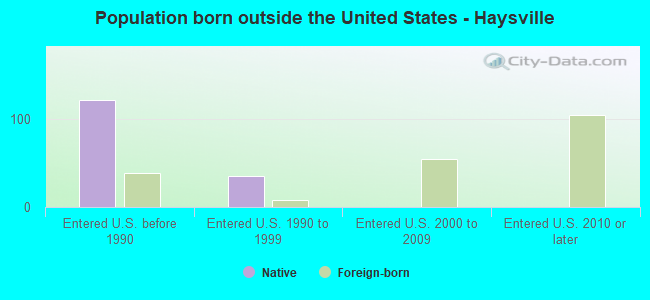
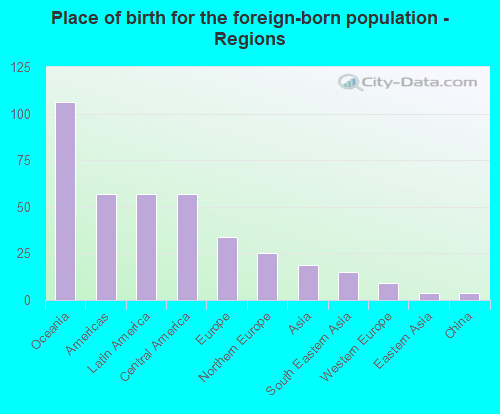
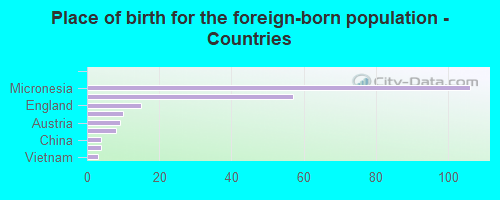
Foreign-born residents in Haysville 217 residents are foreign born
This city:
2.0%Kansas:
7.1%
Marital status for residents in Haysville Marital status - White (Caucasian) population 15 years and over
Males 30.3% Never married52.0% Now married0.1% Separated4.0% Widowed13.6% DivorcedFemales 25.6% Never married49.2% Now married0.5% Separated8.0% Widowed16.8% DivorcedWomen who gave birth in the past 12 months Now married:
71.8% (54)Unmarried:
28.2% (21)
Women who did not give birth in the past 12 months Now married:
40.9% (751)Unmarried:
59.1% (1,084)
Marital status - American Indian / Alaska Native population 15 years and over
Males 61.5% Never married30.8% Now married0.0% Separated0.0% Widowed7.7% DivorcedFemales 42.9% Never married42.9% Now married0.0% Separated0.0% Widowed14.3% DivorcedWomen who did not give birth in the past 12 months Now married:
0.0% (0)Unmarried:
100.0% (3)
Marital status - Asian population 15 years and over
Males 0.0% Never married100.0% Now married0.0% Separated0.0% Widowed0.0% DivorcedFemales 16.7% Never married83.3% Now married0.0% Separated0.0% Widowed0.0% DivorcedWomen who did not give birth in the past 12 months Now married:
100.0% (20)Unmarried:
0.0% (0)
Marital status - Native Hawaiian / Pacific Islander population 15 years and over
Males 39.0% Never married61.0% Now married0.0% Separated0.0% Widowed0.0% DivorcedFemales 0.0% Never married52.7% Now married0.0% Separated47.3% Widowed0.0% DivorcedWomen who gave birth in the past 12 months Now married:
100.0% (41)Unmarried:
0.0% (0)
Marital status - Other race population 15 years and over
Males 60.5% Never married39.5% Now married0.0% Separated0.0% Widowed0.0% DivorcedFemales 0.0% Never married50.0% Now married0.0% Separated50.0% Widowed0.0% DivorcedWomen who did not give birth in the past 12 months Now married:
50.0% (62)Unmarried:
50.0% (62)
Marital status - Two or more races population 15 years and over
Males 58.0% Never married34.0% Now married8.0% Separated0.0% Widowed0.0% DivorcedFemales 41.3% Never married53.6% Now married0.0% Separated0.9% Widowed4.3% DivorcedWomen who did not give birth in the past 12 months Now married:
39.0% (84)Unmarried:
61.0% (131)
Marital status - White alone, not Hispanic / Latino population 15 years and over
Males 28.8% Never married52.8% Now married0.1% Separated4.1% Widowed14.1% DivorcedFemales 25.6% Never married48.8% Now married0.5% Separated8.1% Widowed17.0% DivorcedWomen who gave birth in the past 12 months Now married:
71.8% (55)Unmarried:
28.2% (22)
Women who did not give birth in the past 12 months Now married:
40.9% (769)Unmarried:
59.1% (1,110)
Marital status - Hispanic or Latino population 15 years and over
Males 61.8% Never married38.2% Now married0.0% Separated0.0% Widowed0.0% DivorcedFemales 15.0% Never married58.4% Now married0.0% Separated26.6% Widowed0.0% DivorcedWomen who did not give birth in the past 12 months Now married:
52.2% (103)Unmarried:
47.8% (94)
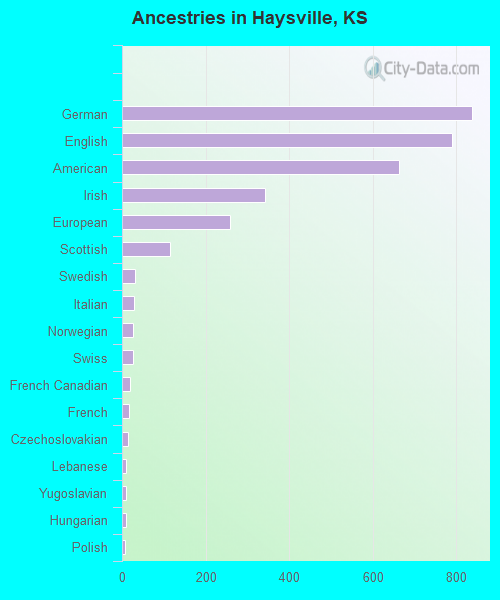
Ancestries in Haysville
837 21.1% German790 19.9% English664 16.8% American343 8.7% Irish258 6.5% European115 2.9% Scottish30 0.8% Swedish29 0.7% Italian27 0.7% Norwegian26 0.7% Swiss20 0.5% French Canadian17 0.4% French15 0.4% Czechoslovakian10 0.3% Lebanese10 0.3% Yugoslavian9 0.2% Hungarian8 0.2% Polish7 0.2% Austrian4 0.1% Scandinavian
Children Nativity (place of birth) in Haysville
Children under 6 years - Living with two parents Both parents native 401 100.0% NativeOne native, one foreign-born parent 21 100.0% NativeChildren under 6 years - Living with one parent Native parent 199 100.0% NativeChildren 6 to 17 years - Living with two parents Both parents native 1,475 100.0% NativeBoth parents foreign-born 102 100.0% NativeOne native, one foreign-born parent 8 100.0% NativeChildren 6 to 17 years - Living with one parent Native parent 457 96.0% Native19 4.0% Foreign-bornForeign-born parent 24 100.0% Native
Grandparents responsible for own grandchildren in Haysville
Grandparents (30 to 59 years) White / Caucasian 46 38.0% Responsible for grandchildren74 62.0% Not responsible for grandchildrenNative Hawaiian / Pacific Islander 32 100.0% Not responsible for grandchildrenWhite alone, not Hispanic / Latino 49 37.6% Responsible for grandchildren82 62.4% Not responsible for grandchildrenGrandparents (60 years and over) White / Caucasian 7 5.1% Responsible for grandchildren132 94.9% Not responsible for grandchildrenWhite alone, not Hispanic / Latino 8 5.0% Responsible for grandchildren143 95.0% Not responsible for grandchildren