Races in Hazel Dell North, Washington (WA) Detailed Stats
Ancestries, Foreign-born residents, place of birth

Discuss Hazel Dell North, Washington races on our local forum with over 2,400,000 registered users
12.5% of Hazel Dell North, WA residents are foreign-born (6.8% born in Latin America, 3.5% born in Europe, 1.9% born in Asia), which is 20.0% less than the foreign-born rate of 15.0% across the entire state of Washington.
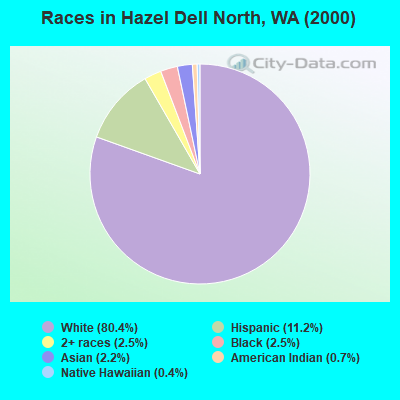
Race distribution in Hazel Dell North

- 7,44280.4%White alone
- 1,03711.2%Hispanic
- 2362.5%Two or more races
- 2302.5%Black alone
- 2062.2%Asian alone
- 650.7%American Indian alone
- 380.4%Native Hawaiian and Other
Pacific Islander alone - 70.08%Other race alone
2000
2022
-
- 4,652,49078.9%White alone
- 441,5097.5%Hispanic
- 319,4015.4%Asian alone
- 184,6313.1%Black alone
- 175,9263.0%Two or more races
- 85,3961.4%American Indian alone
- 22,7790.4%Native Hawaiian and Other
Pacific Islander alone - 11,9890.2%Other race alone

-
- 4,941,45663.5%White alone
- 1,093,31314.0%Hispanic
- 755,8329.7%Asian alone
- 523,4486.7%Two or more races
- 299,5373.8%Black alone
- 69,0240.9%American Indian alone
- 52,2310.7%Native Hawaiian and Other
Pacific Islander alone - 50,9450.7%Other race alone

Income and house value in Hazel Dell North
- Median household income in 2022
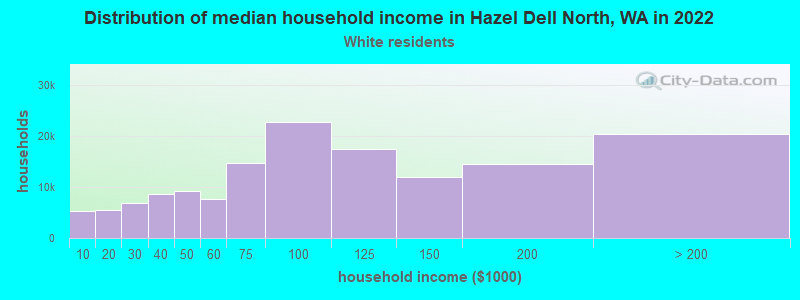
- $83,678White non-Hispanic householders
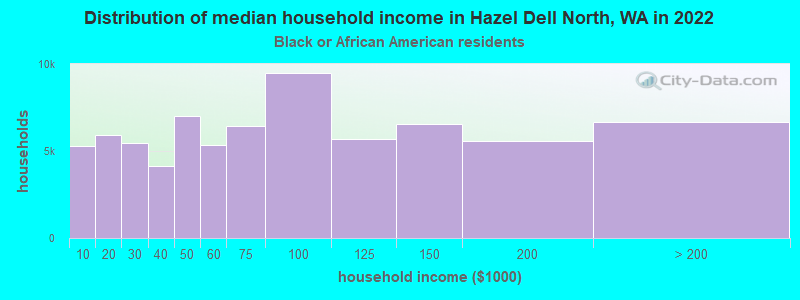
- $33,095Black householders
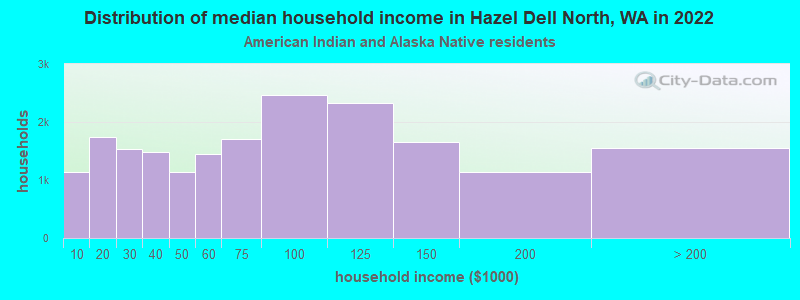
- $86,989American Indian and Alaska Native householders
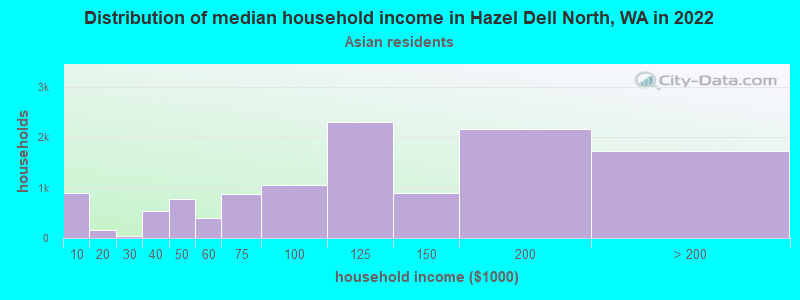
- $157,495Asian householders
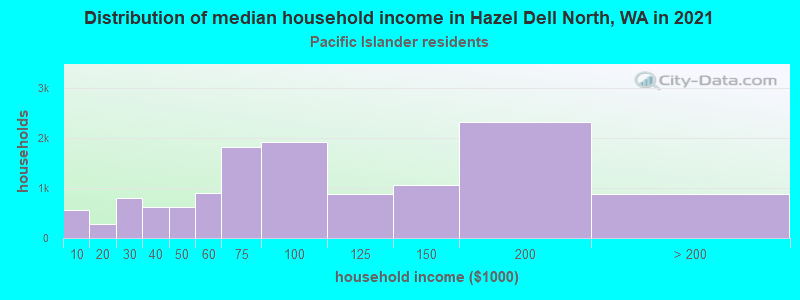
- $73,324Native Hawaiian and other Pacific Islander householders
- $80,225Some other race householders
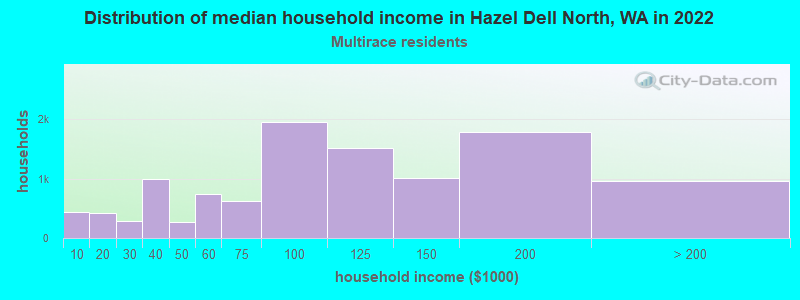
- $56,092Two or more races householders
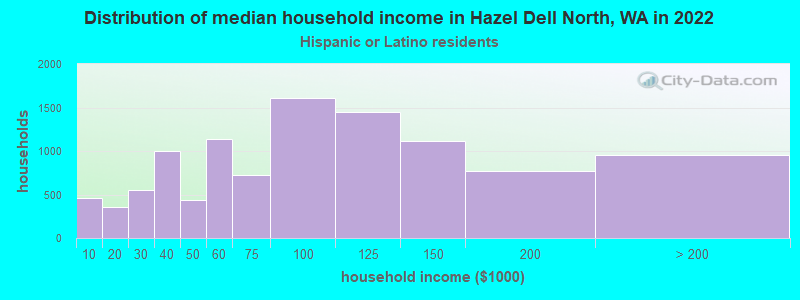
- $57,721Hispanic or Latino race householders
- Median 2022 house value
- $542,484White Non-Hispanic householders
- $527,183American Indian or Alaska Native householders
- $478,151Asian householders
- $478,151Native Hawaiian and other Pacific Islander householders
- $478,151Some other race householders
- $569,608Two or more races householders
- $457,634Hispanic or Latino householders
Household income for White non-Hispanic householders
Household income for Black householders
Household income for American Indian and Alaska Native householders
Household income for Asian householders
Household income for Native Hawaiian and other Pacific Islander householders
Household income for Two or more races householders
Household income for Hispanic or Latino race householders
Foreign-born residents in Hazel Dell North
1,158 residents are foreign born (6.8% Latin America, 3.5% Europe, 1.9% Asia).
| This city: | 12.5% |
| Washington: | 10.4% |
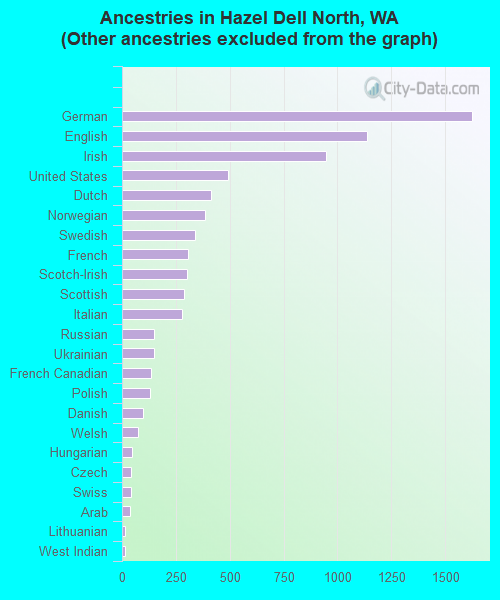
Ancestries in Hazel Dell North

- 2,59425.7%Other
- 1,62316.1%German
- 1,13911.3%English
- 9489.4%Irish
- 4914.9%United States
- 4154.1%Dutch
- 3873.8%Norwegian
- 3393.4%Swedish
- 3083.1%French
- 3013.0%Scotch-Irish
- 2882.9%Scottish
- 2792.8%Italian
- 1481.5%Russian
- 1471.5%Ukrainian
- 1361.3%French Canadian
- 1291.3%Polish
- 991.0%Danish
- 760.8%Welsh
- 460.5%Hungarian
- 410.4%Czech
- 410.4%Swiss
- 360.4%Arab
- 160.2%Lithuanian
- 150.1%West Indian
- 110.1%Portuguese
- 100.10%Slovak
- 90.09%Subsaharan African
- 60.06%Greek
Zip codes: 98665.