Races in Hazel Dell South, Washington (WA) Detailed Stats
Ancestries, Foreign-born residents, place of birth

Discuss Hazel Dell South, Washington races on our local forum with over 2,400,000 registered users
3.6% of Hazel Dell South, WA residents are foreign-born (1.4% born in Latin America, 1.2% born in Europe, 0.8% born in Asia), which is 321.6% less than the foreign-born rate of 15.0% across the entire state of Washington.
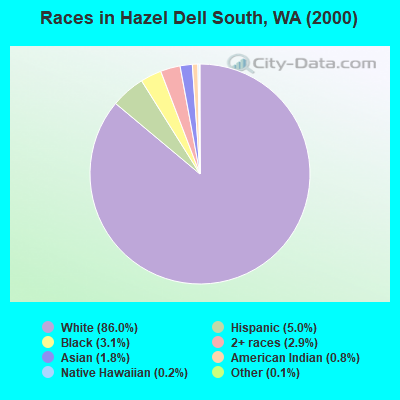
Race distribution in Hazel Dell South

- 5,68186.0%White alone
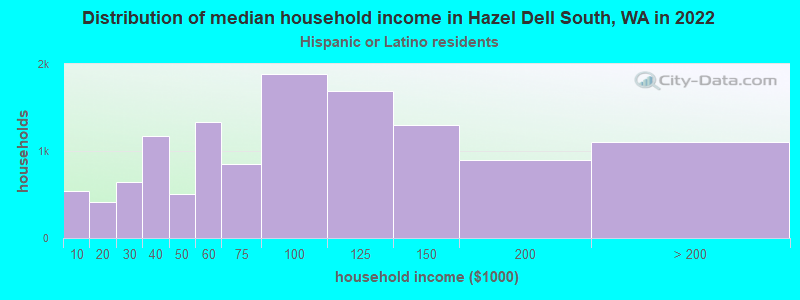
- 3325.0%Hispanic
- 2043.1%Black alone
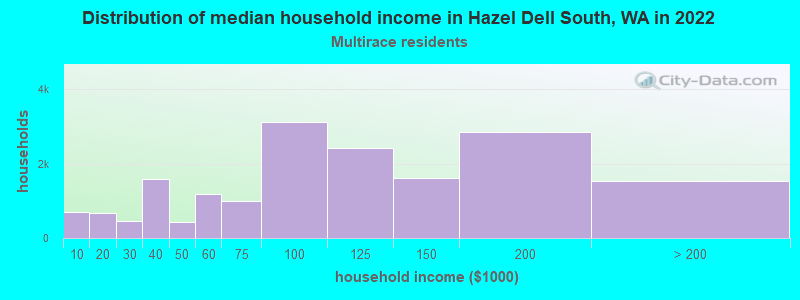
- 1922.9%Two or more races
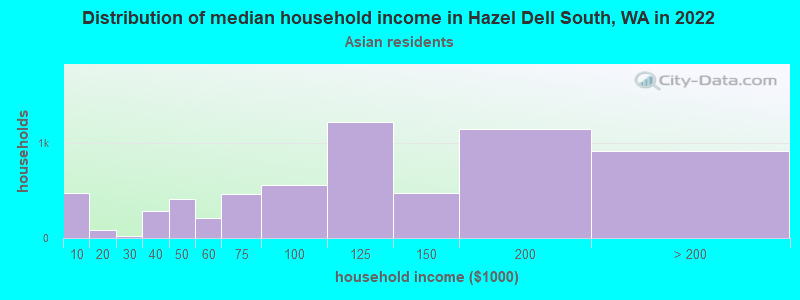
- 1211.8%Asian alone
- 530.8%American Indian alone
- 130.2%Native Hawaiian and Other
Pacific Islander alone - 90.1%Other race alone
2000
2022
-
- 4,652,49078.9%White alone
- 441,5097.5%Hispanic
- 319,4015.4%Asian alone
- 184,6313.1%Black alone
- 175,9263.0%Two or more races
- 85,3961.4%American Indian alone
- 22,7790.4%Native Hawaiian and Other
Pacific Islander alone - 11,9890.2%Other race alone

-
- 4,941,45663.5%White alone
- 1,093,31314.0%Hispanic
- 755,8329.7%Asian alone
- 523,4486.7%Two or more races
- 299,5373.8%Black alone
- 69,0240.9%American Indian alone
- 52,2310.7%Native Hawaiian and Other
Pacific Islander alone - 50,9450.7%Other race alone

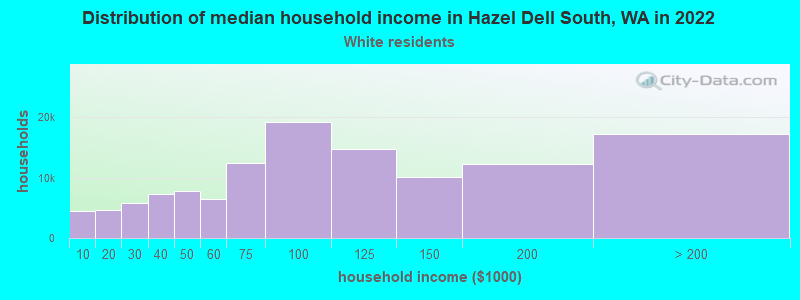
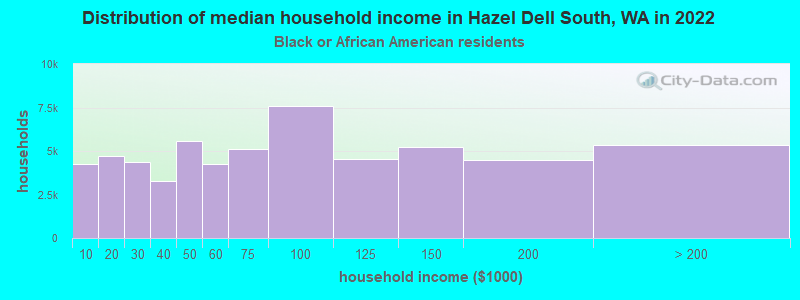
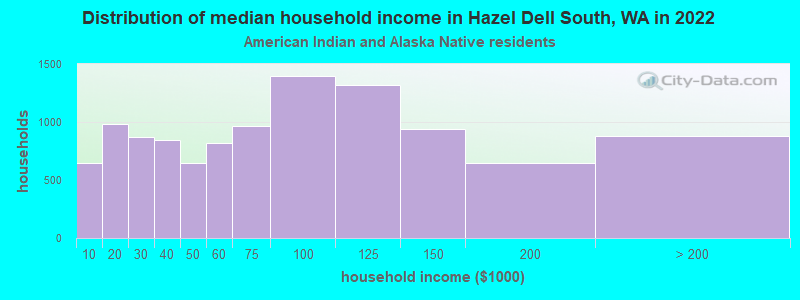
Income and house value in Hazel Dell South
- Median household income in 2022
- $69,126White non-Hispanic householders
- $26,403Black householders
- $49,337American Indian and Alaska Native householders
- $83,534Asian householders
- $61,627Some other race householders
- $89,832Two or more races householders
- $67,284Hispanic or Latino race householders
- Median 2022 house value
- $538,659White Non-Hispanic householders
- $417,295Black or African American householders
- $548,396Asian householders
- $345,312Some other race householders
- $478,151Two or more races householders
- $463,546Hispanic or Latino householders
Household income for White non-Hispanic householders
Household income for Black householders
Household income for American Indian and Alaska Native householders
Household income for Asian householders
Household income for Two or more races householders
Household income for Hispanic or Latino race householders
Foreign-born residents in Hazel Dell South
235 residents are foreign born (1.4% Latin America, 1.2% Europe, 0.8% Asia).
| This city: | 3.6% |
| Washington: | 10.4% |
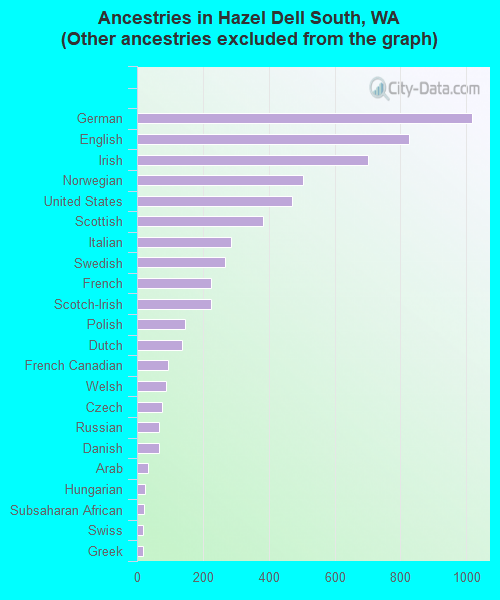
Ancestries in Hazel Dell South

- 1,58321.7%Other
- 1,01814.0%German
- 82711.4%English
- 7009.6%Irish
- 5046.9%Norwegian
- 4716.5%United States
- 3845.3%Scottish
- 2863.9%Italian
- 2663.7%Swedish
- 2243.1%French
- 2243.1%Scotch-Irish
- 1462.0%Polish
- 1381.9%Dutch
- 931.3%French Canadian
- 871.2%Welsh
- 761.0%Czech
- 670.9%Russian
- 660.9%Danish
- 320.4%Arab
- 240.3%Hungarian
- 220.3%Subsaharan African
- 180.2%Swiss
- 170.2%Greek
- 80.1%Ukrainian
- 40.05%Lithuanian
Zip codes: 98665.