Races in Hazel Dell, Washington (WA) Detailed Stats
Data:
Races - White alone (%)
Races - White alone (% change since 2000)
Races - Black alone (%)
Races - Black alone (% change since 2000)
Races - American Indian alone (%)
Races - American Indian alone (% change since 2000)
Races - Asian alone (%)
Races - Asian alone (% change since 2000)
Races - Hispanic (%)
Races - Hispanic (% change since 2000)
Races - Native Hawaiian and Other Pacific Islander alone (%)
Races - Native Hawaiian and Other Pacific Islander alone (% change since 2000)
Races - Two or more races(%)
Races - Two or more races(% change since 2000)
Races - Other race alone (%)
Races - Other race alone (% change since 2000)
Racial diversity
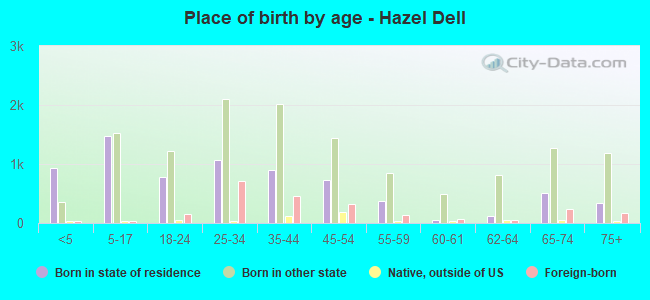
Place of birth - Born in state of residence (%)
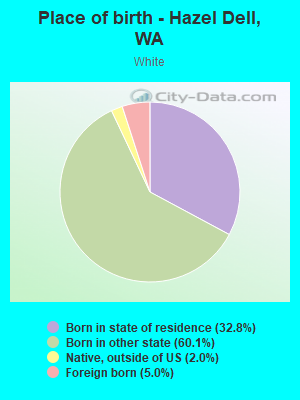
Place of birth - Born in state of residence (%) - White
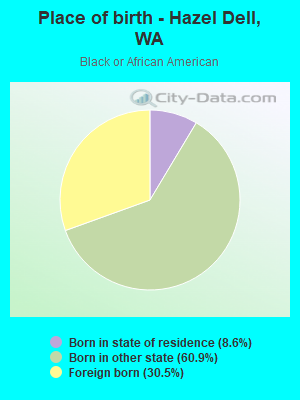
Place of birth - Born in state of residence (%) - Black or African American
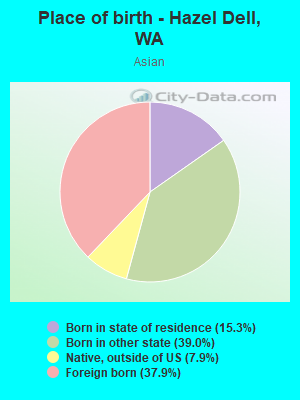
Place of birth - Born in state of residence (%) - Asian
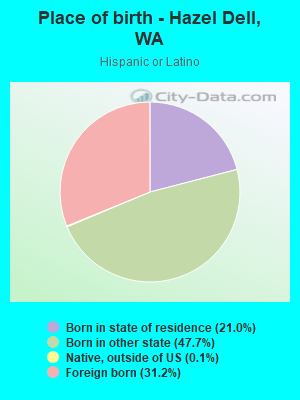
Place of birth - Born in state of residence (%) - Hispanic or Latino
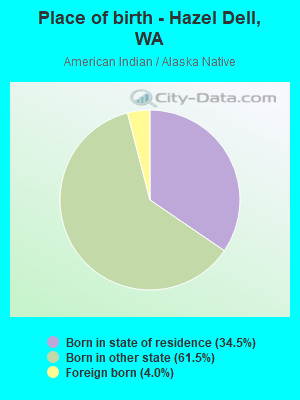
Place of birth - Born in state of residence (%) - American Indian and Alaska Native
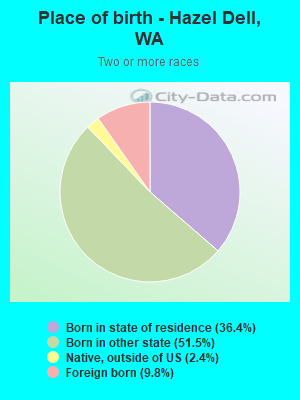
Place of birth - Born in state of residence (%) - Multirace
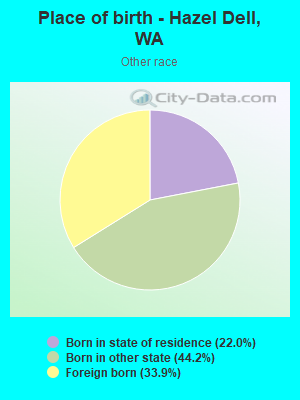
Place of birth - Born in state of residence (%) - Other Race
Place of birth - Born in other state (%)
Place of birth - Born in other state (%) - White
Place of birth - Born in other state (%) - Black or African American
Place of birth - Born in other state (%) - Asian
Place of birth - Born in other state (%) - Hispanic or Latino
Place of birth - Born in other state (%) - American Indian and Alaska Native
Place of birth - Born in other state (%) - Multirace
Place of birth - Born in other state (%) - Other Race
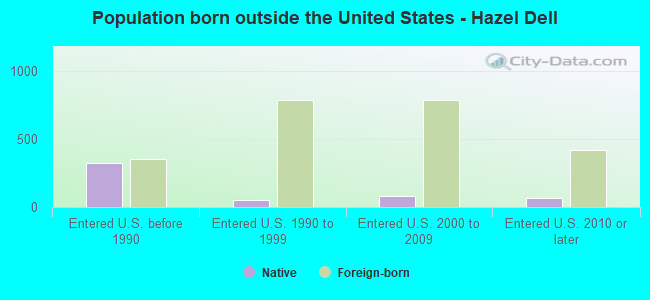
Place of birth - Native, outside of US (%)
Place of birth - Native, outside of US (%) - White
Place of birth - Native, outside of US (%) - Black or African American
Place of birth - Native, outside of US (%) - Asian
Place of birth - Native, outside of US (%) - Hispanic or Latino
Place of birth - Native, outside of US (%) - American Indian and Alaska Native
Place of birth - Native, outside of US (%) - Multirace
Place of birth - Native, outside of US (%) - Other Race
Place of birth - Foreign born (%)
Place of birth - Foreign born (%) - White
Place of birth - Foreign born (%) - Black or African American
Place of birth - Foreign born (%) - Asian
Place of birth - Foreign born (%) - Hispanic or Latino
Place of birth - Foreign born (%) - American Indian and Alaska Native
Place of birth - Foreign born (%) - Multirace
Place of birth - Foreign born (%) - Other Race
Residents speaking English at home (%)
Residents speaking English at home - Born in the United States (%)
Residents speaking English at home - Native, born elsewhere (%)
Residents speaking English at home - Foreign born (%)
Residents speaking Spanish at home (%)
Residents speaking Spanish at home - Born in the United States (%)
Residents speaking Spanish at home - Native, born elsewhere (%)
Residents speaking Spanish at home - Foreign born (%)
Residents speaking other language at home (%)
Residents speaking other language at home - Born in the United States (%)
Residents speaking other language at home - Native, born elsewhere (%)
Residents speaking other language at home - Foreign born (%)
Marital status - Never married (%)
Marital status - Now married (%)
Marital status - Separated (%)
Marital status - Widowed (%)
Marital status - Divorced (%)
Ancestries Reported - Arab (%)
Ancestries Reported - Czech (%)
Ancestries Reported - Danish (%)
Ancestries Reported - Dutch (%)
Ancestries Reported - English (%)
Ancestries Reported - French (%)
Ancestries Reported - French Canadian (%)
Ancestries Reported - German (%)
Ancestries Reported - Greek (%)
Ancestries Reported - Hungarian (%)
Ancestries Reported - Irish (%)
Ancestries Reported - Italian (%)
Ancestries Reported - Lithuanian (%)
Ancestries Reported - Norwegian (%)
Ancestries Reported - Polish (%)
Ancestries Reported - Portuguese (%)
Ancestries Reported - Russian (%)
Ancestries Reported - Scotch-Irish (%)
Ancestries Reported - Scottish (%)
Ancestries Reported - Slovak (%)
Ancestries Reported - Subsaharan African (%)
Ancestries Reported - Swedish (%)
Ancestries Reported - Swiss (%)
Ancestries Reported - Ukrainian (%)
Ancestries Reported - United States (%)
Ancestries Reported - Welsh (%)
Ancestries Reported - West Indian (%)
Ancestries Reported - Other (%)
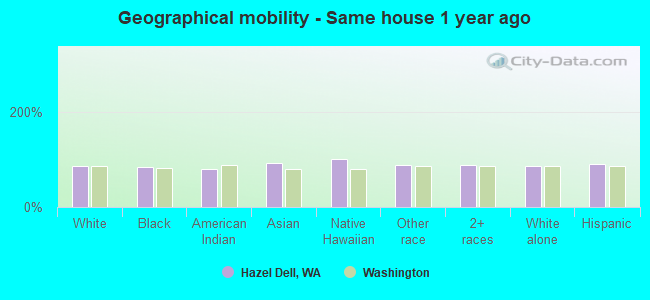
Geographical mobility - Same house 1 year ago (%)
Geographical mobility - Same house 1 year ago (%) - White
Geographical mobility - Same house 1 year ago (%) - Black or African American
Geographical mobility - Same house 1 year ago (%) - Asian
Geographical mobility - Same house 1 year ago (%) - Hispanic or Latino
Geographical mobility - Same house 1 year ago (%) - American Indian and Alaska Native
Geographical mobility - Same house 1 year ago (%) - Multirace
Geographical mobility - Same house 1 year ago (%) - Other Race
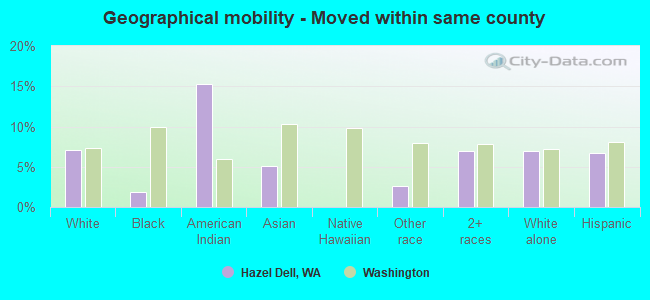
Geographical mobility - Moved within same county (%)
Geographical mobility - Moved within same county (%) - White
Geographical mobility - Moved within same county (%) - Black or African American
Geographical mobility - Moved within same county (%) - Asian
Geographical mobility - Moved within same county (%) - Hispanic or Latino
Geographical mobility - Moved within same county (%) - American Indian and Alaska Native
Geographical mobility - Moved within same county (%) - Multirace
Geographical mobility - Moved within same county (%) - Other Race
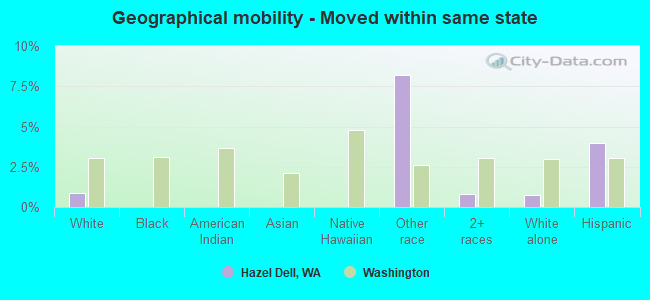
Geographical mobility - Moved from different county within same state (%)
Geographical mobility - Moved from different county within same state (%) - White
Geographical mobility - Moved from different county within same state (%) - Black or African American
Geographical mobility - Moved from different county within same state (%) - Asian
Geographical mobility - Moved from different county within same state (%) - Hispanic or Latino
Geographical mobility - Moved from different county within same state (%) - American Indian and Alaska Native
Geographical mobility - Moved from different county within same state (%) - Multirace
Geographical mobility - Moved from different county within same state (%) - Other Race
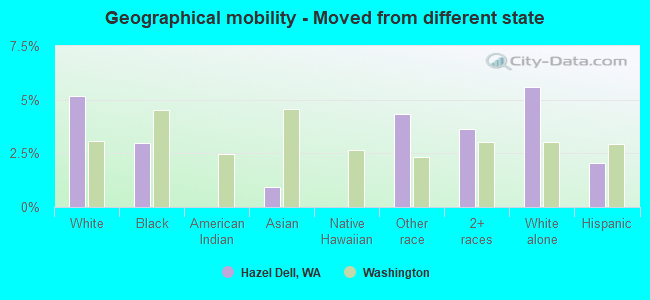
Geographical mobility - Moved from different state (%)
Geographical mobility - Moved from different state (%) - White
Geographical mobility - Moved from different state (%) - Black or African American
Geographical mobility - Moved from different state (%) - Asian
Geographical mobility - Moved from different state (%) - Hispanic or Latino
Geographical mobility - Moved from different state (%) - American Indian and Alaska Native
Geographical mobility - Moved from different state (%) - Multirace
Geographical mobility - Moved from different state (%) - Other Race
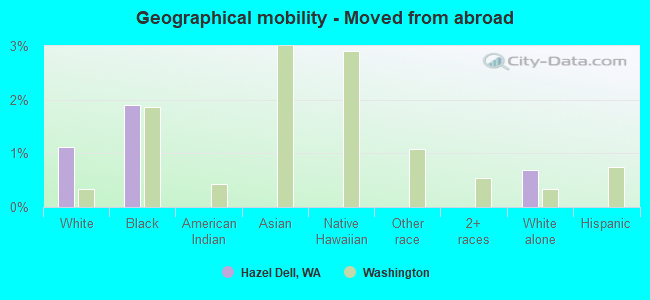
Geographical mobility - Moved from abroad (%)
Geographical mobility - Moved from abroad (%) - White
Geographical mobility - Moved from abroad (%) - Black or African American
Geographical mobility - Moved from abroad (%) - Asian
Geographical mobility - Moved from abroad (%) - Hispanic or Latino
Geographical mobility - Moved from abroad (%) - American Indian and Alaska Native
Geographical mobility - Moved from abroad (%) - Multirace
Geographical mobility - Moved from abroad (%) - Other Race
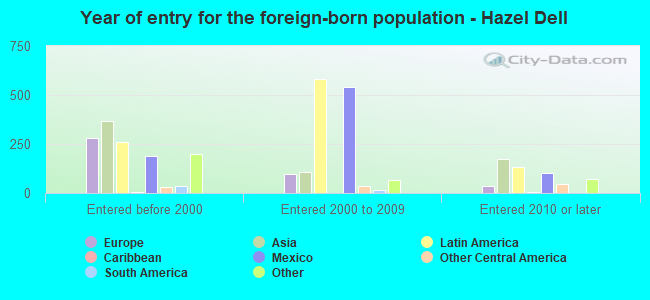
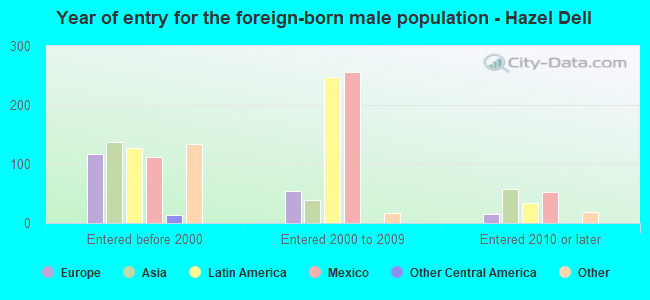
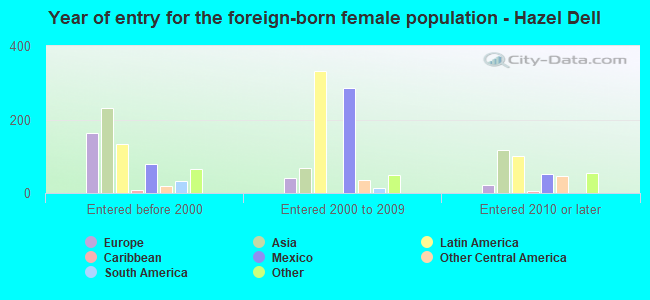
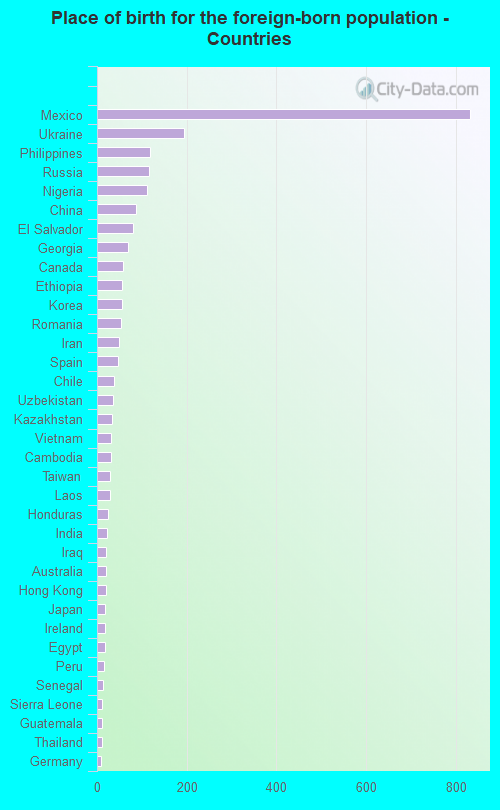
Place of birth for the foreign-born population - Ireland (%)
Place of birth for the foreign-born population - Denmark (%)
Place of birth for the foreign-born population - Norway (%)
Place of birth for the foreign-born population - Sweden (%)
Place of birth for the foreign-born population - United Kingdom (%)
Place of birth for the foreign-born population - England (%)
Place of birth for the foreign-born population - Scotland (%)
Place of birth for the foreign-born population - Other Northern Europe (%)
Place of birth for the foreign-born population - Austria (%)
Place of birth for the foreign-born population - Belgium (%)
Place of birth for the foreign-born population - France (%)
Place of birth for the foreign-born population - Germany (%)
Place of birth for the foreign-born population - Netherlands (%)
Place of birth for the foreign-born population - Switzerland (%)
Place of birth for the foreign-born population - Other Western Europe (%)
Place of birth for the foreign-born population - Greece (%)
Place of birth for the foreign-born population - Italy (%)
Place of birth for the foreign-born population - Portugal (%)
Place of birth for the foreign-born population - Spain (%)
Place of birth for the foreign-born population - Other Southern Europe (%)
Place of birth for the foreign-born population - Albania (%)
Place of birth for the foreign-born population - Belarus (%)
Place of birth for the foreign-born population - Bosnia and Herzegovina (%)
Place of birth for the foreign-born population - Bulgaria (%)
Place of birth for the foreign-born population - Croatia (%)
Place of birth for the foreign-born population - Czechoslovakia (%)
Place of birth for the foreign-born population - Hungary (%)
Place of birth for the foreign-born population - Latvia (%)
Place of birth for the foreign-born population - Lithuania (%)
Place of birth for the foreign-born population - North Macedonia (Macedonia) (%)
Place of birth for the foreign-born population - Moldova (%)
Place of birth for the foreign-born population - Poland (%)
Place of birth for the foreign-born population - Romania (%)
Place of birth for the foreign-born population - Russia (%)
Place of birth for the foreign-born population - Serbia (%)
Place of birth for the foreign-born population - Ukraine (%)
Place of birth for the foreign-born population - Other Eastern Europe (%)
Place of birth for the foreign-born population - China (%)
Place of birth for the foreign-born population - Hong Kong (%)
Place of birth for the foreign-born population - Taiwan (%)
Place of birth for the foreign-born population - Japan (%)
Place of birth for the foreign-born population - Korea (%)
Place of birth for the foreign-born population - Other Eastern Asia (%)
Place of birth for the foreign-born population - Afghanistan (%)
Place of birth for the foreign-born population - Bangladesh (%)
Place of birth for the foreign-born population - India (%)
Place of birth for the foreign-born population - Iran (%)
Place of birth for the foreign-born population - Kazakhstan (%)
Place of birth for the foreign-born population - Nepal (%)
Place of birth for the foreign-born population - Pakistan (%)
Place of birth for the foreign-born population - Sri Lanka (%)
Place of birth for the foreign-born population - Uzbekistan (%)
Place of birth for the foreign-born population - Other South Central Asia (%)
Place of birth for the foreign-born population - Burma (%)
Place of birth for the foreign-born population - Cambodia (%)
Place of birth for the foreign-born population - Indonesia (%)
Place of birth for the foreign-born population - Laos (%)
Place of birth for the foreign-born population - Malaysia (%)
Place of birth for the foreign-born population - Philippines (%)
Place of birth for the foreign-born population - Singapore (%)
Place of birth for the foreign-born population - Thailand (%)
Place of birth for the foreign-born population - Vietnam (%)
Place of birth for the foreign-born population - Other South Eastern Asia (%)
Place of birth for the foreign-born population - Armenia (%)
Place of birth for the foreign-born population - Iraq (%)
Place of birth for the foreign-born population - Israel (%)
Place of birth for the foreign-born population - Jordan (%)
Place of birth for the foreign-born population - Kuwait (%)
Place of birth for the foreign-born population - Lebanon (%)
Place of birth for the foreign-born population - Saudi Arabia (%)
Place of birth for the foreign-born population - Syria (%)
Place of birth for the foreign-born population - Turkey (%)
Place of birth for the foreign-born population - Yemen (%)
Place of birth for the foreign-born population - Other Western Asia (%)
Place of birth for the foreign-born population - Eritrea (%)
Place of birth for the foreign-born population - Ethiopia (%)
Place of birth for the foreign-born population - Kenya (%)
Place of birth for the foreign-born population - Somalia (%)
Place of birth for the foreign-born population - Uganda (%)
Place of birth for the foreign-born population - Zimbabwe (%)
Place of birth for the foreign-born population - Other Eastern Africa (%)
Place of birth for the foreign-born population - Cameroon (%)
Place of birth for the foreign-born population - Congo (%)
Place of birth for the foreign-born population - Democratic Republic of Congo (Zaire) (%)
Place of birth for the foreign-born population - Other Middle Africa (%)
Place of birth for the foreign-born population - Egypt (%)
Place of birth for the foreign-born population - Morocco (%)
Place of birth for the foreign-born population - Sudan (%)
Place of birth for the foreign-born population - Other Northern Africa (%)
Place of birth for the foreign-born population - South Africa (%)
Place of birth for the foreign-born population - Other Southern Africa (%)
Place of birth for the foreign-born population - Cabo Verde (%)
Place of birth for the foreign-born population - Ghana (%)
Place of birth for the foreign-born population - Liberia (%)
Place of birth for the foreign-born population - Nigeria (%)
Place of birth for the foreign-born population - Senegal (%)
Place of birth for the foreign-born population - Sierra Leone (%)
Place of birth for the foreign-born population - Other Western Africa (%)
Place of birth for the foreign-born population - Australia (%)
Place of birth for the foreign-born population - New Zealand (%)
Place of birth for the foreign-born population - Fiji (%)
Place of birth for the foreign-born population - Micronesia (%)
Place of birth for the foreign-born population - Bahamas (%)
Place of birth for the foreign-born population - Barbados (%)
Place of birth for the foreign-born population - Cuba (%)
Place of birth for the foreign-born population - Dominica (%)
Place of birth for the foreign-born population - Dominican Republic (%)
Place of birth for the foreign-born population - Grenada (%)
Place of birth for the foreign-born population - Haiti (%)
Place of birth for the foreign-born population - Jamaica (%)
Place of birth for the foreign-born population - St. Vincent and the Grenadines (%)
Place of birth for the foreign-born population - Trinidad and Tobago (%)
Place of birth for the foreign-born population - West Indies (%)
Place of birth for the foreign-born population - Other Caribbean (%)
Place of birth for the foreign-born population - Belize (%)
Place of birth for the foreign-born population - Costa Rica (%)
Place of birth for the foreign-born population - El Salvador (%)
Place of birth for the foreign-born population - Guatemala (%)
Place of birth for the foreign-born population - Honduras (%)
Place of birth for the foreign-born population - Mexico (%)
Place of birth for the foreign-born population - Nicaragua (%)
Place of birth for the foreign-born population - Panama (%)
Place of birth for the foreign-born population - Other Central America (%)
Place of birth for the foreign-born population - Argentina (%)
Place of birth for the foreign-born population - Bolivia (%)
Place of birth for the foreign-born population - Brazil (%)
Place of birth for the foreign-born population - Chile (%)
Place of birth for the foreign-born population - Colombia (%)
Place of birth for the foreign-born population - Ecuador (%)
Place of birth for the foreign-born population - Guyana (%)
Place of birth for the foreign-born population - Peru (%)
Place of birth for the foreign-born population - Uruguay (%)
Place of birth for the foreign-born population - Venezuela (%)
Place of birth for the foreign-born population - Other South America (%)
Place of birth for the foreign-born population - Canada (%)
Place of birth for the foreign-born population - Other Northern America (%)
Place of birth for the foreign-born population - Other (%)
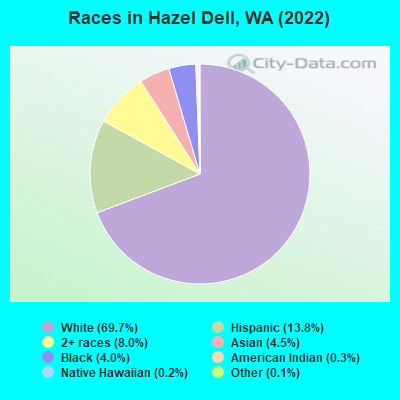
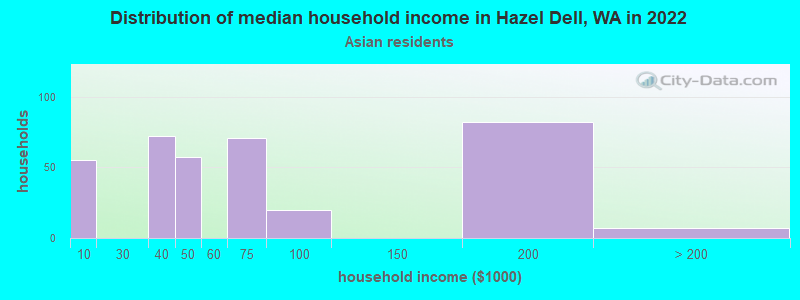
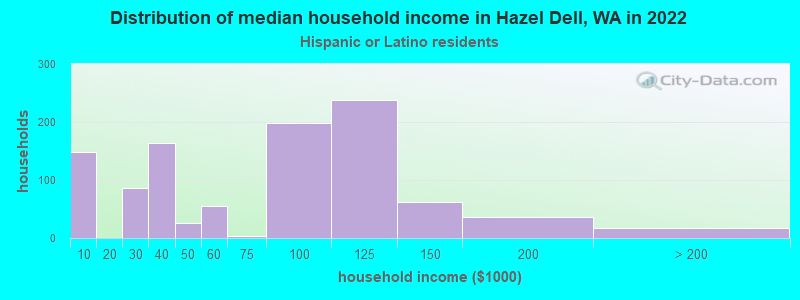
According to 2022 data, the most numerous races in Hazel Dell, WA are White alone (16,237 residents), Hispanic (3,208 residents), and Asian alone (1,049 residents). 80.4% of Hazel Dell residents speak English at home.
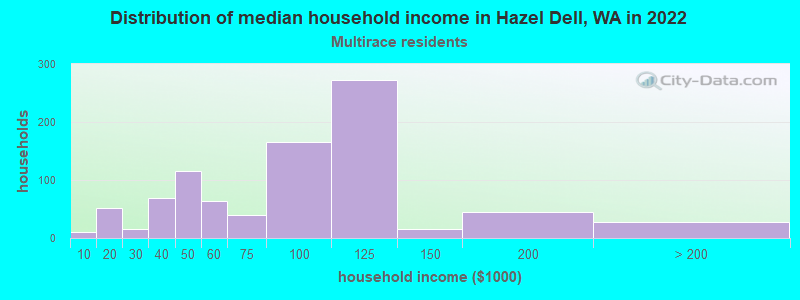
Race distribution in Hazel Dell 16,237 69.7% White alone 3,208 13.8% Hispanic 1,860 8.0% Two or more races 1,049 4.5% Asian alone 922 4.0% Black alone 64 0.3% American Indian alone 55 0.2% Native Hawaiian and Other 24 0.1% Other race alone
2000 2022
4,652,490 78.9% White alone 441,509 7.5% Hispanic 319,401 5.4% Asian alone 184,631 3.1% Black alone 175,926 3.0% Two or more races 85,396 1.4% American Indian alone 22,779 0.4% Native Hawaiian and Other 11,989 0.2% Other race alone
4,941,456 63.5% White alone 1,093,313 14.0% Hispanic 755,832 9.7% Asian alone 523,448 6.7% Two or more races 299,537 3.8% Black alone 69,024 0.9% American Indian alone 52,231 0.7% Native Hawaiian and Other 50,945 0.7% Other race alone
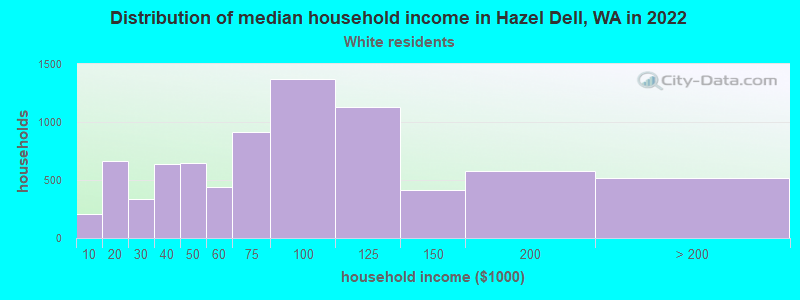
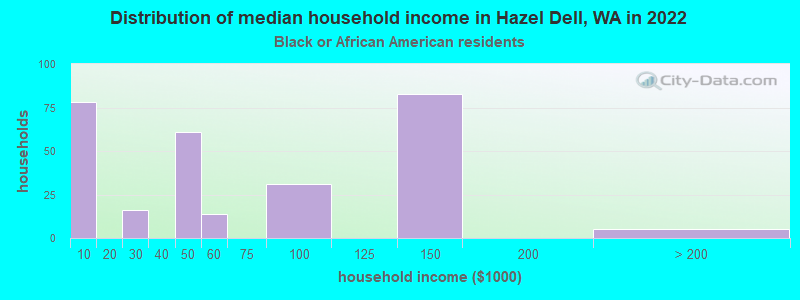
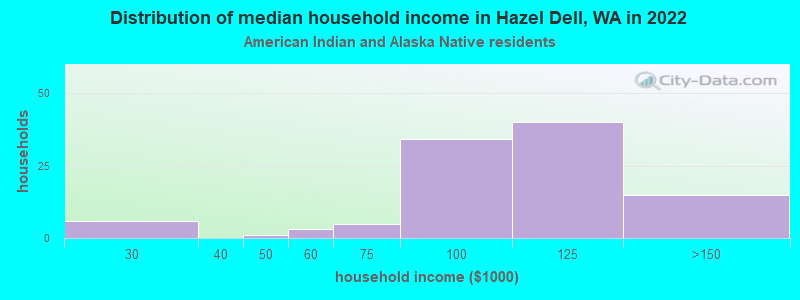
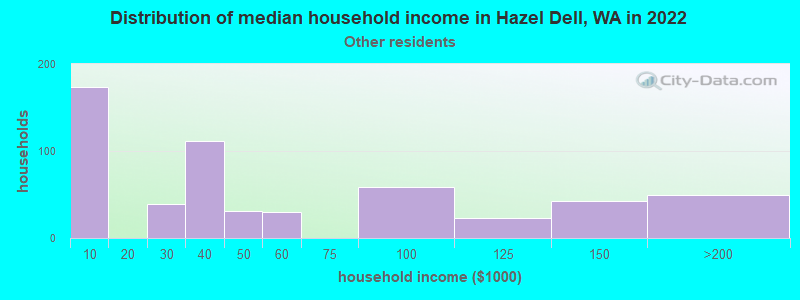
Income and house value in Hazel Dell Median household income in 2022 $74,095 White non-Hispanic householders$47,845 Black householders$98,943 American Indian and Alaska Native householders$62,145 Asian householders$49,867 Some other race householders$86,673 Two or more races householders$64,960 Hispanic or Latino race householders
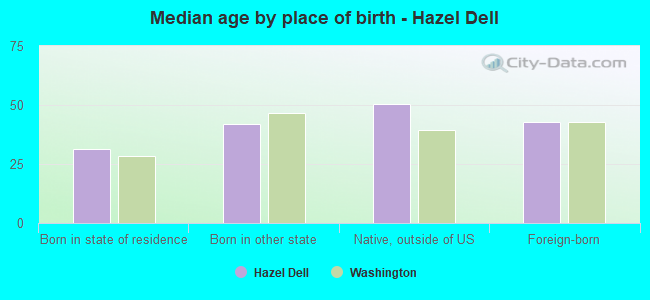
Median age by race in Hazel Dell
42.3 Median age for White residents40.7 44.2 44.3 Median age for Black or African American residents44.5 30.2 40.9 Median age for American Indian / Alaska Native residents40.8 51.0 31.0 Median age for Asian residents33.2 29.1 48.6 Median age for Native Hawaiian / Pacific Islander residents74.0 -928,017,717.8 29.9 Median age for Other race residents27.9 30.7 26.4 Median age for Two or more races residents26.7 30.9 42.9 Median age for White alone residents41.0 45.3 26.5 Median age for Hispanic or Latino residents26.6 26.3
Owner/renter occupied households by race in Hazel Dell
House owners and renters - White residents 4,735 60.6% Owner occupied3,074 39.4% Renter occupiedHouse owners and renters - Black or African American residents 74 27.6% Owner occupied194 72.4% Renter occupiedHouse owners and renters - American Indian / Alaska Native residents 50 51.3% Owner occupied48 48.7% Renter occupiedHouse owners and renters - Asian residents 191 67.5% Owner occupied92 32.5% Renter occupiedHouse owners and renters - Native Hawaiian / Pacific Islander residents 15 100.0% Owner occupiedHouse owners and renters - Other race residents 170 41.5% Owner occupied240 58.5% Renter occupiedHouse owners and renters - Two or more races residents 466 48.2% Owner occupied500 51.8% Renter occupiedHouse owners and renters - White alone residents 4,743 61.0% Owner occupied3,026 39.0% Renter occupiedHouse owners and renters - Hispanic or Latino residents 314 33.8% Owner occupied616 66.2% Renter occupied
Language usage in Hazel Dell
English speakers - Total 80.4% of residents of Hazel Dell speak English at home.
8.1% of residents speak Spanish at home 1,077 60.6% Speak English very well699 39.4% Speak English less than very well11.3% of residents speak other language at home 1,725 69.4% Speak English very well759 30.6% Speak English less than very well
English speakers - Born in the United States 86.9% of residents of Hazel Dell speak English at home.
4.6% of residents speak Spanish at home 550 93.4% Speak English very well39 6.6% Speak English less than very well10.5% of residents speak other language at home 984 72.7% Speak English very well369 27.3% Speak English less than very well
English speakers - Native, born elsewhere 82.1% of residents of Hazel Dell speak English at home.
15.1% of residents speak other language at home 45 61.6% Speak English very well28 38.4% Speak English less than very well
English speakers - Foreign-born 12.7% of residents of Hazel Dell speak English at home.
43.1% of residents speak Spanish at home 451 44.8% Speak English very well556 55.2% Speak English less than very well45.4% of residents speak other language at home 581 54.8% Speak English very well480 45.2% Speak English less than very well
White (Caucasian) - Speak only English Native:
93.3% (14,239)Foreign-born:
22.3% (185)
White (Caucasian) - Speak another language Native:
6.5% (997)Foreign-born:
76.8% (635)
Black or African American - Speak only English Native:
87.0% (388)Foreign-born:
11.1% (32)
Black or African American - Speak another language Native:
12.1% (54)Foreign-born:
87.4% (255)
American Indian / Alaska Native - Speak another language Native:
7.5% (15)Foreign-born:
100.0% (11)
Asian - Speak only English Native:
33.1% (175)Foreign-born:
14.8% (59)
Asian - Speak another language Native:
69.4% (366)Foreign-born:
83.9% (333)
Other race - Speak another language Native:
45.7% (360)Foreign-born:
100.0% (499)
Two or more races - Speak only English Native:
84.6% (1,934)Foreign-born:
7.7% (21)
Two or more races - Speak another language Native:
12.3% (281)Foreign-born:
81.9% (220)
White alone - Speak only English Native:
93.2% (14,102)Foreign-born:
28.1% (194)
White alone - Speak another language Native:
7.3% (1,105)Foreign-born:
72.0% (497)
Hispanic or Latino - Speak only English Native:
61.2% (1,037)Foreign-born:
1.8% (18)
Hispanic or Latino - Speak another language Native:
38.7% (655)Foreign-born:
100.0% (1,000)
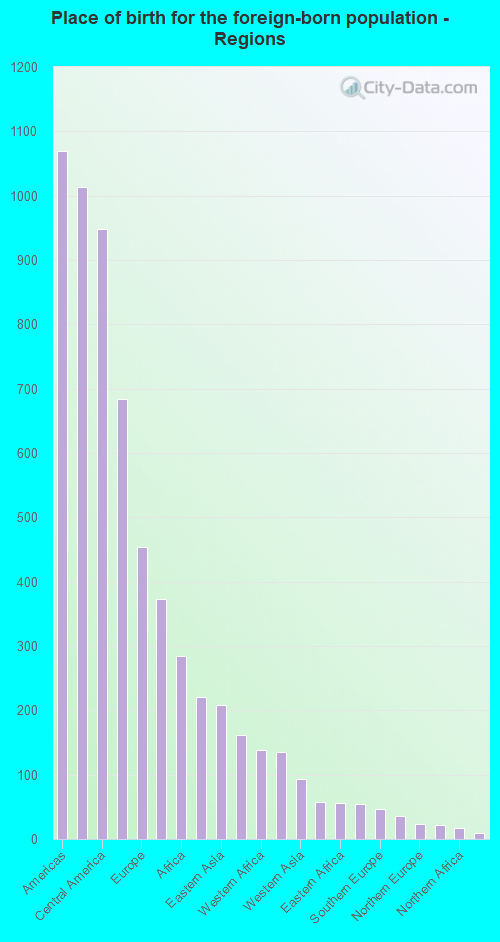
Foreign-born residents in Hazel Dell
Marital status for residents in Hazel Dell Marital status - White (Caucasian) population 15 years and over
Males 39.5% Never married43.1% Now married1.4% Separated2.2% Widowed13.8% DivorcedFemales 24.0% Never married42.6% Now married1.6% Separated8.8% Widowed23.0% DivorcedWomen who gave birth in the past 12 months Now married:
51.7% (44)Unmarried:
48.3% (41)
Women who did not give birth in the past 12 months Now married:
39.9% (1,460)Unmarried:
60.1% (2,204)
Marital status - Black or African American population 15 years and over
Males 25.3% Never married50.0% Now married1.0% Separated16.3% Widowed7.4% DivorcedFemales 1.9% Never married64.6% Now married0.0% Separated12.7% Widowed20.9% DivorcedWomen who gave birth in the past 12 months Now married:
100.0% (26)Unmarried:
0.0% (0)
Women who did not give birth in the past 12 months Now married:
47.8% (33)Unmarried:
52.2% (36)
Marital status - American Indian / Alaska Native population 15 years and over
Males 21.9% Never married44.8% Now married0.0% Separated0.0% Widowed33.3% DivorcedFemales 21.1% Never married39.4% Now married0.0% Separated9.9% Widowed29.6% DivorcedWomen who gave birth in the past 12 months Now married:
100.0% (9)Unmarried:
0.0% (0)
Women who did not give birth in the past 12 months Now married:
31.8% (8)Unmarried:
68.2% (18)
Marital status - Asian population 15 years and over
Males 58.2% Never married32.1% Now married0.0% Separated0.0% Widowed9.6% DivorcedFemales 21.8% Never married58.8% Now married0.0% Separated8.1% Widowed11.3% DivorcedWomen who gave birth in the past 12 months Now married:
37.5% (13)Unmarried:
62.5% (21)
Women who did not give birth in the past 12 months Now married:
61.9% (210)Unmarried:
38.1% (129)
Marital status - Native Hawaiian / Pacific Islander population 15 years and over
Males 0.0% Never married32.6% Now married0.0% Separated0.0% Widowed67.4% DivorcedFemales 0.0% Never married100.0% Now married0.0% Separated0.0% Widowed0.0% DivorcedWomen who did not give birth in the past 12 months Now married:
100.0% (23)Unmarried:
0.0% (0)
Marital status - Other race population 15 years and over
Males 62.3% Never married37.7% Now married0.0% Separated0.0% Widowed0.0% DivorcedFemales 28.5% Never married39.0% Now married9.8% Separated7.1% Widowed15.6% DivorcedWomen who gave birth in the past 12 months Now married:
66.2% (56)Unmarried:
33.8% (29)
Women who did not give birth in the past 12 months Now married:
48.7% (251)Unmarried:
51.3% (265)
Marital status - Two or more races population 15 years and over
Males 56.3% Never married33.2% Now married0.0% Separated0.0% Widowed10.5% DivorcedFemales 36.8% Never married41.4% Now married0.0% Separated9.3% Widowed12.5% DivorcedWomen who gave birth in the past 12 months Now married:
100.0% (14)Unmarried:
0.0% (0)
Women who did not give birth in the past 12 months Now married:
46.0% (272)Unmarried:
54.0% (319)
Marital status - White alone, not Hispanic / Latino population 15 years and over
Males 38.4% Never married43.7% Now married1.3% Separated2.3% Widowed14.3% DivorcedFemales 23.0% Never married42.5% Now married1.7% Separated9.1% Widowed23.7% DivorcedWomen who gave birth in the past 12 months Now married:
51.7% (45)Unmarried:
48.3% (42)
Women who did not give birth in the past 12 months Now married:
40.5% (1,449)Unmarried:
59.5% (2,132)
Marital status - Hispanic or Latino population 15 years and over
Males 56.7% Never married37.7% Now married1.0% Separated0.0% Widowed4.7% DivorcedFemales 33.0% Never married40.7% Now married5.5% Separated5.6% Widowed15.2% DivorcedWomen who gave birth in the past 12 months Now married:
69.3% (67)Unmarried:
30.7% (30)
Women who did not give birth in the past 12 months Now married:
45.0% (411)Unmarried:
55.0% (502)
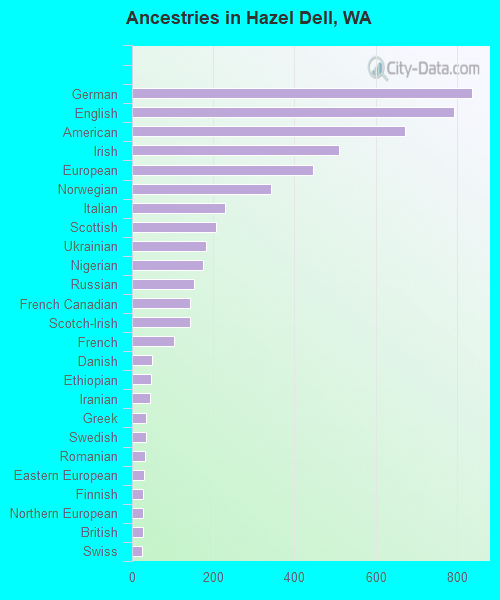
Ancestries in Hazel Dell
837 8.7% German792 8.3% English672 7.0% American509 5.3% Irish445 4.6% European341 3.6% Norwegian228 2.4% Italian208 2.2% Scottish181 1.9% Ukrainian176 1.8% Nigerian153 1.6% Russian143 1.5% French Canadian142 1.5% Scotch-Irish104 1.1% French50 0.5% Danish46 0.5% Ethiopian45 0.5% Iranian35 0.4% Greek34 0.4% Swedish32 0.3% Romanian29 0.3% Eastern European28 0.3% Finnish27 0.3% Northern European27 0.3% British24 0.3% Swiss23 0.2% Slovene19 0.2% Welsh17 0.2% Scandinavian16 0.2% Dutch14 0.1% Canadian13 0.1% Senegalese8 0.08% Slavic8 0.08% Czech7 0.07% Polish6 0.06% Austrian4 0.04% Jamaican
Geographical mobility in Hazel Dell Same house 1 year ago 14,149 85.7% White (Caucasian)756 84.2% Black or African American175 79.3% American Indian / Alaska Native959 93.3% Asian68 100.0% Native Hawaiian / Pacific Islander1,328 88.7% Other race2,680 88.3% Two or more races13,838 85.3% White alone, not Hispanic / Latino2,786 89.6% Hispanic or LatinoMoved within same county 1,167 7.1% White / Caucasian17 1.9% Black or African American34 15.3% American Indian / Alaska Native53 5.1% Asian38 2.6% Other race210 6.9% Two or more races1,131 7.0% White alone, not Hispanic / Latino208 6.7% Hispanic or LatinoMoved within same state 142 0.9% White / Caucasian122 8.2% Other race24 0.8% Two or more races120 0.7% White alone, not Hispanic / Latino123 3.9% Hispanic or LatinoMoved from different state 853 5.2% White / Caucasian27 3.0% Black or African American9 0.9% Asian65 4.3% Other race111 3.7% Two or more races909 5.6% White alone, not Hispanic / Latino64 2.1% Hispanic or LatinoMoved from abroad 184 1.1% White17 1.9% Black or African American112 0.7% White alone, not Hispanic / Latino
Children Nativity (place of birth) in Hazel Dell
Children under 6 years - Living with two parents Both parents native 384 100.0% NativeBoth parents foreign-born 106 100.0% NativeOne native, one foreign-born parent 225 93.7% Native15 6.3% Foreign-bornChildren under 6 years - Living with one parent Native parent 472 100.0% NativeForeign-born parent 169 100.0% NativeChildren 6 to 17 years - Living with two parents Both parents native 1,092 100.0% Native0 0.0% Foreign-bornBoth parents foreign-born 101 99.3% Native1 0.7% Foreign-bornOne native, one foreign-born parent 189 100.0% NativeChildren 6 to 17 years - Living with one parent Native parent 1,128 100.0% NativeForeign-born parent 136 57.0% Native103 43.0% Foreign-born
Grandparents responsible for own grandchildren in Hazel Dell
Grandparents (30 to 59 years) White / Caucasian 30 45.7% Responsible for grandchildren36 54.3% Not responsible for grandchildrenBlack or African American 28 100.0% Not responsible for grandchildrenAmerican Indian / Alaska Native 15 100.0% Not responsible for grandchildrenOther race 53 100.0% Not responsible for grandchildrenWhite alone, not Hispanic / Latino 30 48.2% Responsible for grandchildren32 51.8% Not responsible for grandchildrenHispanic or Latino 49 100.0% Not responsible for grandchildrenGrandparents (60 years and over) White / Caucasian 26 16.4% Responsible for grandchildren134 83.6% Not responsible for grandchildrenBlack or African American 24 100.0% Not responsible for grandchildrenWhite alone, not Hispanic / Latino 28 16.5% Responsible for grandchildren140 83.5% Not responsible for grandchildren