Races in Helena, Georgia (GA) Detailed Stats
Ancestries, Foreign-born residents, place of birth

Recent posts about races in Helena, Georgia on our local forum with over 2,400,000 registered users:
 | McRae-Helena, Ga (23 replies) |
| Potential Move - AC and Commute Question (15 replies) |
| African-Americans of Savannah, Georgia (51 replies) |
| Is Athens GA right for us?? (15 replies) |
| Savannah, Beaufort and Charleston w/kids -Itinerary Feedback (7 replies) |
| Is SW or SE Small Farm, Georgia area? (16 replies) |
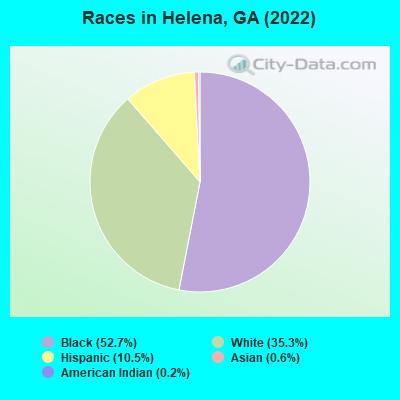
According to 2022 data, the most numerous races in Helena, GA are White alone (1,144 residents), Black alone (1,710 residents), and Hispanic (342 residents). 91.2% of Helena residents speak English at home. 5.2% of Helena, GA residents are foreign-born (4.5% born in Latin America), which is 91.9% less than the foreign-born rate of 10.0% across the entire state of Georgia.
Race distribution in Helena

2000
2022

- 5,128,66162.6%White alone
- 2,331,46528.5%Black alone
- 435,2275.3%Hispanic
- 171,5132.1%Asian alone
- 87,3641.1%Two or more races
- 17,6700.2%American Indian alone
- 11,2750.1%Other race alone
- 3,2780.04%Native Hawaiian and Other
Pacific Islander alone

-
- 5,415,65749.6%White alone
- 3,349,24030.7%Black alone
- 1,132,60410.4%Hispanic
- 479,1564.4%Asian alone
- 462,9234.2%Two or more races
- 54,4160.5%Other race alone
- 11,9230.1%American Indian alone
- 6,9570.06%Native Hawaiian and Other
Pacific Islander alone

Income and house value in Helena
- Median household income in 2022
- $38,569White non-Hispanic householders
- $18,859Black householders
- $56,530Asian householders
- $50,987Some other race householders
- $11,605Two or more races householders
- $50,125Hispanic or Latino race householders
- Median 2022 house value
- $104,484White Non-Hispanic householders
- $72,020Black or African American householders
- $150,042Two or more races householders
Household income for White non-Hispanic householders

Household income for Black householders

Household income for Asian householders

Household income for Hispanic or Latino race householders

Median age by race in Helena
- 43.7Median age for White residents
- 39.7Males
- 57.3Females
- 38.8Median age for Black or African American residents
- 38.1Males
- 44.9Females
- 30.8Median age for American Indian / Alaska Native residents
- 29.6Median age for Asian residents
- 18.0Median age for Other race residents
- 51.8Median age for White alone residents
- 43.6Males
- 61.4Females
- 21.5Median age for Hispanic or Latino residents
- 27.4Males
- 5.9Females
Owner/renter occupied households by race in Helena
- House owners and renters - White residents
- 32561.4%Owner occupied
- 20538.6%Renter occupied
- House owners and renters - Black or African American residents
- 14039.7%Owner occupied
- 21360.3%Renter occupied
- House owners and renters - Asian residents
- 755.9%Owner occupied
- 644.1%Renter occupied
- House owners and renters - Other race residents
- 4100.0%Renter occupied
- House owners and renters - White alone residents
- 32665.9%Owner occupied
- 16934.1%Renter occupied
- House owners and renters - Hispanic or Latino residents
- 51100.0%Renter occupied
Language usage in Helena
- English speakers - Total
- 91.2% of residents of Helena speak English at home.
- 6.9% of residents speak Spanish at home
- 8639.8%Speak English very well
- 13060.2%Speak English less than very well
- 0.4% of residents speak other language at home
- 13100.0%Speak English less than very well
All residents speak only English at home
All residents speak only English at home
- English speakers - Foreign-born
- 1.0% of residents of Helena speak English at home.
- 76.1% of residents speak Spanish at home
- 5838.7%Speak English very well
- 9261.3%Speak English less than very well
- 6.1% of residents speak other language at home
- 12100.0%Speak English less than very well
White (Caucasian) - Speak only English
| Native: | 97.5% (1,159) |
| Foreign-born: | 2.3% (2) |
White (Caucasian) - Speak another language
| Native: | 2.7% (32) |
| Foreign-born: | 89.0% (83) |
Other race - Speak another language
| Native: | 87.6% (21) |
| Foreign-born: | 96.9% (24) |
Hispanic or Latino - Speak only English
| Native: | 17.2% (16) |
| Foreign-born: | 1.7% (3) |
Hispanic or Latino - Speak another language
| Native: | 80.1% (75) |
| Foreign-born: | 97.3% (147) |
Foreign-born residents in Helena
169 residents are foreign born (4.5% Latin America).
| This city: | 5.2% |
| Georgia: | 100.0% |


Marital status for residents in Helena
Marital status - White (Caucasian) population 15 years and over
- Males
- 39.9%Never married
- 44.4%Now married
- 3.8%Separated
- 2.5%Widowed
- 9.4%Divorced
- Females
- 13.6%Never married
- 55.4%Now married
- 0.0%Separated
- 26.4%Widowed
- 4.6%Divorced
Women who did not give birth in the past 12 months
| Now married: | 81.9% (116) |
| Unmarried: | 18.1% (26) |
Marital status - Black or African American population 15 years and over
- Males
- 78.5%Never married
- 15.7%Now married
- 0.7%Separated
- 0.3%Widowed
- 4.8%Divorced
- Females
- 39.3%Never married
- 41.9%Now married
- 0.0%Separated
- 16.1%Widowed
- 2.6%Divorced
Women who did not give birth in the past 12 months
| Now married: | 45.2% (61) |
| Unmarried: | 54.8% (74) |
Marital status - Asian population 15 years and over
- Males
- 0.0%Never married
- 69.2%Now married
- 0.0%Separated
- 0.0%Widowed
- 30.8%Divorced
- Females
- 0.0%Never married
- 100.0%Now married
- 0.0%Separated
- 0.0%Widowed
- 0.0%Divorced
Women who did not give birth in the past 12 months
| Now married: | 100.0% (3) |
| Unmarried: | 0.0% (0) |
Marital status - Other race population 15 years and over
- Males
- 80.0%Never married
- 20.0%Now married
- 0.0%Separated
- 0.0%Widowed
- 0.0%Divorced
- Females
- 0.0%Never married
- 100.0%Now married
- 0.0%Separated
- 0.0%Widowed
- 0.0%Divorced
Women who did not give birth in the past 12 months
| Now married: | 100.0% (5) |
| Unmarried: | 0.0% (0) |
Marital status - White alone, not Hispanic / Latino population 15 years and over
- Males
- 35.3%Never married
- 45.6%Now married
- 4.6%Separated
- 3.0%Widowed
- 11.4%Divorced
- Females
- 14.1%Never married
- 53.7%Now married
- 0.0%Separated
- 27.4%Widowed
- 4.8%Divorced
Women who did not give birth in the past 12 months
| Now married: | 79.6% (101) |
| Unmarried: | 20.4% (26) |
Marital status - Hispanic or Latino population 15 years and over
- Males
- 63.6%Never married
- 36.4%Now married
- 0.0%Separated
- 0.0%Widowed
- 0.0%Divorced
- Females
- 0.0%Never married
- 100.0%Now married
- 0.0%Separated
- 0.0%Widowed
- 0.0%Divorced
Women who did not give birth in the past 12 months
| Now married: | 100.0% (28) |
| Unmarried: | 0.0% (0) |
Ancestries in Helena

- 89233.4%English
- 1224.6%American
- 40.1%Irish
- 30.1%Scotch-Irish
- 30.1%African

Geographical mobility in Helena

- Same house 1 year ago
- 1,32697.9%White (Caucasian)
- 1,718100.0%Black or African American
- 1899.7%American Indian / Alaska Native
- 23100.0%Asian
- 52100.0%Other race
- 1,12898.4%White alone, not Hispanic / Latino
- 34299.6%Hispanic or Latino

-
- Moved within same county
- 150.9%Black or African American

-
- Moved within same state
- 634.6%White / Caucasian
- 673.9%Black or African American
- 423.7%White alone, not Hispanic / Latino
- 236.7%Hispanic or Latino

Children Nativity (place of birth) in Helena
Place of birth for residents in Helena
![Place of birth for the foreign-born population - Regions]()
- 149Americas
- 149Latin America
- 145Central America
- 11Asia
- 11Eastern Asia
- 11China
- 8Europe
- 8Southern Europe
- 4South America

![Place of birth for the foreign-born population - Countries]()
- 140Mexico
- 11China
- 8Portugal
- 5Honduras
- 4Colombia
