Races in Henderson, Kentucky (KY) Detailed Stats
Ancestries, Foreign-born residents, place of birth
Settings
X


Recent posts about races in Henderson, Kentucky on our local forum with over 2,400,000 registered users:
 | Why did Kentucky have few African American (16 replies) |
| Place to retire in KY. Henderson? Covington? (12 replies) |
| Single woman retiring to Kentucky or Tennessee (15 replies) |
| Any houses for rent in Henderson? (8 replies) |
| close to racetracks? (3 replies) |
| Moving from Greater Richmond Virginia to Kentucky (16 replies) |
Latest news about races in Henderson, KY collected exclusively by city-data.com from local newspapers, TV, and radio stations
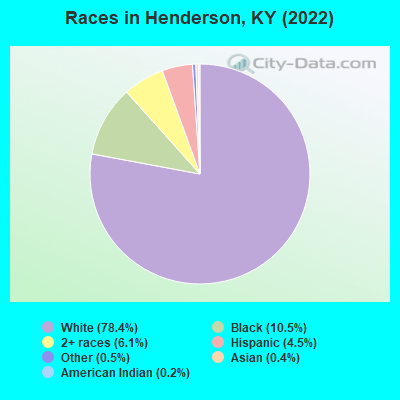
According to 2022 data, the most numerous races in Henderson, KY are White alone (22,125 residents), Black alone (2,955 residents), and Hispanic (1,283 residents). 96.8% of Henderson residents speak English at home. 2.0% of Henderson, KY residents are foreign-born , which is 104.5% less than the foreign-born rate of 4.0% across the entire state of Kentucky.
Race distribution in Henderson
2000
2022

- 23,72386.7%White alone
- 2,85910.4%Black alone
- 3471.3%Hispanic
- 2520.9%Two or more races
- 1100.4%Asian alone
- 470.2%American Indian alone
- 330.1%Other race alone
- 20.01%Native Hawaiian and Other
Pacific Islander alone

-
- 22,12578.4%White alone
- 2,95510.5%Black alone
- 1,7246.1%Two or more races
- 1,2834.5%Hispanic
- 1430.5%Other race alone
- 1120.4%Asian alone
- 690.2%American Indian alone
- 40.01%Native Hawaiian and Other
Pacific Islander alone
2000
2022
-
- 3,608,01389.3%White alone
- 293,6397.3%Black alone
- 59,9391.5%Hispanic
- 37,7500.9%Two or more races
- 29,3680.7%Asian alone
- 7,9390.2%American Indian alone
- 3,8460.10%Other race alone
- 1,2750.03%Native Hawaiian and Other
Pacific Islander alone

-
- 3,710,99882.2%White alone
- 343,1947.6%Black alone
- 187,4834.2%Hispanic
- 187,3944.2%Two or more races
- 62,2401.4%Asian alone
- 13,5290.3%Other race alone
- 4,3020.10%American Indian alone
- 3,1700.07%Native Hawaiian and Other
Pacific Islander alone

Income and house value in Henderson
- Median household income in 2022
- $48,697White non-Hispanic householders
- $35,248Black householders
- $44,083Some other race householders
- $32,713Two or more races householders
- $38,642Hispanic or Latino race householders
- Median 2022 house value
- $174,873White Non-Hispanic householders
- $109,635Black or African American householders
- $355,863Asian householders
- $222,669Some other race householders
- $32,392Two or more races householders
- $249,172Hispanic or Latino householders
Household income for White non-Hispanic householders

Household income for Black householders

Household income for American Indian and Alaska Native householders

Household income for Some other race householders

Household income for Two or more races householders

Household income for Hispanic or Latino race householders

Median age by race in Henderson
- 42.0Median age for White residents
- 40.0Males
- 43.1Females
- 40.8Median age for Black or African American residents
- 41.3Males
- 40.6Females
- 40.2Median age for American Indian / Alaska Native residents
- 40.5Males
- -630,065,358.8Females
- 42.9Median age for Asian residents
- 24.9Males
- 58.2Females
- -755,186,721.2Median age for Native Hawaiian / Pacific Islander residents
- -724,043,715.1Males
- -853,801,168.7Females
- 31.3Median age for Other race residents
- 29.5Males
- 46.2Females
- 19.2Median age for Two or more races residents
- 19.0Males
- 18.8Females
- 42.4Median age for White alone residents
- 40.6Males
- 43.9Females
- 28.1Median age for Hispanic or Latino residents
- 29.9Males
- 25.8Females
Owner/renter occupied households by race in Henderson
- House owners and renters - White residents
- 5,93756.7%Owner occupied
- 4,53643.3%Renter occupied
- House owners and renters - Black or African American residents
- 46341.4%Owner occupied
- 65558.6%Renter occupied
- House owners and renters - American Indian / Alaska Native residents
- 39.3%Owner occupied
- 2690.7%Renter occupied
- House owners and renters - Asian residents
- 14100.0%Owner occupied
- House owners and renters - Native Hawaiian / Pacific Islander residents
- 3100.0%Renter occupied
- House owners and renters - Other race residents
- 7021.0%Owner occupied
- 26379.0%Renter occupied
- House owners and renters - Two or more races residents
- 29751.1%Owner occupied
- 28448.9%Renter occupied
- House owners and renters - White alone residents
- 5,91557.4%Owner occupied
- 4,39642.6%Renter occupied
- House owners and renters - Hispanic or Latino residents
- 16330.5%Owner occupied
- 37269.5%Renter occupied
Language usage in Henderson
- English speakers - Total
- 96.8% of residents of Henderson speak English at home.
- 2.2% of residents speak Spanish at home
- 31854.2%Speak English very well
- 26945.8%Speak English less than very well
- 1.0% of residents speak other language at home
- 14756.3%Speak English very well
- 11443.7%Speak English less than very well
- English speakers - Born in the United States
- 96.7% of residents of Henderson speak English at home.
- 2.6% of residents speak Spanish at home
- 17472.8%Speak English very well
- 6527.2%Speak English less than very well
- 0.6% of residents speak other language at home
- 54100.0%Speak English very well
- English speakers - Native, born elsewhere
- 40.0% of residents of Henderson speak English at home.
- 66.7% of residents speak Spanish at home
- 2040.0%Speak English very well
- 3060.0%Speak English less than very well
- English speakers - Foreign-born
- 21.7% of residents of Henderson speak English at home.
- 48.7% of residents speak Spanish at home
- 7429.4%Speak English very well
- 17870.6%Speak English less than very well
- 30.2% of residents speak other language at home
- 5434.6%Speak English very well
- 10265.4%Speak English less than very well
White (Caucasian) - Speak only English
| Native: | 99.2% (21,278) |
| Foreign-born: | 25.2% (26) |
White (Caucasian) - Speak another language
| Native: | 0.8% (178) |
| Foreign-born: | 72.0% (74) |
Black or African American - Speak only English
| Native: | 99.1% (2,584) |
| Foreign-born: | 62.9% (36) |
Black or African American - Speak another language
| Native: | 1.0% (26) |
| Foreign-born: | 41.9% (24) |
Other race - Speak another language
| Native: | 48.9% (214) |
| Foreign-born: | 98.6% (194) |
Two or more races - Speak another language
| Native: | 0.7% (11) |
| Foreign-born: | 98.8% (71) |
White alone - Speak only English
| Native: | 99.0% (20,745) |
| Foreign-born: | 34.9% (28) |
White alone - Speak another language
| Native: | 1.0% (200) |
| Foreign-born: | 64.2% (51) |
Hispanic or Latino - Speak another language
| Native: | 22.0% (208) |
| Foreign-born: | 100.0% (250) |
Foreign-born residents in Henderson
552 residents are foreign born
| This city: | 2.0% |
| Kentucky: | 4.1% |


Marital status for residents in Henderson
Marital status - White (Caucasian) population 15 years and over
- Males
- 28.8%Never married
- 51.9%Now married
- 2.8%Separated
- 4.7%Widowed
- 11.7%Divorced
- Females
- 19.1%Never married
- 46.5%Now married
- 2.9%Separated
- 15.1%Widowed
- 16.3%Divorced
Women who gave birth in the past 12 months
| Now married: | 65.7% (153) |
| Unmarried: | 34.3% (80) |
Women who did not give birth in the past 12 months
| Now married: | 47.5% (2,253) |
| Unmarried: | 52.5% (2,492) |
Marital status - Black or African American population 15 years and over
- Males
- 46.5%Never married
- 39.8%Now married
- 0.6%Separated
- 2.4%Widowed
- 10.8%Divorced
- Females
- 37.2%Never married
- 47.0%Now married
- 1.0%Separated
- 1.9%Widowed
- 12.8%Divorced
Women who gave birth in the past 12 months
| Now married: | 27.3% (12) |
| Unmarried: | 72.7% (32) |
Women who did not give birth in the past 12 months
| Now married: | 56.1% (349) |
| Unmarried: | 43.9% (274) |
Marital status - American Indian / Alaska Native population 15 years and over
- Males
- 61.8%Never married
- 38.2%Now married
- 0.0%Separated
- 0.0%Widowed
- 0.0%Divorced
- Females
- 0.0%Never married
- 46.2%Now married
- 0.0%Separated
- 53.8%Widowed
- 0.0%Divorced
Marital status - Asian population 15 years and over
- Males
- 56.7%Never married
- 43.3%Now married
- 0.0%Separated
- 0.0%Widowed
- 0.0%Divorced
- Females
- 25.4%Never married
- 41.8%Now married
- 0.0%Separated
- 0.0%Widowed
- 32.8%Divorced
Women who did not give birth in the past 12 months
| Now married: | 41.4% (11) |
| Unmarried: | 58.6% (15) |
Marital status - Other race population 15 years and over
- Males
- 66.9%Never married
- 16.9%Now married
- 0.0%Separated
- 0.0%Widowed
- 16.2%Divorced
- Females
- 17.7%Never married
- 82.3%Now married
- 0.0%Separated
- 0.0%Widowed
- 0.0%Divorced
Women who did not give birth in the past 12 months
| Now married: | 76.3% (140) |
| Unmarried: | 23.7% (43) |
Marital status - Two or more races population 15 years and over
- Males
- 52.9%Never married
- 26.4%Now married
- 0.0%Separated
- 0.0%Widowed
- 20.7%Divorced
- Females
- 64.0%Never married
- 22.0%Now married
- 0.0%Separated
- 3.6%Widowed
- 10.4%Divorced
Women who did not give birth in the past 12 months
| Now married: | 19.3% (100) |
| Unmarried: | 80.7% (419) |
Marital status - White alone, not Hispanic / Latino population 15 years and over
- Males
- 28.4%Never married
- 52.1%Now married
- 2.9%Separated
- 4.8%Widowed
- 11.8%Divorced
- Females
- 19.1%Never married
- 46.5%Now married
- 3.0%Separated
- 15.4%Widowed
- 16.1%Divorced
Women who gave birth in the past 12 months
| Now married: | 57.5% (109) |
| Unmarried: | 42.5% (81) |
Women who did not give birth in the past 12 months
| Now married: | 47.5% (2,258) |
| Unmarried: | 52.5% (2,498) |
Marital status - Hispanic or Latino population 15 years and over
- Males
- 58.5%Never married
- 20.4%Now married
- 0.0%Separated
- 0.0%Widowed
- 21.1%Divorced
- Females
- 17.9%Never married
- 62.5%Now married
- 0.0%Separated
- 3.1%Widowed
- 16.5%Divorced
Women who gave birth in the past 12 months
| Now married: | 100.0% (50) |
| Unmarried: | 0.0% (0) |
Women who did not give birth in the past 12 months
| Now married: | 73.4% (138) |
| Unmarried: | 26.6% (50) |
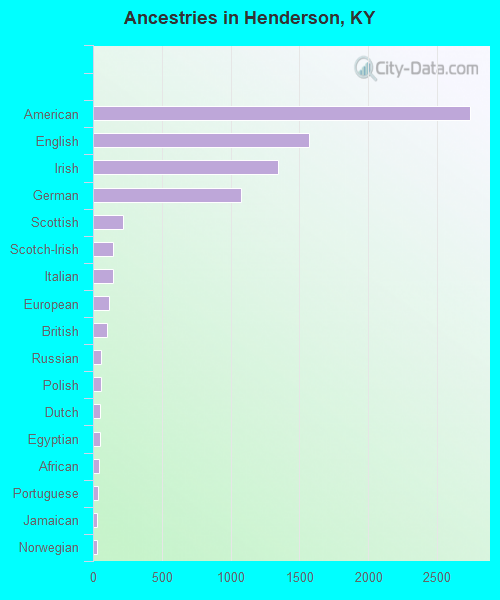
Ancestries in Henderson

- 2,74223.6%American
- 1,57213.5%English
- 1,34711.6%Irish
- 1,0739.2%German
- 2161.9%Scottish
- 1471.3%Scotch-Irish
- 1461.3%Italian
- 1141.0%European
- 1020.9%British
- 600.5%Russian
- 560.5%Polish
- 520.4%Dutch
- 480.4%Egyptian
- 450.4%African
- 330.3%Portuguese
- 320.3%Jamaican
- 260.2%Norwegian
- 230.2%Lithuanian
- 200.2%Danish
- 160.1%Lebanese
- 160.1%Welsh
- 150.1%Swiss
- 130.1%French
- 120.1%French Canadian
- 110.09%Northern European
- 100.09%Pennsylvania German
- 70.06%West Indian
- 30.03%Scandinavian
Geographical mobility in Henderson

- Same house 1 year ago
- 19,47986.8%White (Caucasian)
- 2,45886.5%Black or African American
- 4765.4%American Indian / Alaska Native
- 11197.9%Asian
- 4100.0%Native Hawaiian / Pacific Islander
- 63490.8%Other race
- 1,63789.3%Two or more races
- 19,05386.8%White alone, not Hispanic / Latino
- 1,07087.5%Hispanic or Latino

-
- Moved within same county
- 1,9778.8%White / Caucasian
- 2799.8%Black or African American
- 1216.3%American Indian / Alaska Native
- 152.1%Other race
- 221.2%Two or more races
- 1,9348.8%White alone, not Hispanic / Latino
- 776.3%Hispanic or Latino

-
- Moved within same state
- 5752.6%White / Caucasian
- 652.3%Black or African American
- 90.5%Two or more races
- 5772.6%White alone, not Hispanic / Latino
- 30.3%Hispanic or Latino

-
- Moved from different state
- 2961.3%White / Caucasian
- 461.6%Black or African American
- 1115.8%American Indian / Alaska Native
- 679.6%Other race
- 643.5%Two or more races
- 2891.3%White alone, not Hispanic / Latino
- 756.1%Hispanic or Latino

-
- Moved from abroad
- 1719.3%Two or more races

Children Nativity (place of birth) in Henderson
Place of birth for residents in Henderson
![Place of birth for the foreign-born population - Regions]()
- 299Americas
- 287Latin America
- 187Central America
- 160Asia
- 76Eastern Asia
- 76China
- 70Europe
- 58Caribbean
- 47Eastern Europe
- 46South Central Asia
- 41South America
- 36South Eastern Asia
- 22Western Europe
- 22Africa
- 22Northern Africa
- 12Northern America

![Place of birth for the foreign-born population - Countries]()
- 162Mexico
- 76China
- 47Russia
- 41Argentina
- 29Jamaica
- 28Cuba
- 27India
- 25Honduras
- 22Vietnam
- 22Egypt
- 14Philippines
- 12Netherlands
- 12Canada
- 10Germany

Grandparents responsible for own grandchildren in Henderson
Zip codes: 42420.