Races in Highland, Indiana (IN) Detailed Stats
Data:
Races - White alone (%)
Races - White alone (% change since 2000)
Races - Black alone (%)
Races - Black alone (% change since 2000)
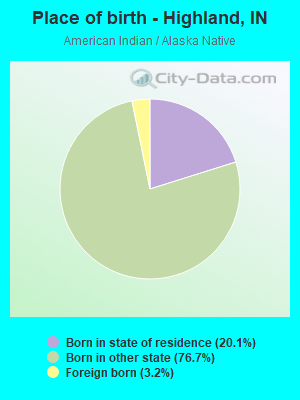
Races - American Indian alone (%)
Races - American Indian alone (% change since 2000)
Races - Asian alone (%)
Races - Asian alone (% change since 2000)
Races - Hispanic (%)
Races - Hispanic (% change since 2000)
Races - Native Hawaiian and Other Pacific Islander alone (%)
Races - Native Hawaiian and Other Pacific Islander alone (% change since 2000)
Races - Two or more races(%)
Races - Two or more races(% change since 2000)
Races - Other race alone (%)
Races - Other race alone (% change since 2000)
Racial diversity
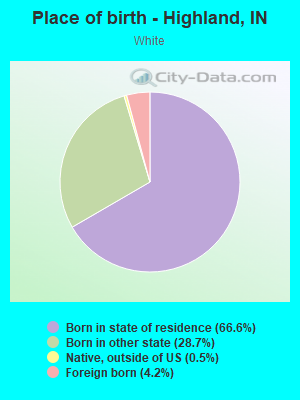
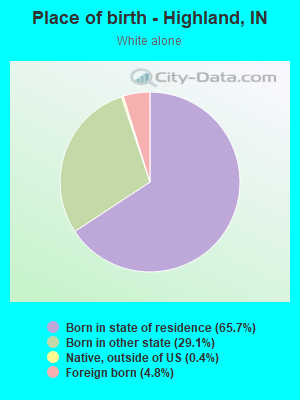
Place of birth - Born in state of residence (%)
Place of birth - Born in state of residence (%) - White
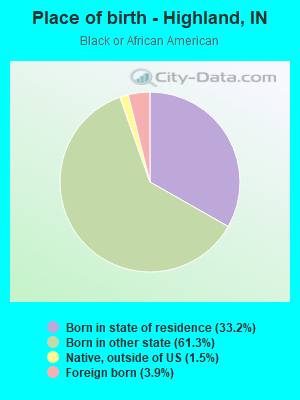
Place of birth - Born in state of residence (%) - Black or African American
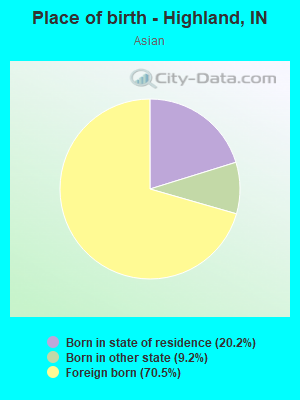
Place of birth - Born in state of residence (%) - Asian
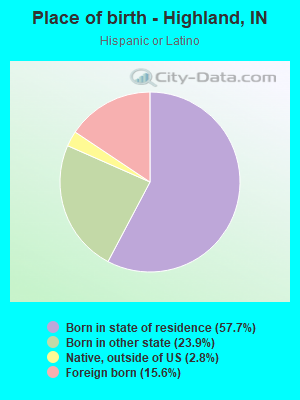
Place of birth - Born in state of residence (%) - Hispanic or Latino
Place of birth - Born in state of residence (%) - American Indian and Alaska Native
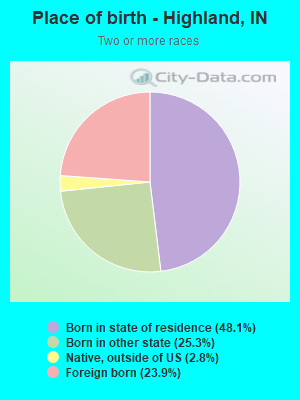
Place of birth - Born in state of residence (%) - Multirace
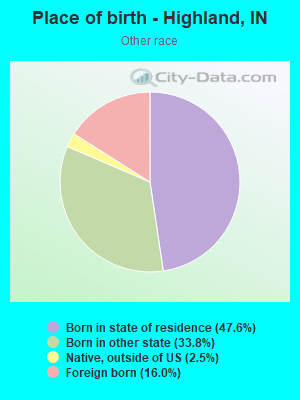
Place of birth - Born in state of residence (%) - Other Race
Place of birth - Born in other state (%)
Place of birth - Born in other state (%) - White
Place of birth - Born in other state (%) - Black or African American
Place of birth - Born in other state (%) - Asian
Place of birth - Born in other state (%) - Hispanic or Latino
Place of birth - Born in other state (%) - American Indian and Alaska Native
Place of birth - Born in other state (%) - Multirace
Place of birth - Born in other state (%) - Other Race
Place of birth - Native, outside of US (%)
Place of birth - Native, outside of US (%) - White
Place of birth - Native, outside of US (%) - Black or African American
Place of birth - Native, outside of US (%) - Asian
Place of birth - Native, outside of US (%) - Hispanic or Latino
Place of birth - Native, outside of US (%) - American Indian and Alaska Native
Place of birth - Native, outside of US (%) - Multirace
Place of birth - Native, outside of US (%) - Other Race
Place of birth - Foreign born (%)
Place of birth - Foreign born (%) - White
Place of birth - Foreign born (%) - Black or African American
Place of birth - Foreign born (%) - Asian
Place of birth - Foreign born (%) - Hispanic or Latino
Place of birth - Foreign born (%) - American Indian and Alaska Native
Place of birth - Foreign born (%) - Multirace
Place of birth - Foreign born (%) - Other Race
Residents speaking English at home (%)
Residents speaking English at home - Born in the United States (%)
Residents speaking English at home - Native, born elsewhere (%)
Residents speaking English at home - Foreign born (%)
Residents speaking Spanish at home (%)
Residents speaking Spanish at home - Born in the United States (%)
Residents speaking Spanish at home - Native, born elsewhere (%)
Residents speaking Spanish at home - Foreign born (%)
Residents speaking other language at home (%)
Residents speaking other language at home - Born in the United States (%)
Residents speaking other language at home - Native, born elsewhere (%)
Residents speaking other language at home - Foreign born (%)
Marital status - Never married (%)
Marital status - Now married (%)
Marital status - Separated (%)
Marital status - Widowed (%)
Marital status - Divorced (%)
Ancestries Reported - Arab (%)
Ancestries Reported - Czech (%)
Ancestries Reported - Danish (%)
Ancestries Reported - Dutch (%)
Ancestries Reported - English (%)
Ancestries Reported - French (%)
Ancestries Reported - French Canadian (%)
Ancestries Reported - German (%)
Ancestries Reported - Greek (%)
Ancestries Reported - Hungarian (%)
Ancestries Reported - Irish (%)
Ancestries Reported - Italian (%)
Ancestries Reported - Lithuanian (%)
Ancestries Reported - Norwegian (%)
Ancestries Reported - Polish (%)
Ancestries Reported - Portuguese (%)
Ancestries Reported - Russian (%)
Ancestries Reported - Scotch-Irish (%)
Ancestries Reported - Scottish (%)
Ancestries Reported - Slovak (%)
Ancestries Reported - Subsaharan African (%)
Ancestries Reported - Swedish (%)
Ancestries Reported - Swiss (%)
Ancestries Reported - Ukrainian (%)
Ancestries Reported - United States (%)
Ancestries Reported - Welsh (%)
Ancestries Reported - West Indian (%)
Ancestries Reported - Other (%)
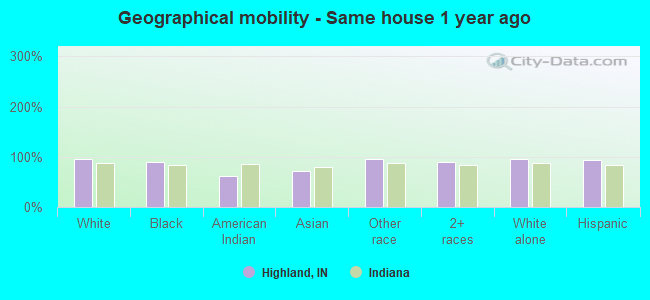
Geographical mobility - Same house 1 year ago (%)
Geographical mobility - Same house 1 year ago (%) - White
Geographical mobility - Same house 1 year ago (%) - Black or African American
Geographical mobility - Same house 1 year ago (%) - Asian
Geographical mobility - Same house 1 year ago (%) - Hispanic or Latino
Geographical mobility - Same house 1 year ago (%) - American Indian and Alaska Native
Geographical mobility - Same house 1 year ago (%) - Multirace
Geographical mobility - Same house 1 year ago (%) - Other Race
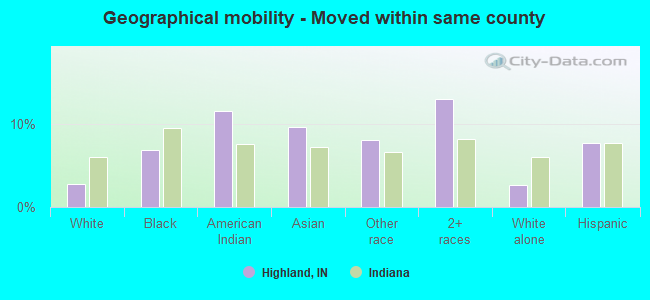
Geographical mobility - Moved within same county (%)
Geographical mobility - Moved within same county (%) - White
Geographical mobility - Moved within same county (%) - Black or African American
Geographical mobility - Moved within same county (%) - Asian
Geographical mobility - Moved within same county (%) - Hispanic or Latino
Geographical mobility - Moved within same county (%) - American Indian and Alaska Native
Geographical mobility - Moved within same county (%) - Multirace
Geographical mobility - Moved within same county (%) - Other Race
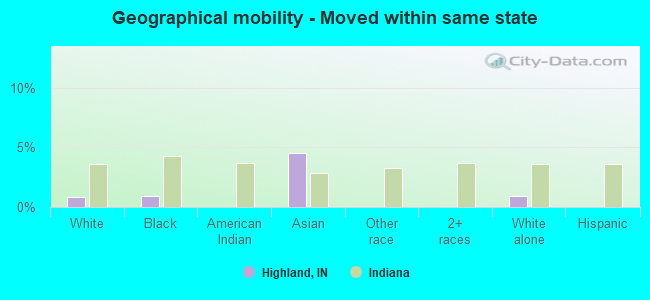
Geographical mobility - Moved from different county within same state (%)
Geographical mobility - Moved from different county within same state (%) - White
Geographical mobility - Moved from different county within same state (%) - Black or African American
Geographical mobility - Moved from different county within same state (%) - Asian
Geographical mobility - Moved from different county within same state (%) - Hispanic or Latino
Geographical mobility - Moved from different county within same state (%) - American Indian and Alaska Native
Geographical mobility - Moved from different county within same state (%) - Multirace
Geographical mobility - Moved from different county within same state (%) - Other Race
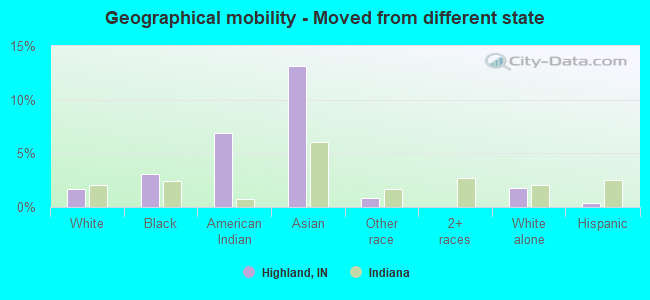
Geographical mobility - Moved from different state (%)
Geographical mobility - Moved from different state (%) - White
Geographical mobility - Moved from different state (%) - Black or African American
Geographical mobility - Moved from different state (%) - Asian
Geographical mobility - Moved from different state (%) - Hispanic or Latino
Geographical mobility - Moved from different state (%) - American Indian and Alaska Native
Geographical mobility - Moved from different state (%) - Multirace
Geographical mobility - Moved from different state (%) - Other Race
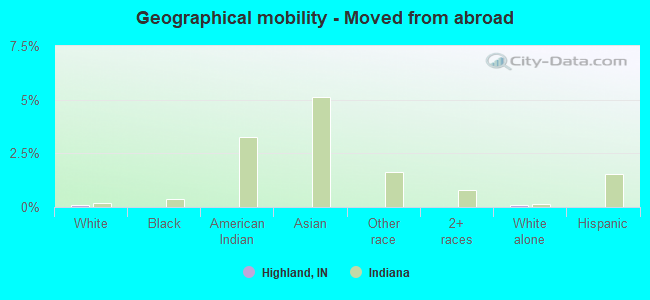
Geographical mobility - Moved from abroad (%)
Geographical mobility - Moved from abroad (%) - White
Geographical mobility - Moved from abroad (%) - Black or African American
Geographical mobility - Moved from abroad (%) - Asian
Geographical mobility - Moved from abroad (%) - Hispanic or Latino
Geographical mobility - Moved from abroad (%) - American Indian and Alaska Native
Geographical mobility - Moved from abroad (%) - Multirace
Geographical mobility - Moved from abroad (%) - Other Race
Place of birth for the foreign-born population - Ireland (%)
Place of birth for the foreign-born population - Denmark (%)
Place of birth for the foreign-born population - Norway (%)
Place of birth for the foreign-born population - Sweden (%)
Place of birth for the foreign-born population - United Kingdom (%)
Place of birth for the foreign-born population - England (%)
Place of birth for the foreign-born population - Scotland (%)
Place of birth for the foreign-born population - Other Northern Europe (%)
Place of birth for the foreign-born population - Austria (%)
Place of birth for the foreign-born population - Belgium (%)
Place of birth for the foreign-born population - France (%)
Place of birth for the foreign-born population - Germany (%)
Place of birth for the foreign-born population - Netherlands (%)
Place of birth for the foreign-born population - Switzerland (%)
Place of birth for the foreign-born population - Other Western Europe (%)
Place of birth for the foreign-born population - Greece (%)
Place of birth for the foreign-born population - Italy (%)
Place of birth for the foreign-born population - Portugal (%)
Place of birth for the foreign-born population - Spain (%)
Place of birth for the foreign-born population - Other Southern Europe (%)
Place of birth for the foreign-born population - Albania (%)
Place of birth for the foreign-born population - Belarus (%)
Place of birth for the foreign-born population - Bosnia and Herzegovina (%)
Place of birth for the foreign-born population - Bulgaria (%)
Place of birth for the foreign-born population - Croatia (%)
Place of birth for the foreign-born population - Czechoslovakia (%)
Place of birth for the foreign-born population - Hungary (%)
Place of birth for the foreign-born population - Latvia (%)
Place of birth for the foreign-born population - Lithuania (%)
Place of birth for the foreign-born population - North Macedonia (Macedonia) (%)
Place of birth for the foreign-born population - Moldova (%)
Place of birth for the foreign-born population - Poland (%)
Place of birth for the foreign-born population - Romania (%)
Place of birth for the foreign-born population - Russia (%)
Place of birth for the foreign-born population - Serbia (%)
Place of birth for the foreign-born population - Ukraine (%)
Place of birth for the foreign-born population - Other Eastern Europe (%)
Place of birth for the foreign-born population - China (%)
Place of birth for the foreign-born population - Hong Kong (%)
Place of birth for the foreign-born population - Taiwan (%)
Place of birth for the foreign-born population - Japan (%)
Place of birth for the foreign-born population - Korea (%)
Place of birth for the foreign-born population - Other Eastern Asia (%)
Place of birth for the foreign-born population - Afghanistan (%)
Place of birth for the foreign-born population - Bangladesh (%)
Place of birth for the foreign-born population - India (%)
Place of birth for the foreign-born population - Iran (%)
Place of birth for the foreign-born population - Kazakhstan (%)
Place of birth for the foreign-born population - Nepal (%)
Place of birth for the foreign-born population - Pakistan (%)
Place of birth for the foreign-born population - Sri Lanka (%)
Place of birth for the foreign-born population - Uzbekistan (%)
Place of birth for the foreign-born population - Other South Central Asia (%)
Place of birth for the foreign-born population - Burma (%)
Place of birth for the foreign-born population - Cambodia (%)
Place of birth for the foreign-born population - Indonesia (%)
Place of birth for the foreign-born population - Laos (%)
Place of birth for the foreign-born population - Malaysia (%)
Place of birth for the foreign-born population - Philippines (%)
Place of birth for the foreign-born population - Singapore (%)
Place of birth for the foreign-born population - Thailand (%)
Place of birth for the foreign-born population - Vietnam (%)
Place of birth for the foreign-born population - Other South Eastern Asia (%)
Place of birth for the foreign-born population - Armenia (%)
Place of birth for the foreign-born population - Iraq (%)
Place of birth for the foreign-born population - Israel (%)
Place of birth for the foreign-born population - Jordan (%)
Place of birth for the foreign-born population - Kuwait (%)
Place of birth for the foreign-born population - Lebanon (%)
Place of birth for the foreign-born population - Saudi Arabia (%)
Place of birth for the foreign-born population - Syria (%)
Place of birth for the foreign-born population - Turkey (%)
Place of birth for the foreign-born population - Yemen (%)
Place of birth for the foreign-born population - Other Western Asia (%)
Place of birth for the foreign-born population - Eritrea (%)
Place of birth for the foreign-born population - Ethiopia (%)
Place of birth for the foreign-born population - Kenya (%)
Place of birth for the foreign-born population - Somalia (%)
Place of birth for the foreign-born population - Uganda (%)
Place of birth for the foreign-born population - Zimbabwe (%)
Place of birth for the foreign-born population - Other Eastern Africa (%)
Place of birth for the foreign-born population - Cameroon (%)
Place of birth for the foreign-born population - Congo (%)
Place of birth for the foreign-born population - Democratic Republic of Congo (Zaire) (%)
Place of birth for the foreign-born population - Other Middle Africa (%)
Place of birth for the foreign-born population - Egypt (%)
Place of birth for the foreign-born population - Morocco (%)
Place of birth for the foreign-born population - Sudan (%)
Place of birth for the foreign-born population - Other Northern Africa (%)
Place of birth for the foreign-born population - South Africa (%)
Place of birth for the foreign-born population - Other Southern Africa (%)
Place of birth for the foreign-born population - Cabo Verde (%)
Place of birth for the foreign-born population - Ghana (%)
Place of birth for the foreign-born population - Liberia (%)
Place of birth for the foreign-born population - Nigeria (%)
Place of birth for the foreign-born population - Senegal (%)
Place of birth for the foreign-born population - Sierra Leone (%)
Place of birth for the foreign-born population - Other Western Africa (%)
Place of birth for the foreign-born population - Australia (%)
Place of birth for the foreign-born population - New Zealand (%)
Place of birth for the foreign-born population - Fiji (%)
Place of birth for the foreign-born population - Micronesia (%)
Place of birth for the foreign-born population - Bahamas (%)
Place of birth for the foreign-born population - Barbados (%)
Place of birth for the foreign-born population - Cuba (%)
Place of birth for the foreign-born population - Dominica (%)
Place of birth for the foreign-born population - Dominican Republic (%)
Place of birth for the foreign-born population - Grenada (%)
Place of birth for the foreign-born population - Haiti (%)
Place of birth for the foreign-born population - Jamaica (%)
Place of birth for the foreign-born population - St. Vincent and the Grenadines (%)
Place of birth for the foreign-born population - Trinidad and Tobago (%)
Place of birth for the foreign-born population - West Indies (%)
Place of birth for the foreign-born population - Other Caribbean (%)
Place of birth for the foreign-born population - Belize (%)
Place of birth for the foreign-born population - Costa Rica (%)
Place of birth for the foreign-born population - El Salvador (%)
Place of birth for the foreign-born population - Guatemala (%)
Place of birth for the foreign-born population - Honduras (%)
Place of birth for the foreign-born population - Mexico (%)
Place of birth for the foreign-born population - Nicaragua (%)
Place of birth for the foreign-born population - Panama (%)
Place of birth for the foreign-born population - Other Central America (%)
Place of birth for the foreign-born population - Argentina (%)
Place of birth for the foreign-born population - Bolivia (%)
Place of birth for the foreign-born population - Brazil (%)
Place of birth for the foreign-born population - Chile (%)
Place of birth for the foreign-born population - Colombia (%)
Place of birth for the foreign-born population - Ecuador (%)
Place of birth for the foreign-born population - Guyana (%)
Place of birth for the foreign-born population - Peru (%)
Place of birth for the foreign-born population - Uruguay (%)
Place of birth for the foreign-born population - Venezuela (%)
Place of birth for the foreign-born population - Other South America (%)
Place of birth for the foreign-born population - Canada (%)
Place of birth for the foreign-born population - Other Northern America (%)
Place of birth for the foreign-born population - Other (%)
Latest news about races in Highland, IN collected exclusively by city-data.com from local newspapers, TV, and radio stations
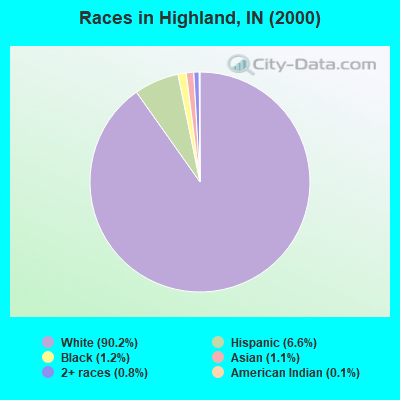
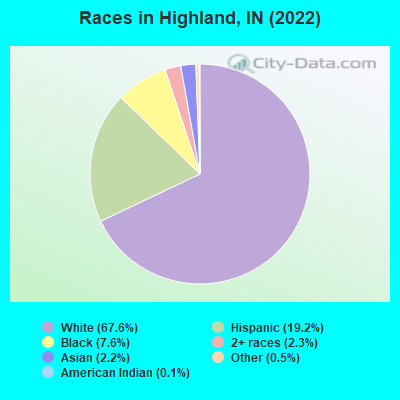
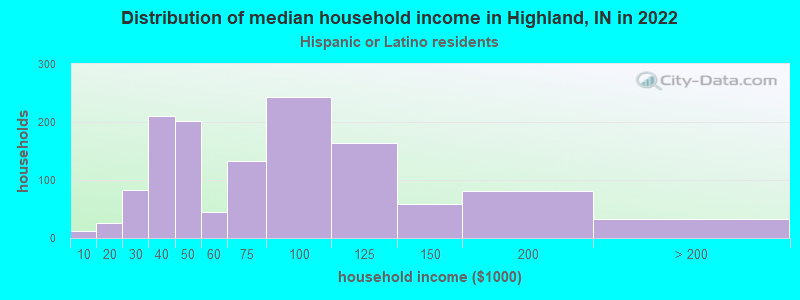
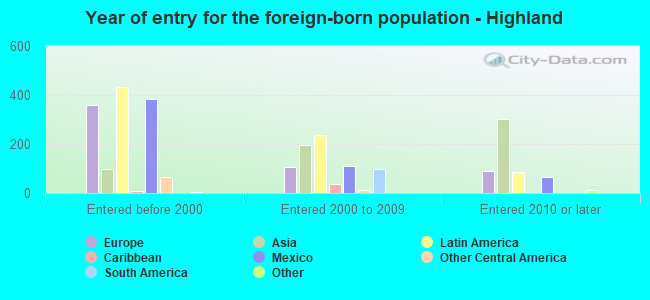
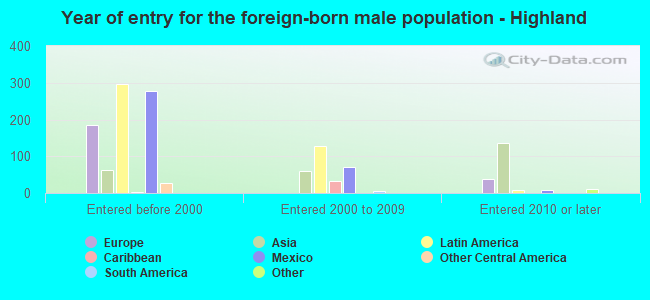
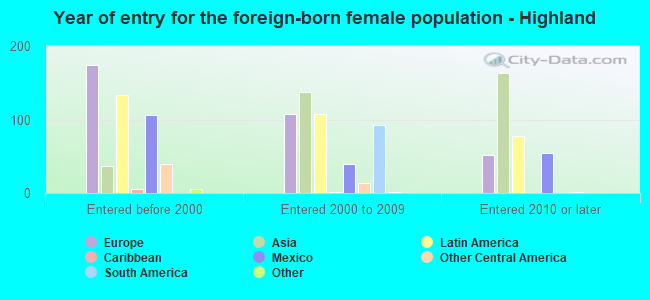
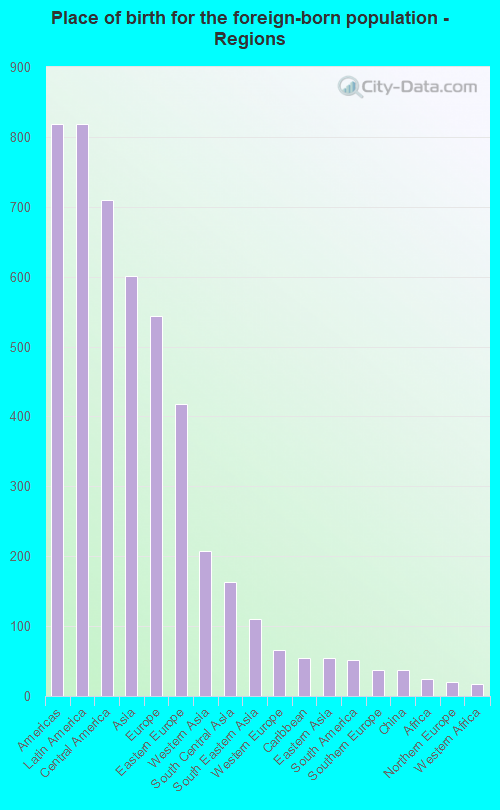
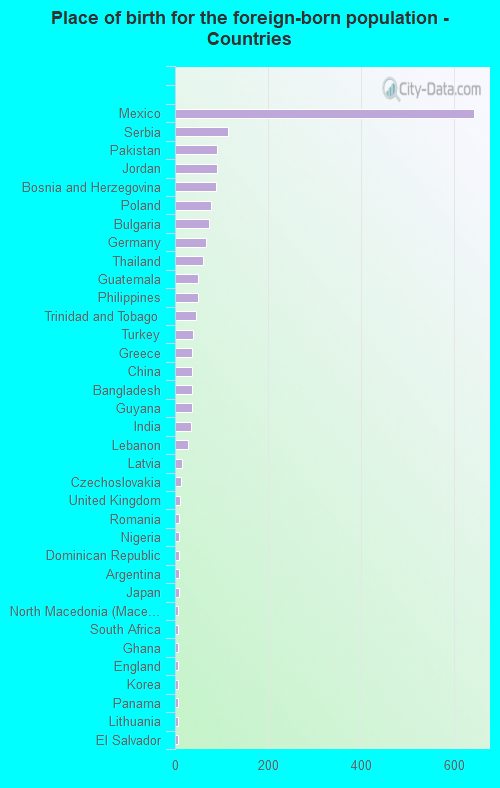
According to 2022 data, the most numerous races in Highland, IN are White alone (16,142 residents), Black alone (1,805 residents), and Hispanic (4,585 residents). 84.1% of Highland residents speak English at home. 8.3% of Highland, IN residents are foreign-born (3.1% born in Latin America, 2.3% born in Asia, 2.1% born in Europe), which is 27.9% greater than the foreign-born rate of 6.0% across the entire state of Indiana.
Race distribution in Highland
2000 2022
5,219,373 85.8% White alone 505,462 8.3% Black alone 214,536 3.5% Hispanic 61,115 1.0% Two or more races 58,424 1.0% Asian alone 13,654 0.2% American Indian alone 6,348 0.1% Other race alone 1,573 0.03% Native Hawaiian and Other
5,192,455 76.0% White alone 628,054 9.2% Black alone 534,528 7.8% Hispanic 263,242 3.9% Two or more races 172,880 2.5% Asian alone 33,467 0.5% Other race alone 5,866 0.09% American Indian alone 2,545 0.04% Native Hawaiian and Other
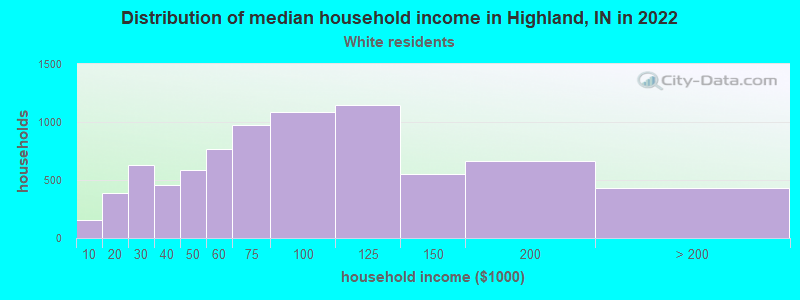
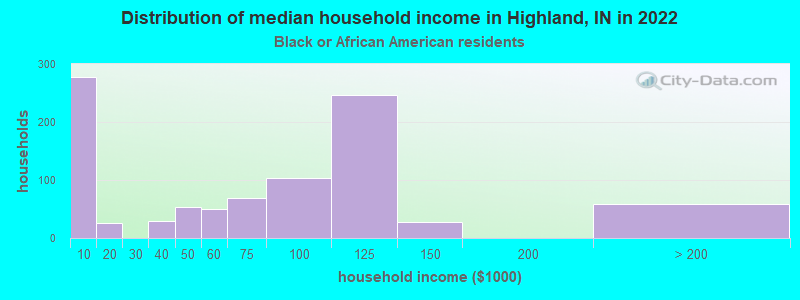
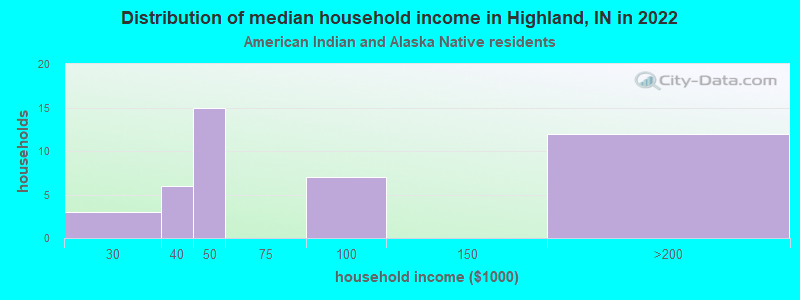
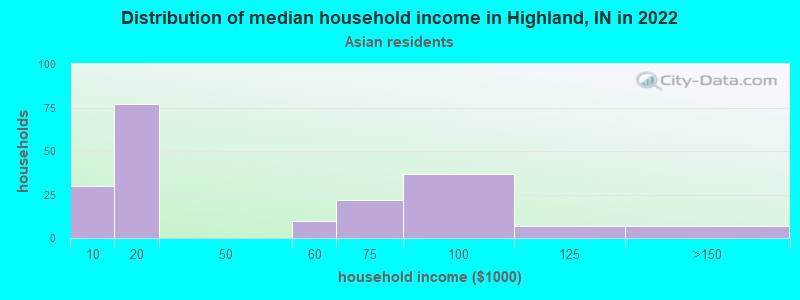
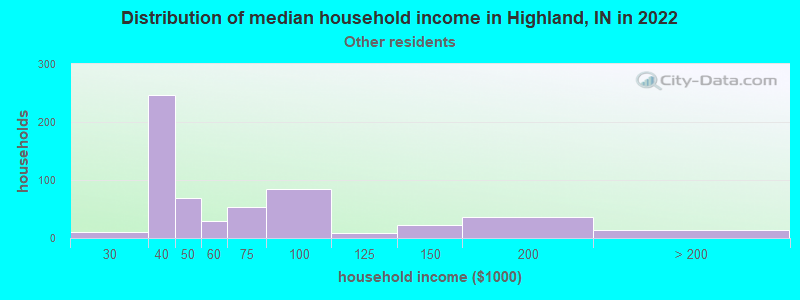
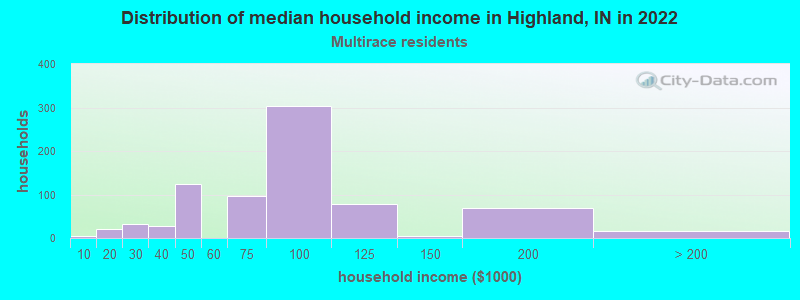
Income and house value in Highland Median household income in 2022 $72,946 White non-Hispanic householders$66,895 Black householders$29,645 American Indian and Alaska Native householders$62,473 Some other race householders$85,467 Two or more races householders$70,516 Hispanic or Latino race householdersMedian 2022 house value $228,387 White Non-Hispanic householders$245,898 Black or African American householders $296,940 Asian householders$214,043 Some other race householders$187,590 Two or more races householders$249,624 Hispanic or Latino householders
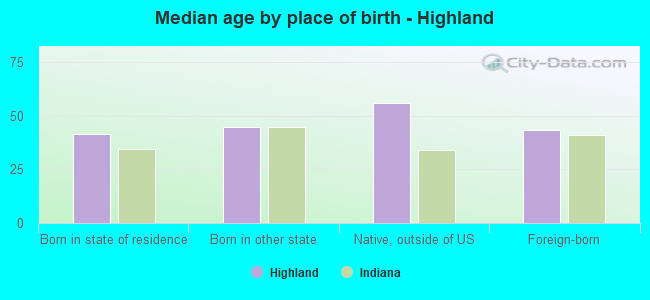
Median age by race in Highland
48.9 Median age for White residents47.3 51.4 28.8 Median age for Black or African American residents18.6 29.5 38.4 Median age for American Indian / Alaska Native residents28.0 45.9 31.1 Median age for Asian residents36.7 28.3 -664,335,663.7 Median age for Native Hawaiian / Pacific Islander residents-644,025,156.6 -664,437,011.6 38.0 Median age for Other race residents36.9 37.2 28.9 Median age for Two or more races residents22.3 30.3 50.4 Median age for White alone residents48.2 52.8 28.6 Median age for Hispanic or Latino residents27.7 30.0
Owner/renter occupied households by race in Highland
House owners and renters - White residents 6,704 85.4% Owner occupied1,148 14.6% Renter occupiedHouse owners and renters - Black or African American residents 284 35.2% Owner occupied522 64.8% Renter occupiedHouse owners and renters - American Indian / Alaska Native residents 14 54.3% Owner occupied12 45.7% Renter occupiedHouse owners and renters - Asian residents 123 62.0% Owner occupied75 38.0% Renter occupiedHouse owners and renters - Other race residents 300 61.8% Owner occupied185 38.2% Renter occupiedHouse owners and renters - Two or more races residents 586 77.0% Owner occupied175 23.0% Renter occupiedHouse owners and renters - White alone residents 6,543 85.3% Owner occupied1,132 14.7% Renter occupiedHouse owners and renters - Hispanic or Latino residents 953 73.5% Owner occupied344 26.5% Renter occupied
Language usage in Highland
English speakers - Total 84.1% of residents of Highland speak English at home.
8.9% of residents speak Spanish at home 1,535 76.7% Speak English very well467 23.3% Speak English less than very well7.4% of residents speak other language at home 1,061 64.0% Speak English very well598 36.0% Speak English less than very well
English speakers - Born in the United States 89.2% of residents of Highland speak English at home.
8.7% of residents speak Spanish at home 566 89.0% Speak English very well70 11.0% Speak English less than very well1.8% of residents speak other language at home 97 75.2% Speak English very well32 24.8% Speak English less than very well
English speakers - Native, born elsewhere 13.3% of residents of Highland speak English at home.
62.8% of residents speak Spanish at home 81 59.1% Speak English very well56 40.9% Speak English less than very well25.7% of residents speak other language at home 23 41.1% Speak English very well33 58.9% Speak English less than very well
English speakers - Foreign-born 19.3% of residents of Highland speak English at home.
27.7% of residents speak Spanish at home 261 48.9% Speak English very well273 51.1% Speak English less than very well55.4% of residents speak other language at home 642 60.1% Speak English very well426 39.9% Speak English less than very well
White (Caucasian) - Speak only English Native:
95.4% (14,782)Foreign-born:
7.6% (53)
White (Caucasian) - Speak another language Native:
4.6% (718)Foreign-born:
95.0% (664)
Black or African American - Speak only English Native:
99.2% (1,700)Foreign-born:
91.1% (77)
Black or African American - Speak another language Native:
0.6% (9)Foreign-born:
24.4% (21)
American Indian / Alaska Native - Speak another language Native:
23.4% (18)Foreign-born:
100.0% (3)
Asian - Speak only English Native:
74.1% (65)Foreign-born:
20.7% (76)
Asian - Speak another language Native:
25.9% (23)Foreign-born:
78.2% (286)
Other race - Speak only English Native:
50.7% (510)Foreign-born:
72.8% (158)
Other race - Speak another language Native:
48.2% (485)Foreign-born:
41.4% (90)
Two or more races - Speak only English Native:
62.2% (1,160)Foreign-born:
8.6% (58)
Two or more races - Speak another language Native:
39.2% (732)Foreign-born:
91.3% (610)
White alone - Speak only English Native:
95.8% (14,197)Foreign-born:
6.7% (51)
White alone - Speak another language Native:
4.3% (630)Foreign-born:
100.0% (764)
Hispanic or Latino - Speak only English Native:
60.4% (1,954)Foreign-born:
25.1% (180)
Hispanic or Latino - Speak another language Native:
39.3% (1,270)Foreign-born:
75.1% (540)
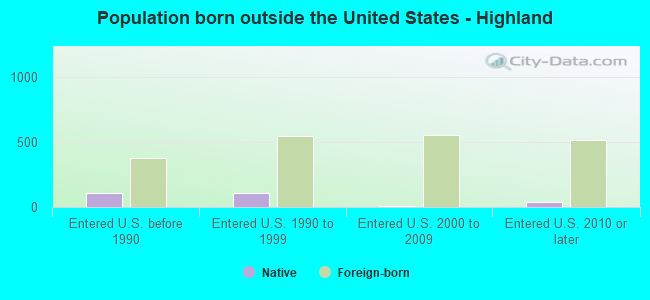
Foreign-born residents in Highland 1,989 residents are foreign born (3.1% Latin America , 2.3% Asia , 2.1% Europe ).
This city:
8.3%Indiana:
5.6%
Marital status for residents in Highland Marital status - White (Caucasian) population 15 years and over
Males 28.2% Never married52.8% Now married0.7% Separated5.2% Widowed13.2% DivorcedFemales 25.8% Never married48.3% Now married1.1% Separated12.2% Widowed12.6% DivorcedWomen who gave birth in the past 12 months Now married:
69.6% (253)Unmarried:
30.4% (110)
Women who did not give birth in the past 12 months Now married:
42.4% (1,229)Unmarried:
57.6% (1,669)
Marital status - Black or African American population 15 years and over
Males 63.7% Never married23.6% Now married0.0% Separated0.0% Widowed12.7% DivorcedFemales 61.6% Never married14.6% Now married3.3% Separated2.2% Widowed18.3% DivorcedWomen who gave birth in the past 12 months Now married:
0.0% (0)Unmarried:
100.0% (22)
Women who did not give birth in the past 12 months Now married:
17.4% (116)Unmarried:
82.6% (553)
Marital status - American Indian / Alaska Native population 15 years and over
Males 37.5% Never married62.5% Now married0.0% Separated0.0% Widowed0.0% DivorcedFemales 0.0% Never married2.9% Now married0.0% Separated0.0% Widowed97.1% DivorcedWomen who did not give birth in the past 12 months Now married:
10.0% (2)Unmarried:
90.0% (21)
Marital status - Asian population 15 years and over
Males 27.2% Never married56.2% Now married0.0% Separated0.0% Widowed16.7% DivorcedFemales 38.4% Never married49.7% Now married0.0% Separated7.0% Widowed4.9% DivorcedWomen who did not give birth in the past 12 months Now married:
52.1% (91)Unmarried:
47.9% (83)
Marital status - Other race population 15 years and over
Males 37.2% Never married50.2% Now married0.0% Separated1.3% Widowed11.3% DivorcedFemales 36.3% Never married38.1% Now married0.0% Separated7.7% Widowed17.9% DivorcedWomen who did not give birth in the past 12 months Now married:
32.8% (107)Unmarried:
67.2% (219)
Marital status - Two or more races population 15 years and over
Males 50.8% Never married37.9% Now married0.0% Separated0.0% Widowed11.3% DivorcedFemales 44.2% Never married45.0% Now married0.0% Separated1.7% Widowed9.1% DivorcedWomen who gave birth in the past 12 months Now married:
56.5% (39)Unmarried:
43.5% (30)
Women who did not give birth in the past 12 months Now married:
37.7% (285)Unmarried:
62.3% (472)
Marital status - White alone, not Hispanic / Latino population 15 years and over
Males 27.4% Never married53.1% Now married0.8% Separated5.5% Widowed13.2% DivorcedFemales 24.5% Never married48.1% Now married1.2% Separated12.8% Widowed13.3% DivorcedWomen who gave birth in the past 12 months Now married:
74.7% (208)Unmarried:
25.3% (71)
Women who did not give birth in the past 12 months Now married:
43.3% (1,168)Unmarried:
56.7% (1,528)
Marital status - Hispanic or Latino population 15 years and over
Males 41.2% Never married47.5% Now married0.0% Separated0.5% Widowed10.8% DivorcedFemales 42.9% Never married43.9% Now married0.0% Separated4.0% Widowed9.3% DivorcedWomen who gave birth in the past 12 months Now married:
52.9% (77)Unmarried:
47.1% (68)
Women who did not give birth in the past 12 months Now married:
34.5% (390)Unmarried:
65.5% (740)
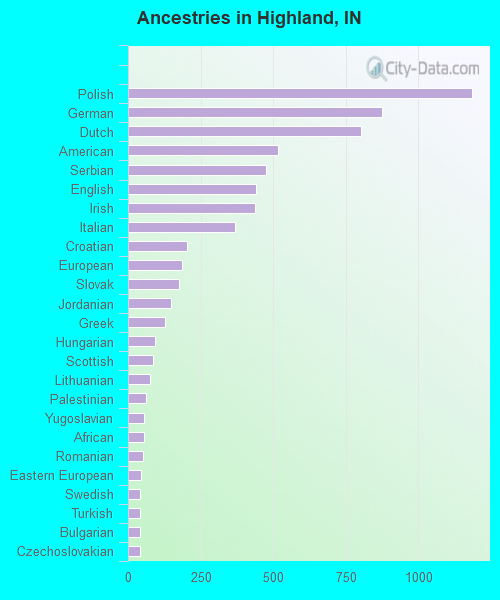
Ancestries in Highland
1,185 10.7% Polish877 7.9% German802 7.2% Dutch518 4.7% American477 4.3% Serbian440 4.0% English437 3.9% Irish370 3.3% Italian205 1.8% Croatian186 1.7% European175 1.6% Slovak148 1.3% Jordanian126 1.1% Greek93 0.8% Hungarian86 0.8% Scottish75 0.7% Lithuanian62 0.6% Palestinian54 0.5% Yugoslavian54 0.5% African53 0.5% Romanian44 0.4% Eastern European42 0.4% Swedish42 0.4% Turkish40 0.4% Bulgarian40 0.4% Czechoslovakian38 0.3% French34 0.3% Latvian28 0.3% Norwegian27 0.2% Nigerian14 0.1% Macedonian14 0.1% Portuguese13 0.1% British12 0.1% Scotch-Irish12 0.1% Lebanese11 0.10% South African10 0.09% Danish10 0.09% Ukrainian9 0.08% Ghanaian9 0.08% French Canadian7 0.06% Scandinavian6 0.05% Austrian6 0.05% Czech4 0.04% Slavic1 0.01% Brazilian1 0.01% Canadian
Geographical mobility in Highland Same house 1 year ago 15,835 95.1% White (Caucasian)1,797 88.9% Black or African American58 62.3% American Indian / Alaska Native384 72.7% Asian1,281 95.9% Other race2,370 89.8% Two or more races15,177 94.8% White alone, not Hispanic / Latino4,184 94.0% Hispanic or LatinoMoved within same county 456 2.7% White / Caucasian138 6.8% Black or African American11 11.6% American Indian / Alaska Native51 9.7% Asian108 8.1% Other race345 13.1% Two or more races434 2.7% White alone, not Hispanic / Latino347 7.8% Hispanic or LatinoMoved within same state 146 0.9% White / Caucasian19 0.9% Black or African American24 4.6% Asian149 0.9% White alone, not Hispanic / LatinoMoved from different state 282 1.7% White / Caucasian62 3.1% Black or African American6 6.8% American Indian / Alaska Native70 13.1% Asian11 0.8% Other race286 1.8% White alone, not Hispanic / Latino17 0.4% Hispanic or LatinoMoved from abroad 12 0.1% White12 0.1% White alone, not Hispanic / Latino
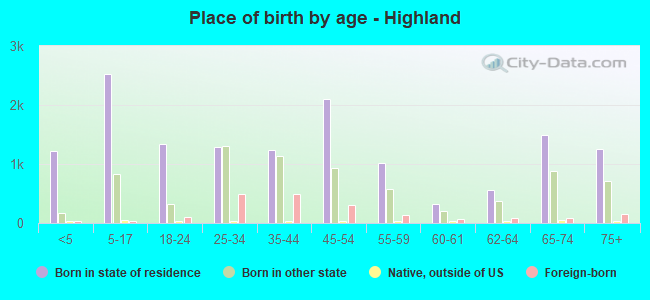
Children Nativity (place of birth) in Highland
Children under 6 years - Living with two parents Both parents native 692 100.0% NativeBoth parents foreign-born 174 100.0% NativeOne native, one foreign-born parent 178 100.0% NativeChildren under 6 years - Living with one parent Native parent 475 100.0% NativeChildren 6 to 17 years - Living with two parents Both parents native 1,056 100.0% Native0 0.0% Foreign-bornBoth parents foreign-born 166 99.5% Native1 0.5% Foreign-bornOne native, one foreign-born parent 345 100.0% NativeChildren 6 to 17 years - Living with one parent Native parent 1,230 100.0% NativeForeign-born parent 173 47.7% Native190 52.3% Foreign-born
Grandparents responsible for own grandchildren in Highland
Grandparents (30 to 59 years) White / Caucasian 151 60.1% Responsible for grandchildren100 39.9% Not responsible for grandchildrenWhite alone, not Hispanic / Latino 155 62.5% Responsible for grandchildren93 37.5% Not responsible for grandchildrenHispanic or Latino 17 100.0% Not responsible for grandchildrenGrandparents (60 years and over) White / Caucasian 45 12.5% Responsible for grandchildren313 87.5% Not responsible for grandchildrenWhite alone, not Hispanic / Latino 48 13.6% Responsible for grandchildren306 86.4% Not responsible for grandchildrenHispanic or Latino 9 100.0% Not responsible for grandchildren