Races in Highland Village, Texas (TX) Detailed Stats
Data:
Races - White alone (%)
Races - White alone (% change since 2000)
Races - Black alone (%)
Races - Black alone (% change since 2000)
Races - American Indian alone (%)
Races - American Indian alone (% change since 2000)
Races - Asian alone (%)
Races - Asian alone (% change since 2000)
Races - Hispanic (%)
Races - Hispanic (% change since 2000)
Races - Native Hawaiian and Other Pacific Islander alone (%)
Races - Native Hawaiian and Other Pacific Islander alone (% change since 2000)
Races - Two or more races(%)
Races - Two or more races(% change since 2000)
Races - Other race alone (%)
Races - Other race alone (% change since 2000)
Racial diversity
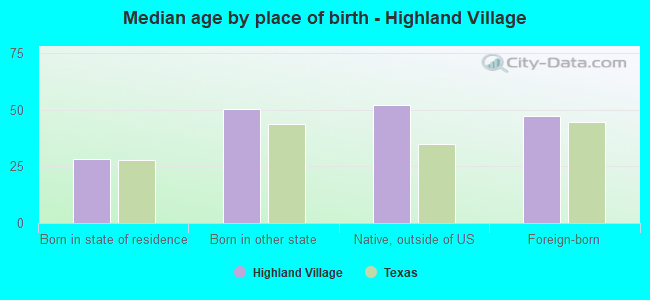
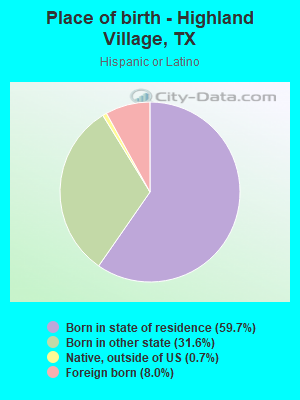
Place of birth - Born in state of residence (%)
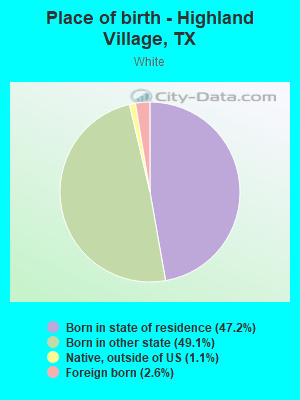
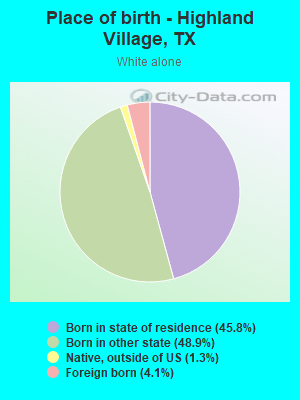
Place of birth - Born in state of residence (%) - White
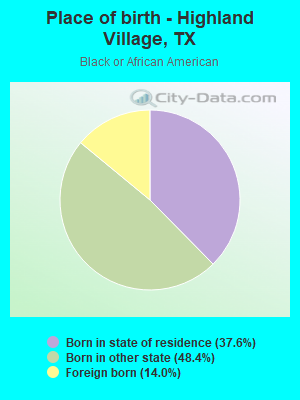
Place of birth - Born in state of residence (%) - Black or African American
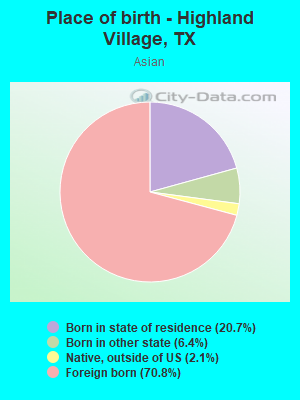
Place of birth - Born in state of residence (%) - Asian
Place of birth - Born in state of residence (%) - Hispanic or Latino
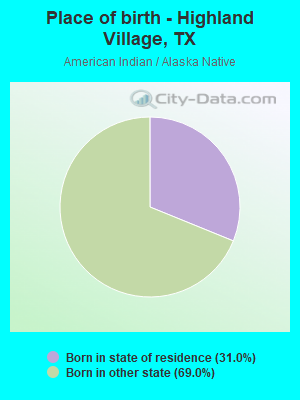
Place of birth - Born in state of residence (%) - American Indian and Alaska Native
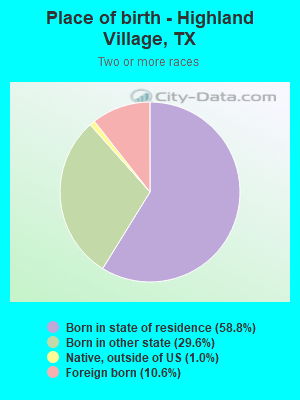
Place of birth - Born in state of residence (%) - Multirace
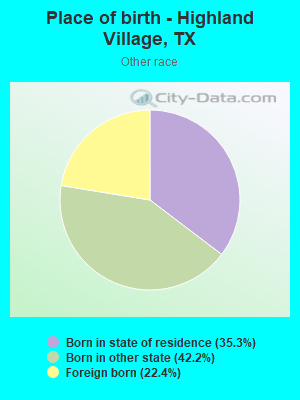
Place of birth - Born in state of residence (%) - Other Race
Place of birth - Born in other state (%)
Place of birth - Born in other state (%) - White
Place of birth - Born in other state (%) - Black or African American
Place of birth - Born in other state (%) - Asian
Place of birth - Born in other state (%) - Hispanic or Latino
Place of birth - Born in other state (%) - American Indian and Alaska Native
Place of birth - Born in other state (%) - Multirace
Place of birth - Born in other state (%) - Other Race
Place of birth - Native, outside of US (%)
Place of birth - Native, outside of US (%) - White
Place of birth - Native, outside of US (%) - Black or African American
Place of birth - Native, outside of US (%) - Asian
Place of birth - Native, outside of US (%) - Hispanic or Latino
Place of birth - Native, outside of US (%) - American Indian and Alaska Native
Place of birth - Native, outside of US (%) - Multirace
Place of birth - Native, outside of US (%) - Other Race
Place of birth - Foreign born (%)
Place of birth - Foreign born (%) - White
Place of birth - Foreign born (%) - Black or African American
Place of birth - Foreign born (%) - Asian
Place of birth - Foreign born (%) - Hispanic or Latino
Place of birth - Foreign born (%) - American Indian and Alaska Native
Place of birth - Foreign born (%) - Multirace
Place of birth - Foreign born (%) - Other Race
Residents speaking English at home (%)
Residents speaking English at home - Born in the United States (%)
Residents speaking English at home - Native, born elsewhere (%)
Residents speaking English at home - Foreign born (%)
Residents speaking Spanish at home (%)
Residents speaking Spanish at home - Born in the United States (%)
Residents speaking Spanish at home - Native, born elsewhere (%)
Residents speaking Spanish at home - Foreign born (%)
Residents speaking other language at home (%)
Residents speaking other language at home - Born in the United States (%)
Residents speaking other language at home - Native, born elsewhere (%)
Residents speaking other language at home - Foreign born (%)
Marital status - Never married (%)
Marital status - Now married (%)
Marital status - Separated (%)
Marital status - Widowed (%)
Marital status - Divorced (%)
Ancestries Reported - Arab (%)
Ancestries Reported - Czech (%)
Ancestries Reported - Danish (%)
Ancestries Reported - Dutch (%)
Ancestries Reported - English (%)
Ancestries Reported - French (%)
Ancestries Reported - French Canadian (%)
Ancestries Reported - German (%)
Ancestries Reported - Greek (%)
Ancestries Reported - Hungarian (%)
Ancestries Reported - Irish (%)
Ancestries Reported - Italian (%)
Ancestries Reported - Lithuanian (%)
Ancestries Reported - Norwegian (%)
Ancestries Reported - Polish (%)
Ancestries Reported - Portuguese (%)
Ancestries Reported - Russian (%)
Ancestries Reported - Scotch-Irish (%)
Ancestries Reported - Scottish (%)
Ancestries Reported - Slovak (%)
Ancestries Reported - Subsaharan African (%)
Ancestries Reported - Swedish (%)
Ancestries Reported - Swiss (%)
Ancestries Reported - Ukrainian (%)
Ancestries Reported - United States (%)
Ancestries Reported - Welsh (%)
Ancestries Reported - West Indian (%)
Ancestries Reported - Other (%)
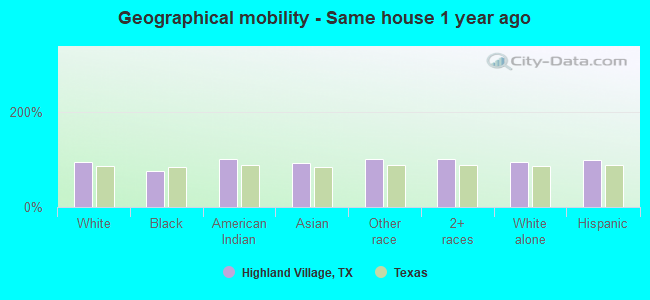
Geographical mobility - Same house 1 year ago (%)
Geographical mobility - Same house 1 year ago (%) - White
Geographical mobility - Same house 1 year ago (%) - Black or African American
Geographical mobility - Same house 1 year ago (%) - Asian
Geographical mobility - Same house 1 year ago (%) - Hispanic or Latino
Geographical mobility - Same house 1 year ago (%) - American Indian and Alaska Native
Geographical mobility - Same house 1 year ago (%) - Multirace
Geographical mobility - Same house 1 year ago (%) - Other Race
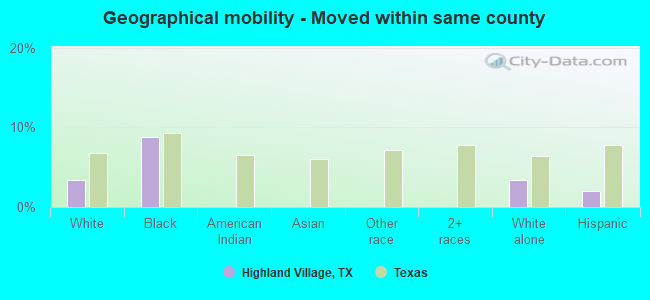
Geographical mobility - Moved within same county (%)
Geographical mobility - Moved within same county (%) - White
Geographical mobility - Moved within same county (%) - Black or African American
Geographical mobility - Moved within same county (%) - Asian
Geographical mobility - Moved within same county (%) - Hispanic or Latino
Geographical mobility - Moved within same county (%) - American Indian and Alaska Native
Geographical mobility - Moved within same county (%) - Multirace
Geographical mobility - Moved within same county (%) - Other Race
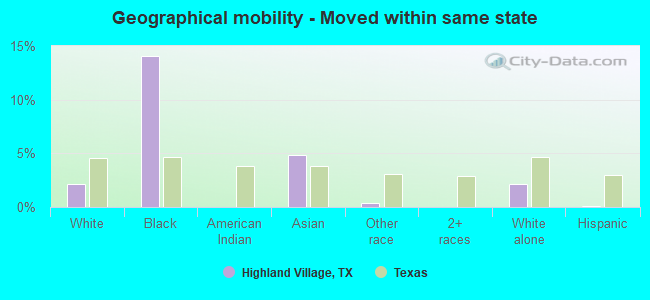
Geographical mobility - Moved from different county within same state (%)
Geographical mobility - Moved from different county within same state (%) - White
Geographical mobility - Moved from different county within same state (%) - Black or African American
Geographical mobility - Moved from different county within same state (%) - Asian
Geographical mobility - Moved from different county within same state (%) - Hispanic or Latino
Geographical mobility - Moved from different county within same state (%) - American Indian and Alaska Native
Geographical mobility - Moved from different county within same state (%) - Multirace
Geographical mobility - Moved from different county within same state (%) - Other Race
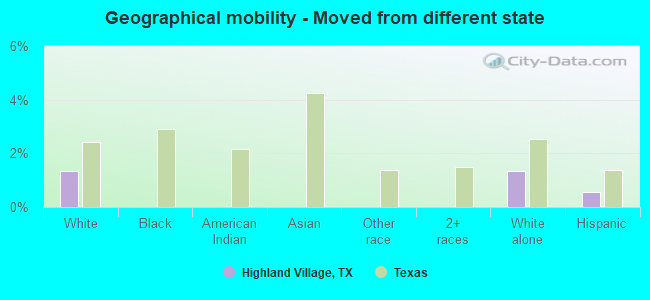
Geographical mobility - Moved from different state (%)
Geographical mobility - Moved from different state (%) - White
Geographical mobility - Moved from different state (%) - Black or African American
Geographical mobility - Moved from different state (%) - Asian
Geographical mobility - Moved from different state (%) - Hispanic or Latino
Geographical mobility - Moved from different state (%) - American Indian and Alaska Native
Geographical mobility - Moved from different state (%) - Multirace
Geographical mobility - Moved from different state (%) - Other Race
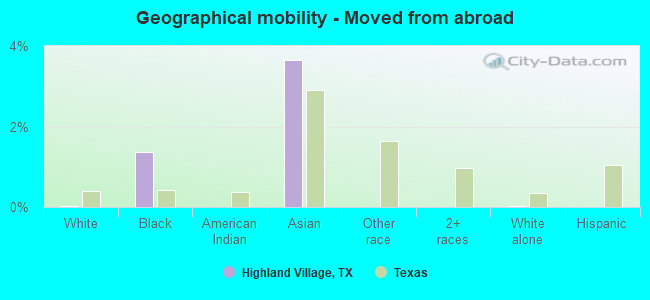
Geographical mobility - Moved from abroad (%)
Geographical mobility - Moved from abroad (%) - White
Geographical mobility - Moved from abroad (%) - Black or African American
Geographical mobility - Moved from abroad (%) - Asian
Geographical mobility - Moved from abroad (%) - Hispanic or Latino
Geographical mobility - Moved from abroad (%) - American Indian and Alaska Native
Geographical mobility - Moved from abroad (%) - Multirace
Geographical mobility - Moved from abroad (%) - Other Race
Place of birth for the foreign-born population - Ireland (%)
Place of birth for the foreign-born population - Denmark (%)
Place of birth for the foreign-born population - Norway (%)
Place of birth for the foreign-born population - Sweden (%)
Place of birth for the foreign-born population - United Kingdom (%)
Place of birth for the foreign-born population - England (%)
Place of birth for the foreign-born population - Scotland (%)
Place of birth for the foreign-born population - Other Northern Europe (%)
Place of birth for the foreign-born population - Austria (%)
Place of birth for the foreign-born population - Belgium (%)
Place of birth for the foreign-born population - France (%)
Place of birth for the foreign-born population - Germany (%)
Place of birth for the foreign-born population - Netherlands (%)
Place of birth for the foreign-born population - Switzerland (%)
Place of birth for the foreign-born population - Other Western Europe (%)
Place of birth for the foreign-born population - Greece (%)
Place of birth for the foreign-born population - Italy (%)
Place of birth for the foreign-born population - Portugal (%)
Place of birth for the foreign-born population - Spain (%)
Place of birth for the foreign-born population - Other Southern Europe (%)
Place of birth for the foreign-born population - Albania (%)
Place of birth for the foreign-born population - Belarus (%)
Place of birth for the foreign-born population - Bosnia and Herzegovina (%)
Place of birth for the foreign-born population - Bulgaria (%)
Place of birth for the foreign-born population - Croatia (%)
Place of birth for the foreign-born population - Czechoslovakia (%)
Place of birth for the foreign-born population - Hungary (%)
Place of birth for the foreign-born population - Latvia (%)
Place of birth for the foreign-born population - Lithuania (%)
Place of birth for the foreign-born population - North Macedonia (Macedonia) (%)
Place of birth for the foreign-born population - Moldova (%)
Place of birth for the foreign-born population - Poland (%)
Place of birth for the foreign-born population - Romania (%)
Place of birth for the foreign-born population - Russia (%)
Place of birth for the foreign-born population - Serbia (%)
Place of birth for the foreign-born population - Ukraine (%)
Place of birth for the foreign-born population - Other Eastern Europe (%)
Place of birth for the foreign-born population - China (%)
Place of birth for the foreign-born population - Hong Kong (%)
Place of birth for the foreign-born population - Taiwan (%)
Place of birth for the foreign-born population - Japan (%)
Place of birth for the foreign-born population - Korea (%)
Place of birth for the foreign-born population - Other Eastern Asia (%)
Place of birth for the foreign-born population - Afghanistan (%)
Place of birth for the foreign-born population - Bangladesh (%)
Place of birth for the foreign-born population - India (%)
Place of birth for the foreign-born population - Iran (%)
Place of birth for the foreign-born population - Kazakhstan (%)
Place of birth for the foreign-born population - Nepal (%)
Place of birth for the foreign-born population - Pakistan (%)
Place of birth for the foreign-born population - Sri Lanka (%)
Place of birth for the foreign-born population - Uzbekistan (%)
Place of birth for the foreign-born population - Other South Central Asia (%)
Place of birth for the foreign-born population - Burma (%)
Place of birth for the foreign-born population - Cambodia (%)
Place of birth for the foreign-born population - Indonesia (%)
Place of birth for the foreign-born population - Laos (%)
Place of birth for the foreign-born population - Malaysia (%)
Place of birth for the foreign-born population - Philippines (%)
Place of birth for the foreign-born population - Singapore (%)
Place of birth for the foreign-born population - Thailand (%)
Place of birth for the foreign-born population - Vietnam (%)
Place of birth for the foreign-born population - Other South Eastern Asia (%)
Place of birth for the foreign-born population - Armenia (%)
Place of birth for the foreign-born population - Iraq (%)
Place of birth for the foreign-born population - Israel (%)
Place of birth for the foreign-born population - Jordan (%)
Place of birth for the foreign-born population - Kuwait (%)
Place of birth for the foreign-born population - Lebanon (%)
Place of birth for the foreign-born population - Saudi Arabia (%)
Place of birth for the foreign-born population - Syria (%)
Place of birth for the foreign-born population - Turkey (%)
Place of birth for the foreign-born population - Yemen (%)
Place of birth for the foreign-born population - Other Western Asia (%)
Place of birth for the foreign-born population - Eritrea (%)
Place of birth for the foreign-born population - Ethiopia (%)
Place of birth for the foreign-born population - Kenya (%)
Place of birth for the foreign-born population - Somalia (%)
Place of birth for the foreign-born population - Uganda (%)
Place of birth for the foreign-born population - Zimbabwe (%)
Place of birth for the foreign-born population - Other Eastern Africa (%)
Place of birth for the foreign-born population - Cameroon (%)
Place of birth for the foreign-born population - Congo (%)
Place of birth for the foreign-born population - Democratic Republic of Congo (Zaire) (%)
Place of birth for the foreign-born population - Other Middle Africa (%)
Place of birth for the foreign-born population - Egypt (%)
Place of birth for the foreign-born population - Morocco (%)
Place of birth for the foreign-born population - Sudan (%)
Place of birth for the foreign-born population - Other Northern Africa (%)
Place of birth for the foreign-born population - South Africa (%)
Place of birth for the foreign-born population - Other Southern Africa (%)
Place of birth for the foreign-born population - Cabo Verde (%)
Place of birth for the foreign-born population - Ghana (%)
Place of birth for the foreign-born population - Liberia (%)
Place of birth for the foreign-born population - Nigeria (%)
Place of birth for the foreign-born population - Senegal (%)
Place of birth for the foreign-born population - Sierra Leone (%)
Place of birth for the foreign-born population - Other Western Africa (%)
Place of birth for the foreign-born population - Australia (%)
Place of birth for the foreign-born population - New Zealand (%)
Place of birth for the foreign-born population - Fiji (%)
Place of birth for the foreign-born population - Micronesia (%)
Place of birth for the foreign-born population - Bahamas (%)
Place of birth for the foreign-born population - Barbados (%)
Place of birth for the foreign-born population - Cuba (%)
Place of birth for the foreign-born population - Dominica (%)
Place of birth for the foreign-born population - Dominican Republic (%)
Place of birth for the foreign-born population - Grenada (%)
Place of birth for the foreign-born population - Haiti (%)
Place of birth for the foreign-born population - Jamaica (%)
Place of birth for the foreign-born population - St. Vincent and the Grenadines (%)
Place of birth for the foreign-born population - Trinidad and Tobago (%)
Place of birth for the foreign-born population - West Indies (%)
Place of birth for the foreign-born population - Other Caribbean (%)
Place of birth for the foreign-born population - Belize (%)
Place of birth for the foreign-born population - Costa Rica (%)
Place of birth for the foreign-born population - El Salvador (%)
Place of birth for the foreign-born population - Guatemala (%)
Place of birth for the foreign-born population - Honduras (%)
Place of birth for the foreign-born population - Mexico (%)
Place of birth for the foreign-born population - Nicaragua (%)
Place of birth for the foreign-born population - Panama (%)
Place of birth for the foreign-born population - Other Central America (%)
Place of birth for the foreign-born population - Argentina (%)
Place of birth for the foreign-born population - Bolivia (%)
Place of birth for the foreign-born population - Brazil (%)
Place of birth for the foreign-born population - Chile (%)
Place of birth for the foreign-born population - Colombia (%)
Place of birth for the foreign-born population - Ecuador (%)
Place of birth for the foreign-born population - Guyana (%)
Place of birth for the foreign-born population - Peru (%)
Place of birth for the foreign-born population - Uruguay (%)
Place of birth for the foreign-born population - Venezuela (%)
Place of birth for the foreign-born population - Other South America (%)
Place of birth for the foreign-born population - Canada (%)
Place of birth for the foreign-born population - Other Northern America (%)
Place of birth for the foreign-born population - Other (%)
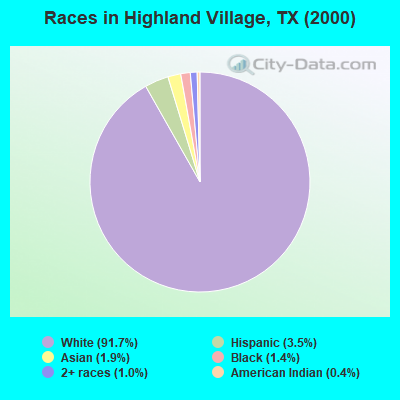
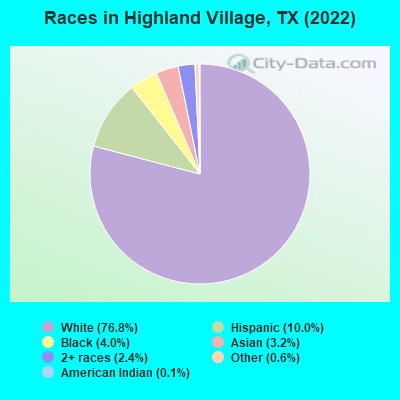
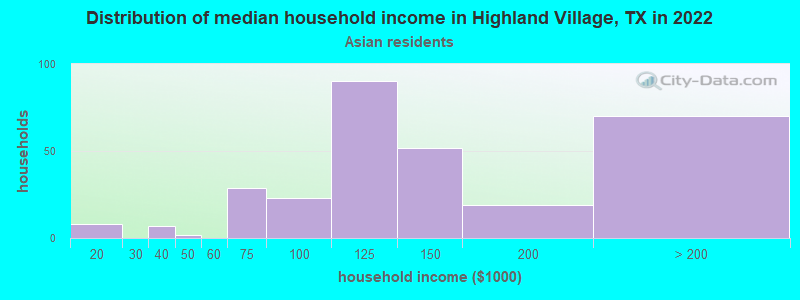
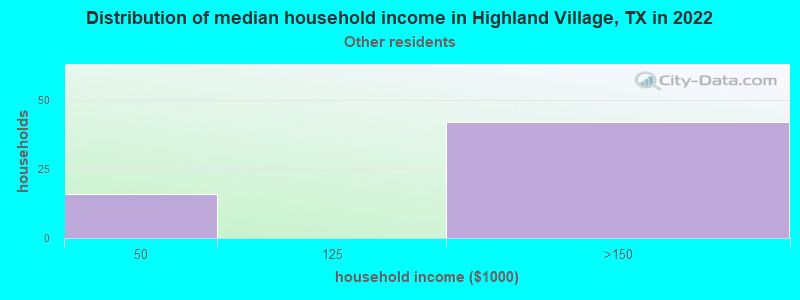
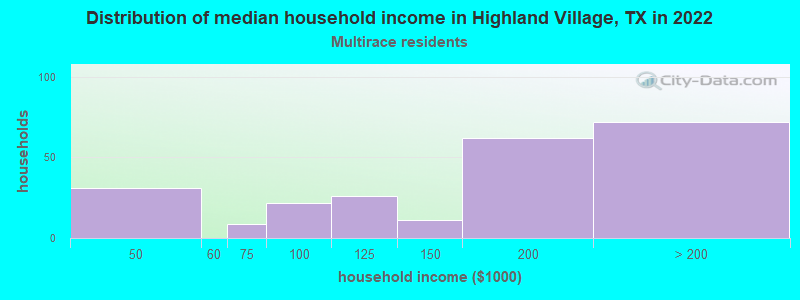
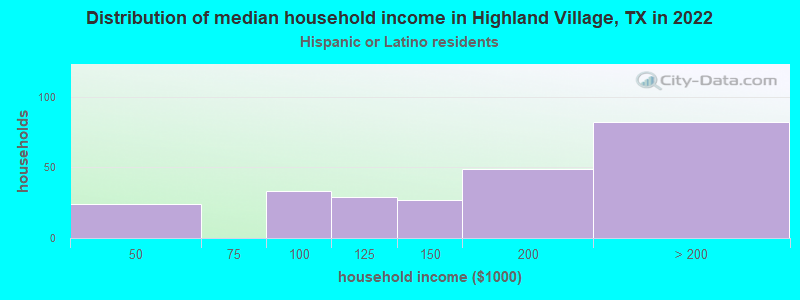
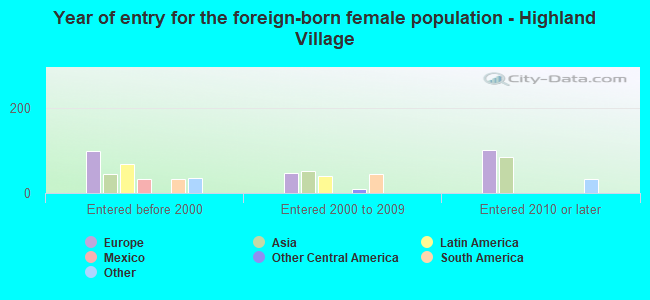
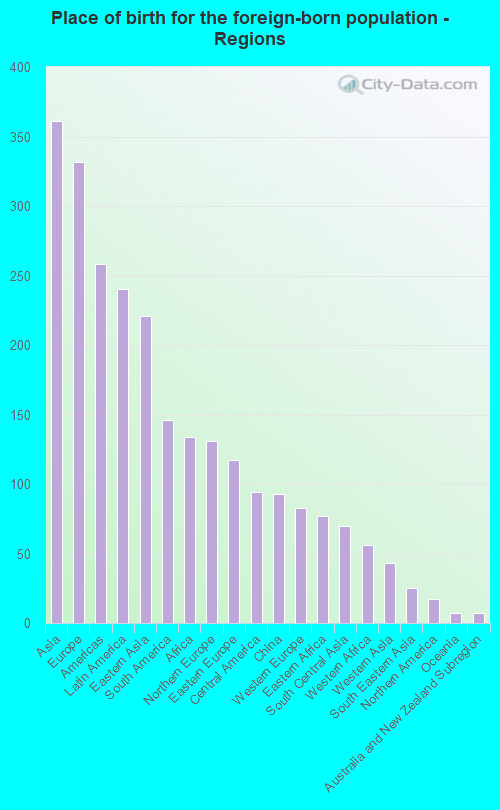
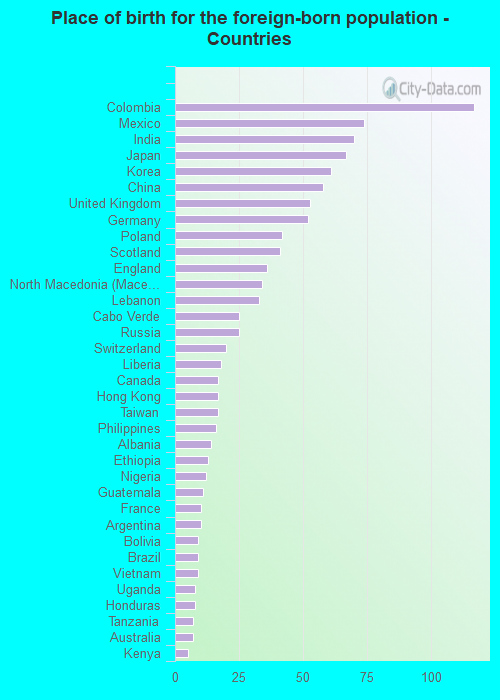
According to 2022 data, the most numerous races in Highland Village, TX are Hispanic (1,693 residents), White alone (13,026 residents), and Black alone (673 residents). 89.7% of Highland Village residents speak English at home. 6.4% of Highland Village, TX residents are foreign-born (2.2% born in Asia, 2.0% born in Europe, 1.5% born in Latin America, 0.8% born in Africa), which is 163.7% less than the foreign-born rate of 17.0% across the entire state of Texas.
Race distribution in Highland Village
2000 2022
10,933,313 52.4% White alone 6,669,666 32.0% Hispanic 2,364,255 11.3% Black alone 554,445 2.7% Asian alone 230,567 1.1% Two or more races 68,859 0.3% American Indian alone 19,958 0.10% Other race alone 10,757 0.05% Native Hawaiian and Other
12,070,642 40.2% Hispanic 11,683,430 38.9% White alone 3,508,706 11.7% Black alone 1,608,173 5.4% Asian alone 956,560 3.2% Two or more races 125,763 0.4% Other race alone 47,023 0.2% American Indian alone 29,275 0.10% Native Hawaiian and Other
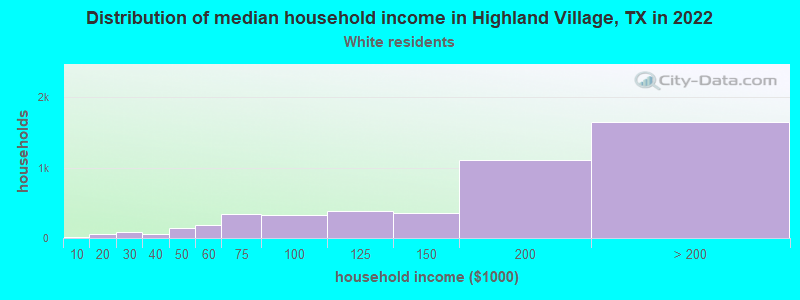
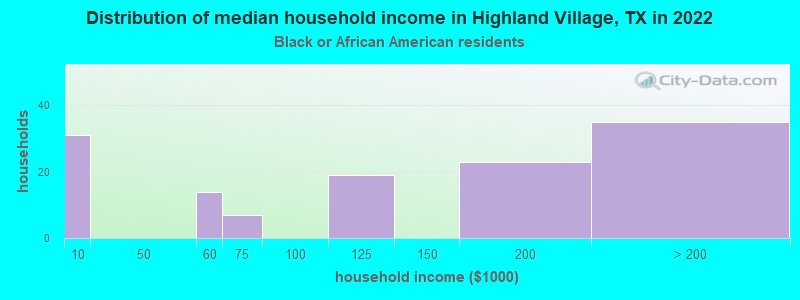
Income and house value in Highland Village Median household income in 2022 $163,831 White non-Hispanic householders$166,500 Black householders$122,638 Asian householders$142,718 Some other race householders$172,892 Two or more races householders$167,722 Hispanic or Latino race householdersMedian 2022 house value $523,982 White Non-Hispanic householders$536,782 Black or African American householders$446,344 American Indian or Alaska Native householders $513,129 Asian householders$521,756 Some other race householders$454,971 Two or more races householders$545,409 Hispanic or Latino householders
Median age by race in Highland Village
46.1 Median age for White residents44.5 47.4 36.9 Median age for Black or African American residents36.9 40.6 47.9 Median age for American Indian / Alaska Native residents-700,803,212.2 -734,693,876.8 50.1 Median age for Asian residents48.5 50.7 -305,343,511.1 Median age for Native Hawaiian / Pacific Islander residents-601,801,801.2 -656,771,799.0 33.4 Median age for Other race residents22.8 34.1 24.1 Median age for Two or more races residents19.4 41.1 46.3 Median age for White alone residents44.5 47.7 22.3 Median age for Hispanic or Latino residents15.3 34.3
Owner/renter occupied households by race in Highland Village
House owners and renters - White residents 4,367 93.5% Owner occupied303 6.5% Renter occupiedHouse owners and renters - Black or African American residents 145 100.0% Owner occupiedHouse owners and renters - American Indian / Alaska Native residents 10 100.0% Owner occupiedHouse owners and renters - Asian residents 232 79.0% Owner occupied62 21.0% Renter occupiedHouse owners and renters - Other race residents 56 100.0% Owner occupiedHouse owners and renters - Two or more races residents 242 100.0% Owner occupiedHouse owners and renters - White alone residents 4,451 93.4% Owner occupied316 6.6% Renter occupiedHouse owners and renters - Hispanic or Latino residents 243 100.0% Owner occupied
Language usage in Highland Village
English speakers - Total 89.7% of residents of Highland Village speak English at home.
5.1% of residents speak Spanish at home 777 94.5% Speak English very well45 5.5% Speak English less than very well4.8% of residents speak other language at home 510 65.6% Speak English very well267 34.4% Speak English less than very well
English speakers - Born in the United States 95.6% of residents of Highland Village speak English at home.
3.2% of residents speak Spanish at home 234 97.1% Speak English very well7 2.9% Speak English less than very well1.1% of residents speak other language at home 61 76.2% Speak English very well19 23.8% Speak English less than very well
English speakers - Native, born elsewhere 81.9% of residents of Highland Village speak English at home.
20.9% of residents speak Spanish at home 38 100.0% Speak English very well
English speakers - Foreign-born 31.0% of residents of Highland Village speak English at home.
18.7% of residents speak Spanish at home 178 81.7% Speak English very well40 18.3% Speak English less than very well48.0% of residents speak other language at home 363 64.7% Speak English very well198 35.3% Speak English less than very well
White (Caucasian) - Speak only English Native:
97.9% (12,018)Foreign-born:
56.1% (189)
White (Caucasian) - Speak another language Native:
2.8% (344)Foreign-born:
53.2% (179)
Black or African American - Speak only English Native:
100.0% (516)Foreign-born:
44.9% (43)
Black or African American - Speak another language Native:
0.2% (1)Foreign-born:
34.0% (32)
Asian - Speak only English Native:
84.3% (128)Foreign-born:
24.6% (94)
Asian - Speak another language Native:
18.6% (28)Foreign-born:
76.5% (291)
Other race - Speak only English Native:
78.4% (154)Foreign-born:
44.4% (26)
Other race - Speak another language Native:
24.1% (47)Foreign-born:
40.0% (24)
Two or more races - Speak another language Native:
16.7% (174)Foreign-born:
100.0% (151)
White alone - Speak only English Native:
97.9% (11,860)Foreign-born:
41.2% (219)
White alone - Speak another language Native:
2.1% (255)Foreign-born:
58.8% (313)
Hispanic or Latino - Speak only English Native:
65.1% (872)Foreign-born:
9.3% (13)
Hispanic or Latino - Speak another language Native:
35.7% (479)Foreign-born:
87.9% (122)
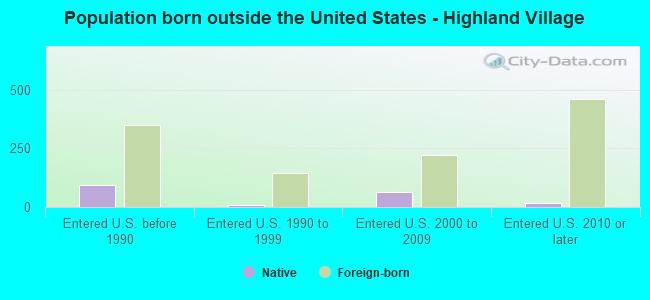
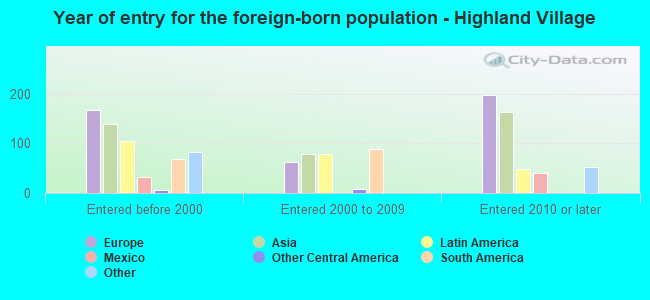
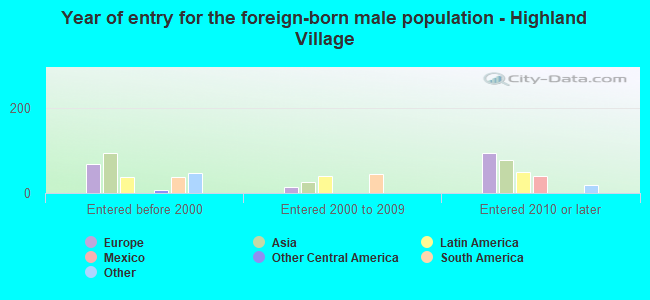
Foreign-born residents in Highland Village 1,094 residents are foreign born (2.2% Asia , 2.0% Europe , 1.5% Latin America , 0.8% Africa ).
This city:
6.4%Texas:
17.1%
Marital status for residents in Highland Village Marital status - White (Caucasian) population 15 years and over
Males 25.9% Never married67.2% Now married1.4% Separated1.0% Widowed4.5% DivorcedFemales 19.6% Never married62.9% Now married0.2% Separated10.2% Widowed7.1% DivorcedWomen who gave birth in the past 12 months Now married:
65.9% (151)Unmarried:
34.1% (78)
Women who did not give birth in the past 12 months Now married:
57.8% (1,498)Unmarried:
42.2% (1,095)
Marital status - Black or African American population 15 years and over
Males 44.1% Never married55.9% Now married0.0% Separated0.0% Widowed0.0% DivorcedFemales 37.9% Never married44.9% Now married0.0% Separated9.8% Widowed7.4% DivorcedWomen who did not give birth in the past 12 months Now married:
45.9% (92)Unmarried:
54.1% (109)
Marital status - American Indian / Alaska Native population 15 years and over
Males 35.7% Never married64.3% Now married0.0% Separated0.0% Widowed0.0% DivorcedFemales 40.0% Never married60.0% Now married0.0% Separated0.0% Widowed0.0% DivorcedWomen who did not give birth in the past 12 months Now married:
0.0% (0)Unmarried:
100.0% (6)
Marital status - Asian population 15 years and over
Males 21.8% Never married72.4% Now married0.0% Separated2.5% Widowed3.3% DivorcedFemales 11.4% Never married88.0% Now married0.0% Separated0.6% Widowed0.0% DivorcedWomen who gave birth in the past 12 months Now married:
100.0% (15)Unmarried:
0.0% (0)
Women who did not give birth in the past 12 months Now married:
82.8% (61)Unmarried:
17.2% (13)
Marital status - Other race population 15 years and over
Males 36.2% Never married63.8% Now married0.0% Separated0.0% Widowed0.0% DivorcedFemales 12.3% Never married86.3% Now married1.4% Separated0.0% Widowed0.0% DivorcedWomen who did not give birth in the past 12 months Now married:
83.0% (74)Unmarried:
17.0% (15)
Marital status - Two or more races population 15 years and over
Males 36.3% Never married63.7% Now married0.0% Separated0.0% Widowed0.0% DivorcedFemales 23.2% Never married60.7% Now married0.0% Separated3.9% Widowed12.1% DivorcedWomen who gave birth in the past 12 months Now married:
100.0% (16)Unmarried:
0.0% (0)
Women who did not give birth in the past 12 months Now married:
64.4% (163)Unmarried:
35.6% (90)
Marital status - White alone, not Hispanic / Latino population 15 years and over
Males 25.7% Never married67.3% Now married1.4% Separated1.1% Widowed4.5% DivorcedFemales 18.8% Never married63.6% Now married0.2% Separated10.4% Widowed7.1% DivorcedWomen who gave birth in the past 12 months Now married:
89.4% (165)Unmarried:
10.6% (20)
Women who did not give birth in the past 12 months Now married:
57.7% (1,565)Unmarried:
42.3% (1,145)
Marital status - Hispanic or Latino population 15 years and over
Males 30.1% Never married67.4% Now married0.0% Separated0.0% Widowed2.5% DivorcedFemales 30.6% Never married57.6% Now married0.2% Separated5.1% Widowed6.5% DivorcedWomen who gave birth in the past 12 months Now married:
0.0% (0)Unmarried:
100.0% (73)
Women who did not give birth in the past 12 months Now married:
71.8% (207)Unmarried:
28.2% (81)
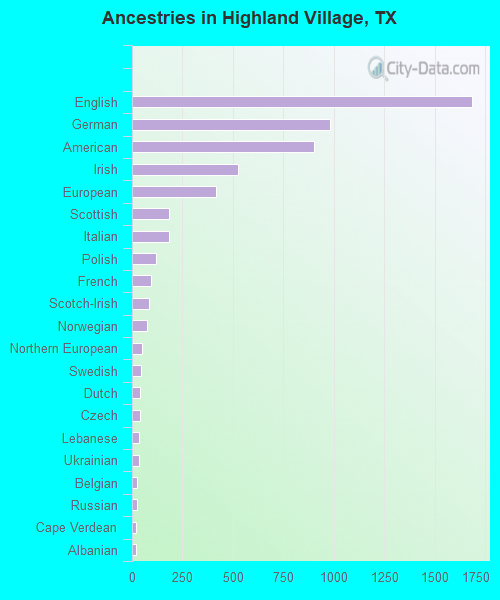
Ancestries in Highland Village
1,684 23.6% English981 13.7% German902 12.6% American526 7.4% Irish417 5.8% European185 2.6% Scottish183 2.6% Italian119 1.7% Polish93 1.3% French86 1.2% Scotch-Irish76 1.1% Norwegian50 0.7% Northern European47 0.7% Swedish42 0.6% Dutch39 0.5% Czech37 0.5% Lebanese37 0.5% Ukrainian27 0.4% Belgian25 0.4% Russian21 0.3% Cape Verdean18 0.3% Albanian13 0.2% Nigerian12 0.2% Ethiopian11 0.2% Serbian11 0.2% Hungarian10 0.1% Eastern European10 0.1% British10 0.1% Scandinavian9 0.1% French Canadian9 0.1% Slovak8 0.1% Egyptian8 0.1% Danish8 0.1% Welsh4 0.06% Austrian3 0.04% Czechoslovakian
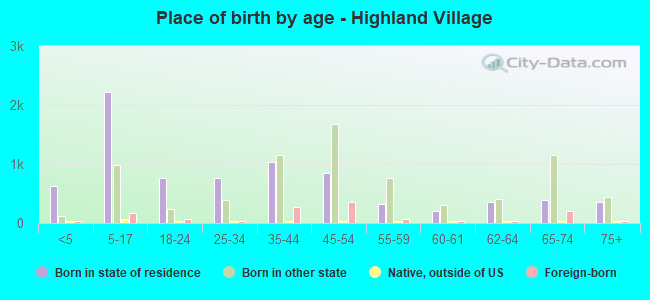
Children Nativity (place of birth) in Highland Village
Children under 6 years - Living with two parents Both parents native 657 100.0% NativeOne native, one foreign-born parent 62 100.0% NativeChildren under 6 years - Living with one parent Native parent 176 100.0% NativeChildren 6 to 17 years - Living with two parents Both parents native 2,383 98.0% Native48 2.0% Foreign-bornBoth parents foreign-born 214 79.2% Native56 20.8% Foreign-bornOne native, one foreign-born parent 180 91.9% Native16 8.1% Foreign-bornChildren 6 to 17 years - Living with one parent Native parent 119 70.8% Native49 29.2% Foreign-bornForeign-born parent 56 81.8% Native13 18.2% Foreign-born
Grandparents responsible for own grandchildren in Highland Village
Grandparents (30 to 59 years) White / Caucasian 85 61.9% Responsible for grandchildren52 38.1% Not responsible for grandchildrenTwo or more races 35 100.0% Responsible for grandchildrenWhite alone, not Hispanic / Latino 91 59.5% Responsible for grandchildren62 40.5% Not responsible for grandchildrenHispanic or Latino 36 100.0% Responsible for grandchildrenGrandparents (60 years and over) White / Caucasian 25 11.9% Responsible for grandchildren185 88.1% Not responsible for grandchildrenTwo or more races 11 43.3% Responsible for grandchildren15 56.7% Not responsible for grandchildrenWhite alone, not Hispanic / Latino 26 11.3% Responsible for grandchildren202 88.7% Not responsible for grandchildrenHispanic or Latino 8 20.2% Responsible for grandchildren30 79.8% Not responsible for grandchildren