Races in Highland, Washington (WA) Detailed Stats
Ancestries, Foreign-born residents, place of birth

Recent posts about races in Highland, Washington on our local forum with over 2,400,000 registered users:
 | Salmon Creek vs. Fishers Landing (222 replies) |
| Puget Sound hoping (78 replies) |
| Ocean Shores--good, bad and the ugly (107 replies) |
| You might be responsible for a Seattle street tree and not know it (0 replies) |
| What areas of Washington state might be a good fit for me? Seattle area or otherwise (14 replies) |
| Considering moving the family to Seattle (44 replies) |
Latest news about races in Highland, WA collected exclusively by city-data.com from local newspapers, TV, and radio stations
3.4% of Highland, WA residents are foreign-born (3.1% born in Latin America), which is 338.1% less than the foreign-born rate of 15.0% across the entire state of Washington.
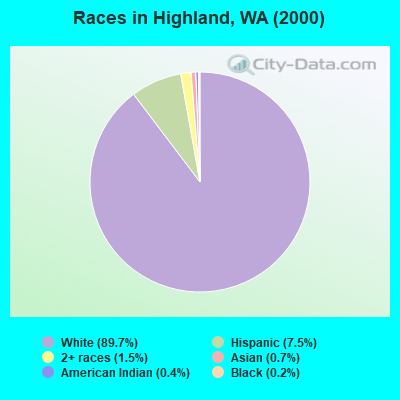
Race distribution in Highland

- 3,03889.7%White alone
- 2557.5%Hispanic
- 511.5%Two or more races
- 230.7%Asian alone
- 120.4%American Indian alone
- 80.2%Black alone
- 10.03%Native Hawaiian and Other
Pacific Islander alone
2000
2022
-
- 4,652,49078.9%White alone
- 441,5097.5%Hispanic
- 319,4015.4%Asian alone
- 184,6313.1%Black alone
- 175,9263.0%Two or more races
- 85,3961.4%American Indian alone
- 22,7790.4%Native Hawaiian and Other
Pacific Islander alone - 11,9890.2%Other race alone

-
- 4,941,45663.5%White alone
- 1,093,31314.0%Hispanic
- 755,8329.7%Asian alone
- 523,4486.7%Two or more races
- 299,5373.8%Black alone
- 69,0240.9%American Indian alone
- 52,2310.7%Native Hawaiian and Other
Pacific Islander alone - 50,9450.7%Other race alone

Income and house value in Highland
- Median household income in 2022
- $112,523White non-Hispanic householders
- $120,353American Indian and Alaska Native householders
- $100,325Some other race householders
- $107,955Hispanic or Latino race householders
- Median 2022 house value
- $465,808White Non-Hispanic householders
- $443,120Some other race householders
- $489,205Hispanic or Latino householders
Household income for White non-Hispanic householders

Household income for American Indian and Alaska Native householders

Household income for Hispanic or Latino race householders

Foreign-born residents in Highland
116 residents are foreign born (3.1% Latin America).
| This city: | 3.4% |
| Washington: | 10.4% |
Ancestries in Highland

- 80722.6%Other
- 73520.6%German
- 44212.4%English
- 39010.9%Irish
- 2326.5%Norwegian
- 1554.3%Italian
- 1414.0%Swedish
- 1133.2%United States
- 912.6%French
- 902.5%Welsh
- 882.5%Danish
- 681.9%Scottish
- 511.4%Scotch-Irish
- 451.3%Polish
- 421.2%Czech
- 260.7%Dutch
- 240.7%Hungarian
- 80.2%French Canadian
- 80.2%Russian
- 80.2%Slovak

Zip codes: 99337.