Races in Highlands, New York (NY) Detailed Stats
Ancestries, Foreign-born residents, place of birth
5.6% of Highlands, NY residents are foreign-born (2.2% born in Asia, 1.7% born in Latin America, 1.2% born in Europe), which is 294.0% less than the foreign-born rate of 22.0% across the entire state of New York.
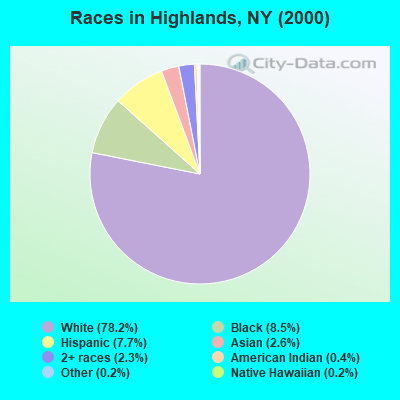
Race distribution in Highlands

- 9,76178.2%White alone
- 1,0648.5%Black alone
- 9627.7%Hispanic
- 3242.6%Asian alone
- 2812.3%Two or more races
- 510.4%American Indian alone
- 220.2%Other race alone
- 190.2%Native Hawaiian and Other
Pacific Islander alone
2000
2022
-
- 11,760,98162.0%White alone
- 2,867,58315.1%Hispanic
- 2,812,62314.8%Black alone
- 1,035,9265.5%Asian alone
- 366,1161.9%Two or more races
- 75,4990.4%Other race alone
- 52,4990.3%American Indian alone
- 5,2300.03%Native Hawaiian and Other
Pacific Islander alone

-
- 10,408,93352.9%White alone
- 3,867,29919.7%Hispanic
- 2,633,84013.4%Black alone
- 1,776,2869.0%Asian alone
- 732,6703.7%Two or more races
- 216,1101.1%Other race alone
- 35,0820.2%American Indian alone
- 6,9310.04%Native Hawaiian and Other
Pacific Islander alone

Income and house value in Highlands
- Median household income in 2022
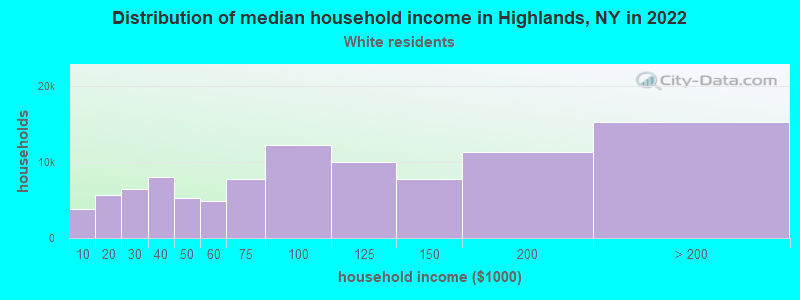
- $93,594White non-Hispanic householders
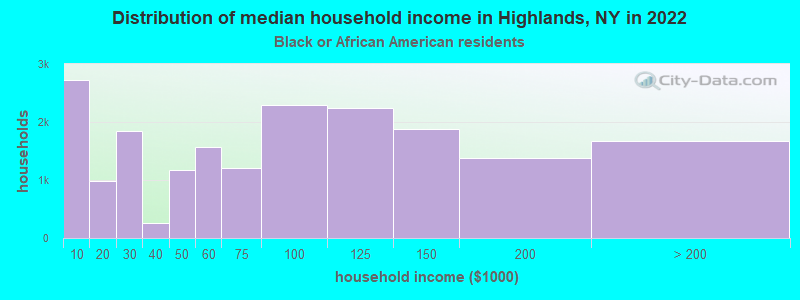
- $83,915Black householders
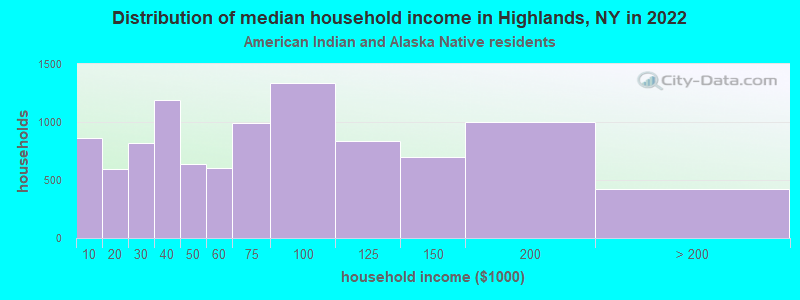
- $40,548American Indian and Alaska Native householders
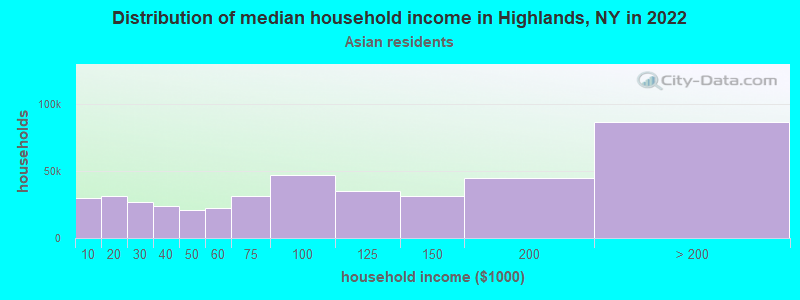
- $92,383Asian householders
- $69,199Some other race householders
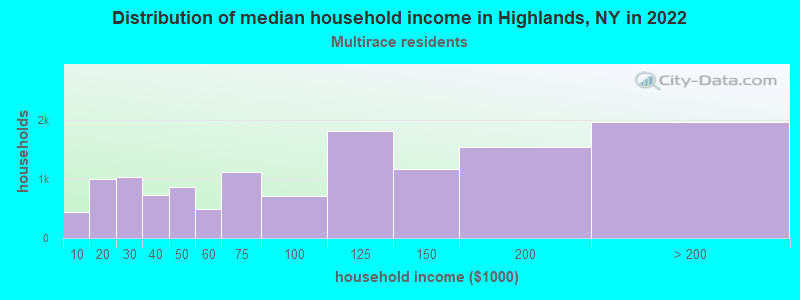
- $93,610Two or more races householders
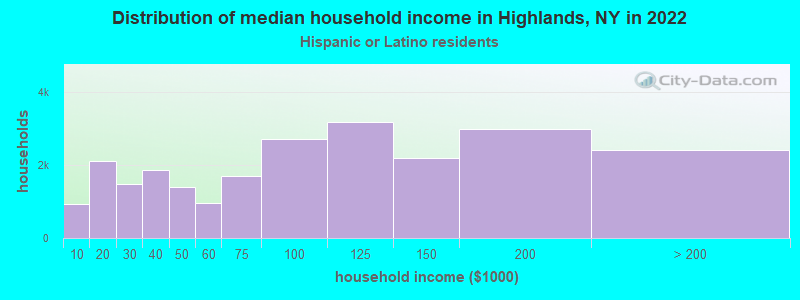
- $85,906Hispanic or Latino race householders
- Median 2022 house value
- $370,812White Non-Hispanic householders
- $258,938Black or African American householders
- $361,095Asian householders
- $464,303Two or more races householders
- $432,264Hispanic or Latino householders
Household income for White non-Hispanic householders
Household income for Black householders
Household income for American Indian and Alaska Native householders
Household income for Asian householders
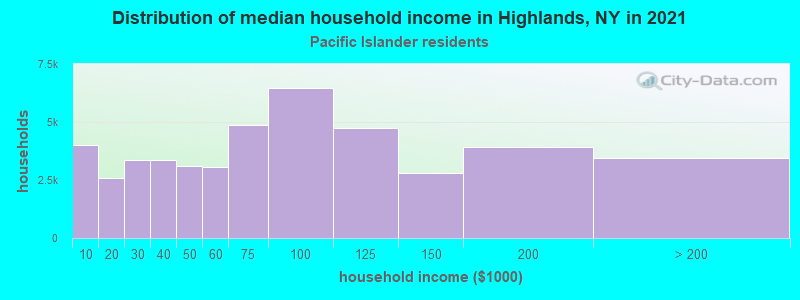
Household income for Native Hawaiian and other Pacific Islander householders
Household income for Two or more races householders
Household income for Hispanic or Latino race householders
Foreign-born residents in Highlands
697 residents are foreign born (2.2% Asia, 1.7% Latin America, 1.2% Europe).
| This city: | 5.6% |
| New York: | 20.4% |
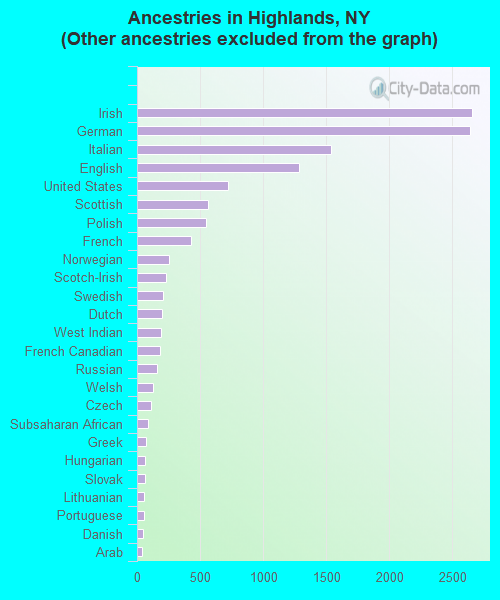
Ancestries in Highlands

- 3,32120.9%Other
- 2,65716.8%Irish
- 2,63816.6%German
- 1,5349.7%Italian
- 1,2868.1%English
- 7234.6%United States
- 5603.5%Scottish
- 5453.4%Polish
- 4262.7%French
- 2521.6%Norwegian
- 2261.4%Scotch-Irish
- 2051.3%Swedish
- 1951.2%Dutch
- 1901.2%West Indian
- 1841.2%French Canadian
- 1551.0%Russian
- 1300.8%Welsh
- 1090.7%Czech
- 850.5%Subsaharan African
- 750.5%Greek
- 630.4%Hungarian
- 610.4%Slovak
- 530.3%Lithuanian
- 520.3%Portuguese
- 450.3%Danish
- 410.3%Arab
- 310.2%Ukrainian
- 130.08%Swiss
Zip codes: 10928.