Races in Hobart, Indiana (IN) Detailed Stats
Data:
Races - White alone (%)
Races - White alone (% change since 2000)
Races - Black alone (%)
Races - Black alone (% change since 2000)
Races - American Indian alone (%)
Races - American Indian alone (% change since 2000)
Races - Asian alone (%)
Races - Asian alone (% change since 2000)
Races - Hispanic (%)
Races - Hispanic (% change since 2000)
Races - Native Hawaiian and Other Pacific Islander alone (%)
Races - Native Hawaiian and Other Pacific Islander alone (% change since 2000)
Races - Two or more races(%)
Races - Two or more races(% change since 2000)
Races - Other race alone (%)
Races - Other race alone (% change since 2000)
Racial diversity
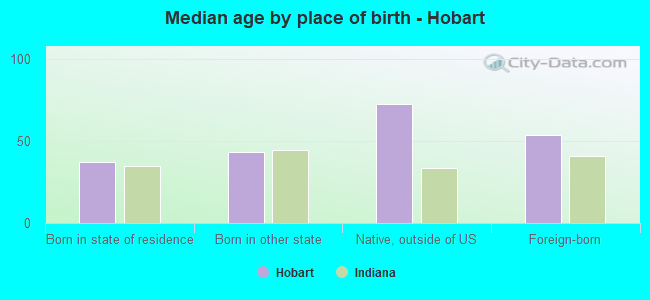
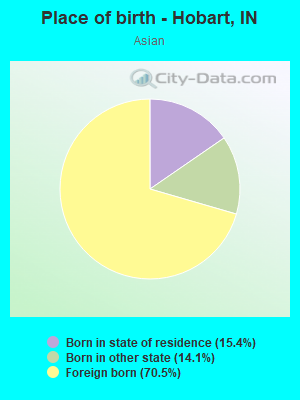
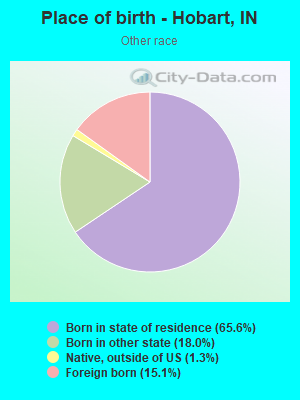
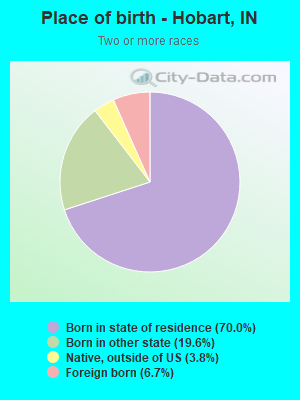
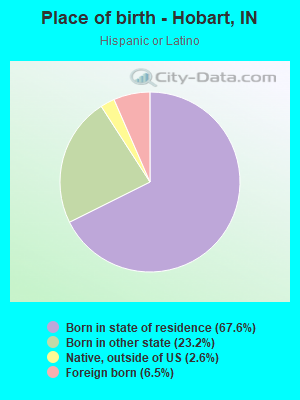
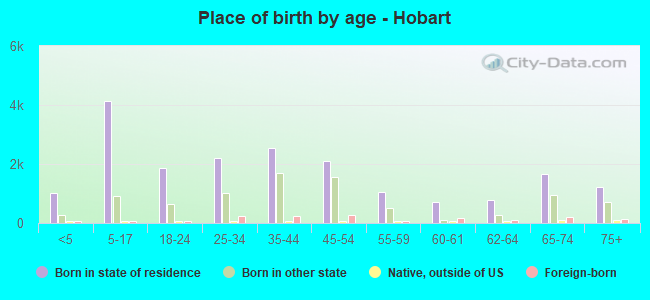
Place of birth - Born in state of residence (%)
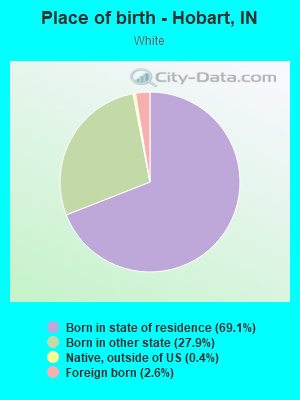
Place of birth - Born in state of residence (%) - White
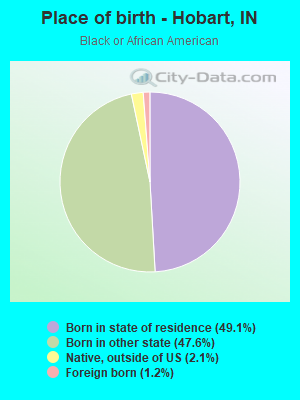
Place of birth - Born in state of residence (%) - Black or African American
Place of birth - Born in state of residence (%) - Asian
Place of birth - Born in state of residence (%) - Hispanic or Latino
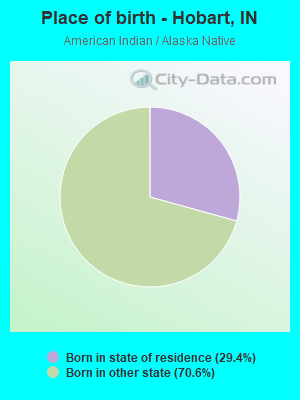
Place of birth - Born in state of residence (%) - American Indian and Alaska Native
Place of birth - Born in state of residence (%) - Multirace
Place of birth - Born in state of residence (%) - Other Race
Place of birth - Born in other state (%)
Place of birth - Born in other state (%) - White
Place of birth - Born in other state (%) - Black or African American
Place of birth - Born in other state (%) - Asian
Place of birth - Born in other state (%) - Hispanic or Latino
Place of birth - Born in other state (%) - American Indian and Alaska Native
Place of birth - Born in other state (%) - Multirace
Place of birth - Born in other state (%) - Other Race
Place of birth - Native, outside of US (%)
Place of birth - Native, outside of US (%) - White
Place of birth - Native, outside of US (%) - Black or African American
Place of birth - Native, outside of US (%) - Asian
Place of birth - Native, outside of US (%) - Hispanic or Latino
Place of birth - Native, outside of US (%) - American Indian and Alaska Native
Place of birth - Native, outside of US (%) - Multirace
Place of birth - Native, outside of US (%) - Other Race
Place of birth - Foreign born (%)
Place of birth - Foreign born (%) - White
Place of birth - Foreign born (%) - Black or African American
Place of birth - Foreign born (%) - Asian
Place of birth - Foreign born (%) - Hispanic or Latino
Place of birth - Foreign born (%) - American Indian and Alaska Native
Place of birth - Foreign born (%) - Multirace
Place of birth - Foreign born (%) - Other Race
Residents speaking English at home (%)
Residents speaking English at home - Born in the United States (%)
Residents speaking English at home - Native, born elsewhere (%)
Residents speaking English at home - Foreign born (%)
Residents speaking Spanish at home (%)
Residents speaking Spanish at home - Born in the United States (%)
Residents speaking Spanish at home - Native, born elsewhere (%)
Residents speaking Spanish at home - Foreign born (%)
Residents speaking other language at home (%)
Residents speaking other language at home - Born in the United States (%)
Residents speaking other language at home - Native, born elsewhere (%)
Residents speaking other language at home - Foreign born (%)
Marital status - Never married (%)
Marital status - Now married (%)
Marital status - Separated (%)
Marital status - Widowed (%)
Marital status - Divorced (%)
Ancestries Reported - Arab (%)
Ancestries Reported - Czech (%)
Ancestries Reported - Danish (%)
Ancestries Reported - Dutch (%)
Ancestries Reported - English (%)
Ancestries Reported - French (%)
Ancestries Reported - French Canadian (%)
Ancestries Reported - German (%)
Ancestries Reported - Greek (%)
Ancestries Reported - Hungarian (%)
Ancestries Reported - Irish (%)
Ancestries Reported - Italian (%)
Ancestries Reported - Lithuanian (%)
Ancestries Reported - Norwegian (%)
Ancestries Reported - Polish (%)
Ancestries Reported - Portuguese (%)
Ancestries Reported - Russian (%)
Ancestries Reported - Scotch-Irish (%)
Ancestries Reported - Scottish (%)
Ancestries Reported - Slovak (%)
Ancestries Reported - Subsaharan African (%)
Ancestries Reported - Swedish (%)
Ancestries Reported - Swiss (%)
Ancestries Reported - Ukrainian (%)
Ancestries Reported - United States (%)
Ancestries Reported - Welsh (%)
Ancestries Reported - West Indian (%)
Ancestries Reported - Other (%)
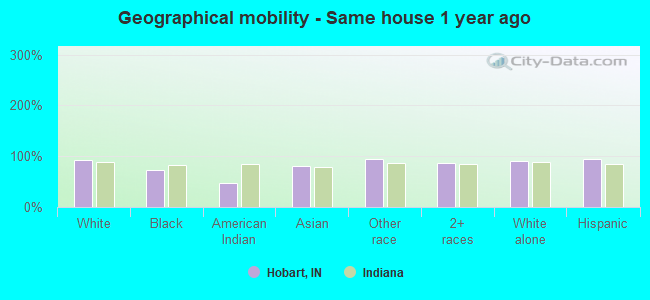
Geographical mobility - Same house 1 year ago (%)
Geographical mobility - Same house 1 year ago (%) - White
Geographical mobility - Same house 1 year ago (%) - Black or African American
Geographical mobility - Same house 1 year ago (%) - Asian
Geographical mobility - Same house 1 year ago (%) - Hispanic or Latino
Geographical mobility - Same house 1 year ago (%) - American Indian and Alaska Native
Geographical mobility - Same house 1 year ago (%) - Multirace
Geographical mobility - Same house 1 year ago (%) - Other Race
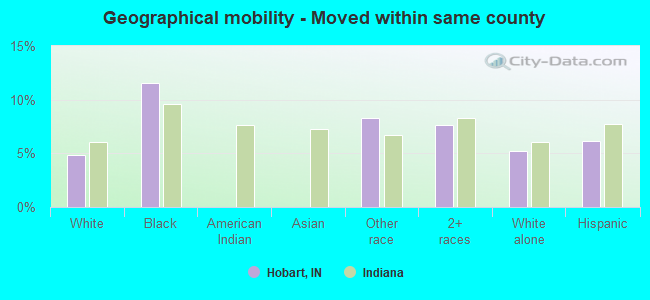
Geographical mobility - Moved within same county (%)
Geographical mobility - Moved within same county (%) - White
Geographical mobility - Moved within same county (%) - Black or African American
Geographical mobility - Moved within same county (%) - Asian
Geographical mobility - Moved within same county (%) - Hispanic or Latino
Geographical mobility - Moved within same county (%) - American Indian and Alaska Native
Geographical mobility - Moved within same county (%) - Multirace
Geographical mobility - Moved within same county (%) - Other Race
Geographical mobility - Moved from different county within same state (%)
Geographical mobility - Moved from different county within same state (%) - White
Geographical mobility - Moved from different county within same state (%) - Black or African American
Geographical mobility - Moved from different county within same state (%) - Asian
Geographical mobility - Moved from different county within same state (%) - Hispanic or Latino
Geographical mobility - Moved from different county within same state (%) - American Indian and Alaska Native
Geographical mobility - Moved from different county within same state (%) - Multirace
Geographical mobility - Moved from different county within same state (%) - Other Race
Geographical mobility - Moved from different state (%)
Geographical mobility - Moved from different state (%) - White
Geographical mobility - Moved from different state (%) - Black or African American
Geographical mobility - Moved from different state (%) - Asian
Geographical mobility - Moved from different state (%) - Hispanic or Latino
Geographical mobility - Moved from different state (%) - American Indian and Alaska Native
Geographical mobility - Moved from different state (%) - Multirace
Geographical mobility - Moved from different state (%) - Other Race
Geographical mobility - Moved from abroad (%)
Geographical mobility - Moved from abroad (%) - White
Geographical mobility - Moved from abroad (%) - Black or African American
Geographical mobility - Moved from abroad (%) - Asian
Geographical mobility - Moved from abroad (%) - Hispanic or Latino
Geographical mobility - Moved from abroad (%) - American Indian and Alaska Native
Geographical mobility - Moved from abroad (%) - Multirace
Geographical mobility - Moved from abroad (%) - Other Race
Place of birth for the foreign-born population - Ireland (%)
Place of birth for the foreign-born population - Denmark (%)
Place of birth for the foreign-born population - Norway (%)
Place of birth for the foreign-born population - Sweden (%)
Place of birth for the foreign-born population - United Kingdom (%)
Place of birth for the foreign-born population - England (%)
Place of birth for the foreign-born population - Scotland (%)
Place of birth for the foreign-born population - Other Northern Europe (%)
Place of birth for the foreign-born population - Austria (%)
Place of birth for the foreign-born population - Belgium (%)
Place of birth for the foreign-born population - France (%)
Place of birth for the foreign-born population - Germany (%)
Place of birth for the foreign-born population - Netherlands (%)
Place of birth for the foreign-born population - Switzerland (%)
Place of birth for the foreign-born population - Other Western Europe (%)
Place of birth for the foreign-born population - Greece (%)
Place of birth for the foreign-born population - Italy (%)
Place of birth for the foreign-born population - Portugal (%)
Place of birth for the foreign-born population - Spain (%)
Place of birth for the foreign-born population - Other Southern Europe (%)
Place of birth for the foreign-born population - Albania (%)
Place of birth for the foreign-born population - Belarus (%)
Place of birth for the foreign-born population - Bosnia and Herzegovina (%)
Place of birth for the foreign-born population - Bulgaria (%)
Place of birth for the foreign-born population - Croatia (%)
Place of birth for the foreign-born population - Czechoslovakia (%)
Place of birth for the foreign-born population - Hungary (%)
Place of birth for the foreign-born population - Latvia (%)
Place of birth for the foreign-born population - Lithuania (%)
Place of birth for the foreign-born population - North Macedonia (Macedonia) (%)
Place of birth for the foreign-born population - Moldova (%)
Place of birth for the foreign-born population - Poland (%)
Place of birth for the foreign-born population - Romania (%)
Place of birth for the foreign-born population - Russia (%)
Place of birth for the foreign-born population - Serbia (%)
Place of birth for the foreign-born population - Ukraine (%)
Place of birth for the foreign-born population - Other Eastern Europe (%)
Place of birth for the foreign-born population - China (%)
Place of birth for the foreign-born population - Hong Kong (%)
Place of birth for the foreign-born population - Taiwan (%)
Place of birth for the foreign-born population - Japan (%)
Place of birth for the foreign-born population - Korea (%)
Place of birth for the foreign-born population - Other Eastern Asia (%)
Place of birth for the foreign-born population - Afghanistan (%)
Place of birth for the foreign-born population - Bangladesh (%)
Place of birth for the foreign-born population - India (%)
Place of birth for the foreign-born population - Iran (%)
Place of birth for the foreign-born population - Kazakhstan (%)
Place of birth for the foreign-born population - Nepal (%)
Place of birth for the foreign-born population - Pakistan (%)
Place of birth for the foreign-born population - Sri Lanka (%)
Place of birth for the foreign-born population - Uzbekistan (%)
Place of birth for the foreign-born population - Other South Central Asia (%)
Place of birth for the foreign-born population - Burma (%)
Place of birth for the foreign-born population - Cambodia (%)
Place of birth for the foreign-born population - Indonesia (%)
Place of birth for the foreign-born population - Laos (%)
Place of birth for the foreign-born population - Malaysia (%)
Place of birth for the foreign-born population - Philippines (%)
Place of birth for the foreign-born population - Singapore (%)
Place of birth for the foreign-born population - Thailand (%)
Place of birth for the foreign-born population - Vietnam (%)
Place of birth for the foreign-born population - Other South Eastern Asia (%)
Place of birth for the foreign-born population - Armenia (%)
Place of birth for the foreign-born population - Iraq (%)
Place of birth for the foreign-born population - Israel (%)
Place of birth for the foreign-born population - Jordan (%)
Place of birth for the foreign-born population - Kuwait (%)
Place of birth for the foreign-born population - Lebanon (%)
Place of birth for the foreign-born population - Saudi Arabia (%)
Place of birth for the foreign-born population - Syria (%)
Place of birth for the foreign-born population - Turkey (%)
Place of birth for the foreign-born population - Yemen (%)
Place of birth for the foreign-born population - Other Western Asia (%)
Place of birth for the foreign-born population - Eritrea (%)
Place of birth for the foreign-born population - Ethiopia (%)
Place of birth for the foreign-born population - Kenya (%)
Place of birth for the foreign-born population - Somalia (%)
Place of birth for the foreign-born population - Uganda (%)
Place of birth for the foreign-born population - Zimbabwe (%)
Place of birth for the foreign-born population - Other Eastern Africa (%)
Place of birth for the foreign-born population - Cameroon (%)
Place of birth for the foreign-born population - Congo (%)
Place of birth for the foreign-born population - Democratic Republic of Congo (Zaire) (%)
Place of birth for the foreign-born population - Other Middle Africa (%)
Place of birth for the foreign-born population - Egypt (%)
Place of birth for the foreign-born population - Morocco (%)
Place of birth for the foreign-born population - Sudan (%)
Place of birth for the foreign-born population - Other Northern Africa (%)
Place of birth for the foreign-born population - South Africa (%)
Place of birth for the foreign-born population - Other Southern Africa (%)
Place of birth for the foreign-born population - Cabo Verde (%)
Place of birth for the foreign-born population - Ghana (%)
Place of birth for the foreign-born population - Liberia (%)
Place of birth for the foreign-born population - Nigeria (%)
Place of birth for the foreign-born population - Senegal (%)
Place of birth for the foreign-born population - Sierra Leone (%)
Place of birth for the foreign-born population - Other Western Africa (%)
Place of birth for the foreign-born population - Australia (%)
Place of birth for the foreign-born population - New Zealand (%)
Place of birth for the foreign-born population - Fiji (%)
Place of birth for the foreign-born population - Micronesia (%)
Place of birth for the foreign-born population - Bahamas (%)
Place of birth for the foreign-born population - Barbados (%)
Place of birth for the foreign-born population - Cuba (%)
Place of birth for the foreign-born population - Dominica (%)
Place of birth for the foreign-born population - Dominican Republic (%)
Place of birth for the foreign-born population - Grenada (%)
Place of birth for the foreign-born population - Haiti (%)
Place of birth for the foreign-born population - Jamaica (%)
Place of birth for the foreign-born population - St. Vincent and the Grenadines (%)
Place of birth for the foreign-born population - Trinidad and Tobago (%)
Place of birth for the foreign-born population - West Indies (%)
Place of birth for the foreign-born population - Other Caribbean (%)
Place of birth for the foreign-born population - Belize (%)
Place of birth for the foreign-born population - Costa Rica (%)
Place of birth for the foreign-born population - El Salvador (%)
Place of birth for the foreign-born population - Guatemala (%)
Place of birth for the foreign-born population - Honduras (%)
Place of birth for the foreign-born population - Mexico (%)
Place of birth for the foreign-born population - Nicaragua (%)
Place of birth for the foreign-born population - Panama (%)
Place of birth for the foreign-born population - Other Central America (%)
Place of birth for the foreign-born population - Argentina (%)
Place of birth for the foreign-born population - Bolivia (%)
Place of birth for the foreign-born population - Brazil (%)
Place of birth for the foreign-born population - Chile (%)
Place of birth for the foreign-born population - Colombia (%)
Place of birth for the foreign-born population - Ecuador (%)
Place of birth for the foreign-born population - Guyana (%)
Place of birth for the foreign-born population - Peru (%)
Place of birth for the foreign-born population - Uruguay (%)
Place of birth for the foreign-born population - Venezuela (%)
Place of birth for the foreign-born population - Other South America (%)
Place of birth for the foreign-born population - Canada (%)
Place of birth for the foreign-born population - Other Northern America (%)
Place of birth for the foreign-born population - Other (%)
Latest news about races in Hobart, IN collected exclusively by city-data.com from local newspapers, TV, and radio stations
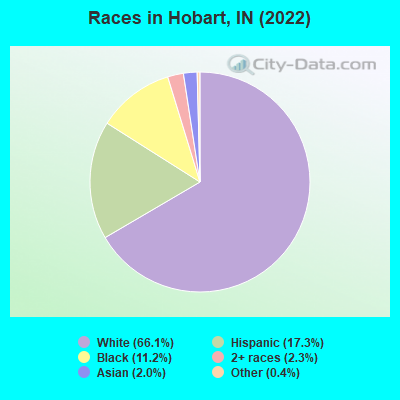
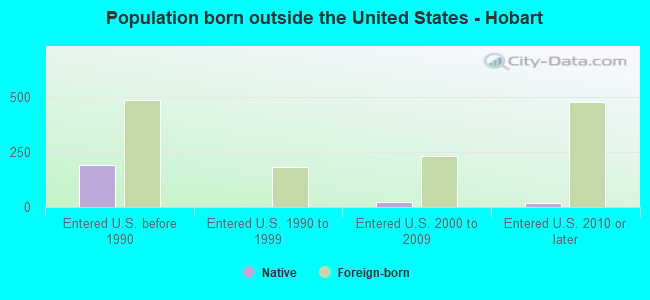
According to 2022 data, the most numerous races in Hobart, IN are White alone (19,630 residents), Black alone (3,318 residents), and Hispanic (5,139 residents). 88.9% of Hobart residents speak English at home. 4.8% of Hobart, IN residents are foreign-born (1.6% born in Europe, 1.3% born in Asia, 1.1% born in Latin America), which is 24.0% less than the foreign-born rate of 6.0% across the entire state of Indiana.
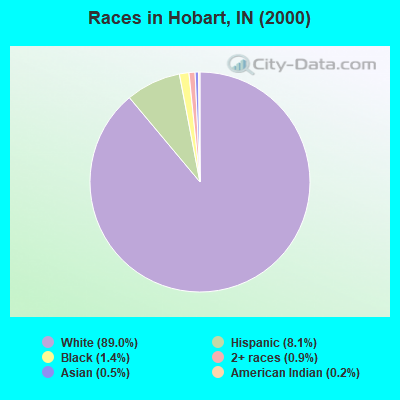
Race distribution in Hobart
2000 2022
5,219,373 85.8% White alone 505,462 8.3% Black alone 214,536 3.5% Hispanic 61,115 1.0% Two or more races 58,424 1.0% Asian alone 13,654 0.2% American Indian alone 6,348 0.1% Other race alone 1,573 0.03% Native Hawaiian and Other
5,192,455 76.0% White alone 628,054 9.2% Black alone 534,528 7.8% Hispanic 263,242 3.9% Two or more races 172,880 2.5% Asian alone 33,467 0.5% Other race alone 5,866 0.09% American Indian alone 2,545 0.04% Native Hawaiian and Other
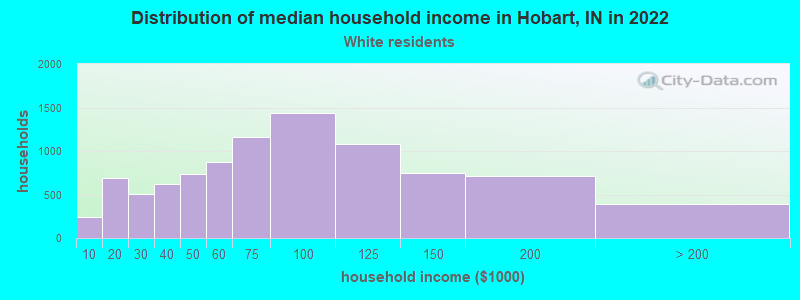
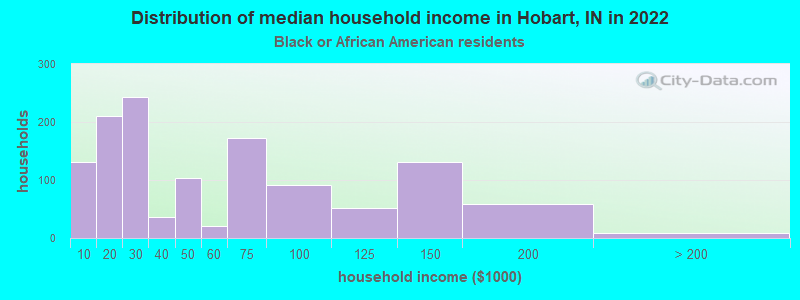
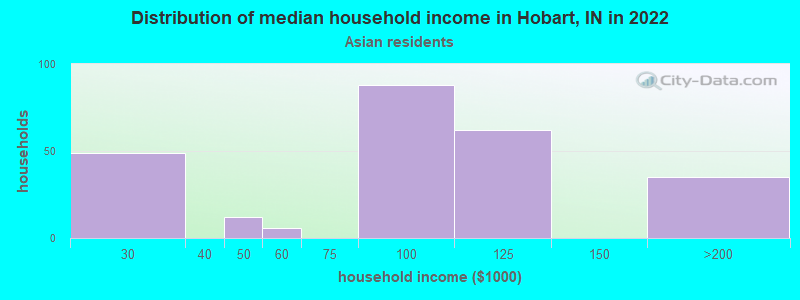
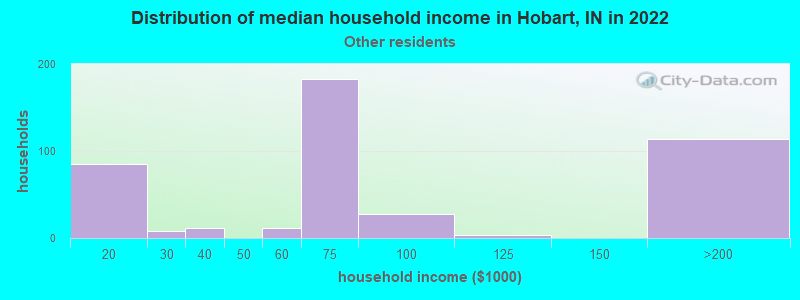
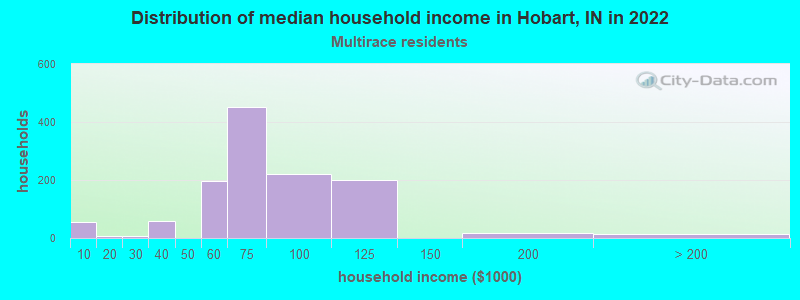
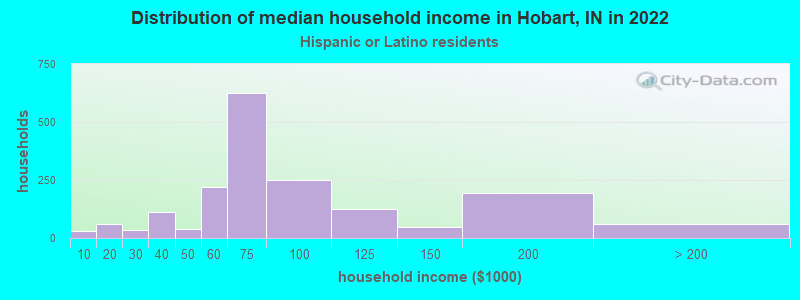
Income and house value in Hobart Median household income in 2022 $71,804 White non-Hispanic householders$37,049 Black householders$77,839 Asian householders$68,727 Some other race householders$72,182 Two or more races householders$71,120 Hispanic or Latino race householdersMedian 2022 house value $221,308 White Non-Hispanic householders$302,651 Black or African American householders$124,968 American Indian or Alaska Native householders $403,989 Asian householders$247,665 Some other race householders$198,132 Two or more races householders$244,711 Hispanic or Latino householders
Median age by race in Hobart
42.5 Median age for White residents42.2 42.4 32.5 Median age for Black or African American residents21.6 43.3 30.0 Median age for American Indian / Alaska Native residents33.1 -482,477,587.1 32.7 Median age for Asian residents34.5 32.7 -664,335,663.7 Median age for Native Hawaiian / Pacific Islander residents-644,025,156.6 -664,437,011.6 40.2 Median age for Other race residents38.9 37.1 32.8 Median age for Two or more races residents27.4 38.3 42.7 Median age for White alone residents42.9 44.5 28.9 Median age for Hispanic or Latino residents37.1 25.9
Owner/renter occupied households by race in Hobart
House owners and renters - White residents 7,407 80.8% Owner occupied1,763 19.2% Renter occupiedHouse owners and renters - Black or African American residents 248 18.9% Owner occupied1,062 81.1% Renter occupiedHouse owners and renters - American Indian / Alaska Native residents 2 100.0% Owner occupiedHouse owners and renters - Asian residents 99 32.6% Owner occupied204 67.4% Renter occupiedHouse owners and renters - Other race residents 235 58.0% Owner occupied170 42.0% Renter occupiedHouse owners and renters - Two or more races residents 718 76.0% Owner occupied227 24.0% Renter occupiedHouse owners and renters - White alone residents 7,068 81.2% Owner occupied1,641 18.8% Renter occupiedHouse owners and renters - Hispanic or Latino residents 1,197 72.8% Owner occupied447 27.2% Renter occupied
Language usage in Hobart
English speakers - Total 88.9% of residents of Hobart speak English at home.
6.2% of residents speak Spanish at home 1,428 81.4% Speak English very well327 18.6% Speak English less than very well4.4% of residents speak other language at home 954 75.7% Speak English very well306 24.3% Speak English less than very well
English speakers - Born in the United States 93.2% of residents of Hobart speak English at home.
4.0% of residents speak Spanish at home 282 84.7% Speak English very well51 15.3% Speak English less than very well2.3% of residents speak other language at home 179 92.3% Speak English very well15 7.7% Speak English less than very well
English speakers - Native, born elsewhere 23.6% of residents of Hobart speak English at home.
65.0% of residents speak Spanish at home 116 75.3% Speak English very well38 24.7% Speak English less than very well19.8% of residents speak other language at home 47 100.0% Speak English very well
English speakers - Foreign-born 33.5% of residents of Hobart speak English at home.
21.0% of residents speak Spanish at home 171 58.4% Speak English very well122 41.6% Speak English less than very well47.8% of residents speak other language at home 457 68.6% Speak English very well209 31.4% Speak English less than very well
White (Caucasian) - Speak only English Native:
95.4% (19,189)Foreign-born:
44.7% (242)
White (Caucasian) - Speak another language Native:
4.7% (936)Foreign-born:
48.6% (263)
Black or African American - Speak only English Native:
99.4% (2,955)Foreign-born:
55.1% (23)
Black or African American - Speak another language Native:
0.4% (11)Foreign-born:
42.4% (18)
Asian - Speak only English Native:
88.9% (90)Foreign-born:
16.0% (66)
Asian - Speak another language Native:
11.6% (12)Foreign-born:
81.5% (335)
Other race - Speak only English Native:
49.6% (415)Foreign-born:
10.0% (15)
Other race - Speak another language Native:
49.1% (411)Foreign-born:
89.8% (132)
Two or more races - Speak only English Native:
73.4% (1,814)Foreign-born:
21.5% (43)
Two or more races - Speak another language Native:
21.3% (527)Foreign-born:
76.5% (152)
White alone - Speak only English Native:
96.9% (18,029)Foreign-born:
38.2% (233)
White alone - Speak another language Native:
2.9% (533)Foreign-born:
47.0% (287)
Hispanic or Latino - Speak only English Native:
67.6% (2,980)Foreign-born:
11.9% (40)
Hispanic or Latino - Speak another language Native:
31.6% (1,392)Foreign-born:
88.2% (299)
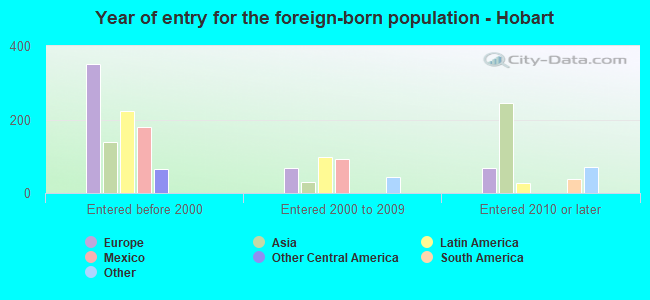
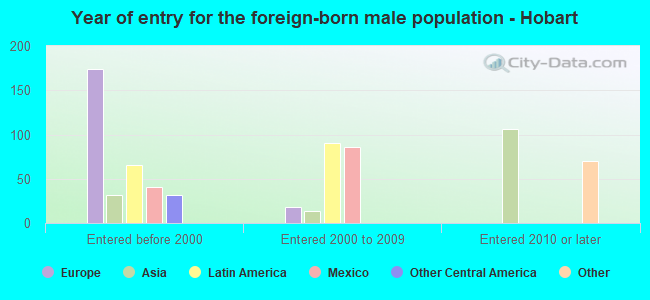
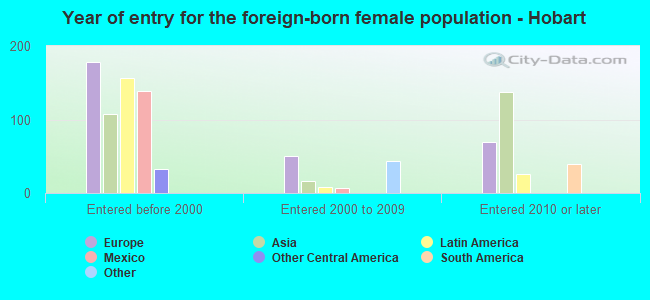
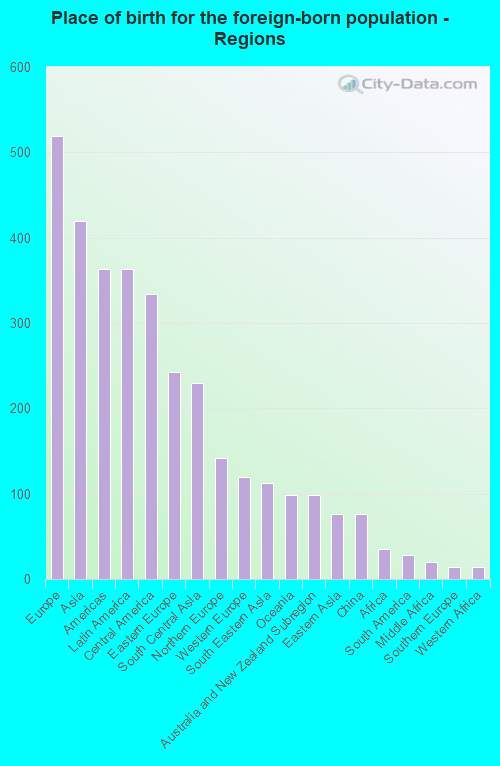
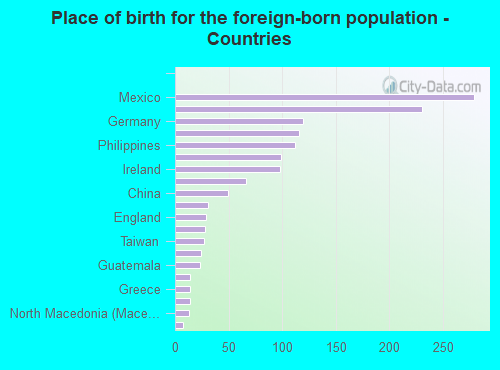
Foreign-born residents in Hobart 1,437 residents are foreign born (1.6% Europe , 1.3% Asia , 1.1% Latin America ).
This city:
4.8%Indiana:
5.6%
Marital status for residents in Hobart Marital status - White (Caucasian) population 15 years and over
Males 35.5% Never married47.2% Now married1.6% Separated3.3% Widowed12.5% DivorcedFemales 26.6% Never married46.4% Now married2.5% Separated9.6% Widowed15.0% DivorcedWomen who gave birth in the past 12 months Now married:
81.3% (69)Unmarried:
18.7% (16)
Women who did not give birth in the past 12 months Now married:
41.9% (1,798)Unmarried:
58.1% (2,497)
Marital status - Black or African American population 15 years and over
Males 61.2% Never married38.3% Now married0.0% Separated0.0% Widowed0.5% DivorcedFemales 36.4% Never married35.4% Now married11.5% Separated8.4% Widowed8.4% DivorcedWomen who gave birth in the past 12 months Now married:
9.7% (13)Unmarried:
90.3% (122)
Women who did not give birth in the past 12 months Now married:
49.9% (402)Unmarried:
50.1% (403)
Marital status - American Indian / Alaska Native population 15 years and over
Males 81.8% Never married18.2% Now married0.0% Separated0.0% Widowed0.0% DivorcedFemales 100.0% Never married0.0% Now married0.0% Separated0.0% Widowed0.0% DivorcedWomen who did not give birth in the past 12 months Now married:
0.0% (0)Unmarried:
100.0% (7)
Marital status - Asian population 15 years and over
Males 34.0% Never married66.0% Now married0.0% Separated0.0% Widowed0.0% DivorcedFemales 9.8% Never married65.6% Now married0.0% Separated0.0% Widowed24.6% DivorcedWomen who did not give birth in the past 12 months Now married:
85.5% (147)Unmarried:
14.5% (25)
Marital status - Other race population 15 years and over
Males 37.0% Never married41.7% Now married14.1% Separated3.5% Widowed3.7% DivorcedFemales 43.6% Never married36.0% Now married3.0% Separated9.3% Widowed8.1% DivorcedWomen who gave birth in the past 12 months Now married:
100.0% (7)Unmarried:
0.0% (0)
Women who did not give birth in the past 12 months Now married:
44.7% (157)Unmarried:
55.3% (195)
Marital status - Two or more races population 15 years and over
Males 40.2% Never married35.6% Now married1.9% Separated11.5% Widowed10.9% DivorcedFemales 37.4% Never married42.7% Now married0.0% Separated3.3% Widowed16.6% DivorcedWomen who did not give birth in the past 12 months Now married:
32.8% (313)Unmarried:
67.2% (642)
Marital status - White alone, not Hispanic / Latino population 15 years and over
Males 34.7% Never married47.6% Now married1.4% Separated3.6% Widowed12.8% DivorcedFemales 24.7% Never married45.8% Now married2.7% Separated10.2% Widowed16.5% DivorcedWomen who gave birth in the past 12 months Now married:
81.3% (72)Unmarried:
18.7% (16)
Women who did not give birth in the past 12 months Now married:
42.2% (1,620)Unmarried:
57.8% (2,220)
Marital status - Hispanic or Latino population 15 years and over
Males 42.7% Never married40.3% Now married5.7% Separated4.8% Widowed6.5% DivorcedFemales 46.6% Never married44.8% Now married0.8% Separated2.4% Widowed5.4% DivorcedWomen who gave birth in the past 12 months Now married:
100.0% (7)Unmarried:
0.0% (0)
Women who did not give birth in the past 12 months Now married:
35.3% (538)Unmarried:
64.7% (984)
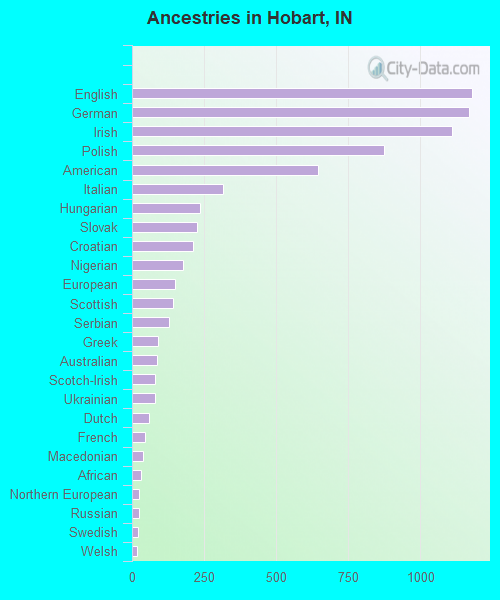
Ancestries in Hobart
1,180 9.4% English1,169 9.3% German1,112 8.9% Irish876 7.0% Polish647 5.1% American315 2.5% Italian236 1.9% Hungarian227 1.8% Slovak210 1.7% Croatian176 1.4% Nigerian148 1.2% European144 1.1% Scottish130 1.0% Serbian89 0.7% Greek88 0.7% Australian80 0.6% Scotch-Irish80 0.6% Ukrainian59 0.5% Dutch44 0.4% French37 0.3% Macedonian32 0.3% African25 0.2% Northern European23 0.2% Russian20 0.2% Swedish18 0.1% Welsh15 0.1% Romanian11 0.09% British10 0.08% Belgian9 0.07% Scandinavian8 0.06% Eastern European6 0.05% Yugoslavian
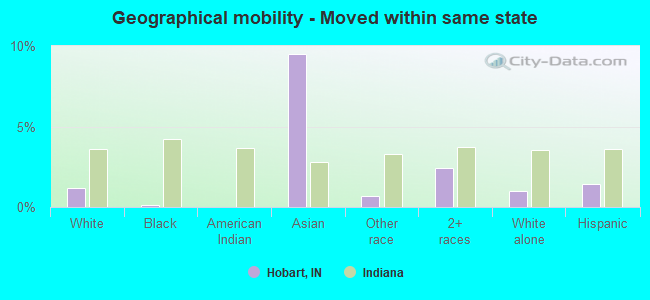
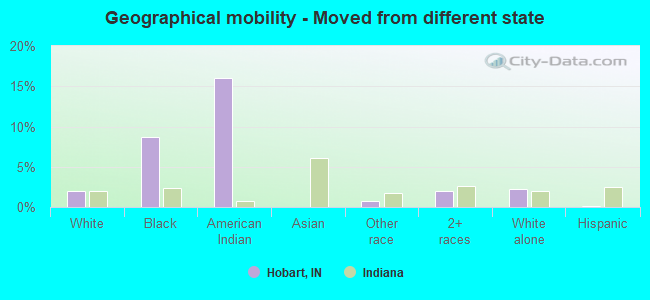
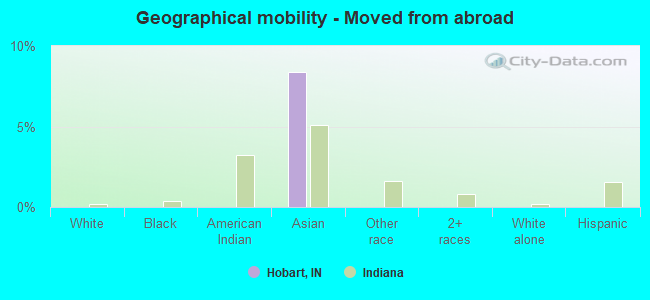
Geographical mobility in Hobart Same house 1 year ago 19,395 92.0% White (Caucasian)2,341 72.7% Black or African American22 47.2% American Indian / Alaska Native490 81.4% Asian918 94.4% Other race2,592 86.0% Two or more races17,913 91.5% White alone, not Hispanic / Latino4,803 94.1% Hispanic or LatinoMoved within same county 1,018 4.8% White / Caucasian373 11.6% Black or African American80 8.3% Other race230 7.6% Two or more races1,019 5.2% White alone, not Hispanic / Latino315 6.2% Hispanic or LatinoMoved within same state 246 1.2% White / Caucasian4 0.1% Black or African American57 9.5% Asian7 0.7% Other race73 2.4% Two or more races194 1.0% White alone, not Hispanic / Latino72 1.4% Hispanic or LatinoMoved from different state 412 2.0% White / Caucasian281 8.7% Black or African American7 16.0% American Indian / Alaska Native7 0.7% Other race59 2.0% Two or more races434 2.2% White alone, not Hispanic / Latino4 0.1% Hispanic or LatinoMoved from abroad 50 8.4% Asian
Children Nativity (place of birth) in Hobart
Children under 6 years - Living with two parents Both parents native 751 100.0% NativeBoth parents foreign-born 103 100.0% NativeOne native, one foreign-born parent 63 100.0% NativeChildren under 6 years - Living with one parent Native parent 467 100.0% NativeChildren 6 to 17 years - Living with two parents Both parents native 2,745 100.0% NativeBoth parents foreign-born 61 100.0% NativeOne native, one foreign-born parent 136 100.0% NativeChildren 6 to 17 years - Living with one parent Native parent 1,766 100.0% NativeForeign-born parent 30 47.4% Native34 52.6% Foreign-born
Grandparents responsible for own grandchildren in Hobart
Grandparents (30 to 59 years) White / Caucasian 64 78.0% Responsible for grandchildren18 22.0% Not responsible for grandchildrenWhite alone, not Hispanic / Latino 11 36.2% Responsible for grandchildren19 63.8% Not responsible for grandchildrenHispanic or Latino 85 100.0% Responsible for grandchildrenGrandparents (60 years and over) White / Caucasian 157 100.0% Responsible for grandchildrenWhite alone, not Hispanic / Latino 133 100.0% Responsible for grandchildrenHispanic or Latino 30 61.3% Responsible for grandchildren19 38.7% Not responsible for grandchildren