Races in Holbrook, New York (NY) Detailed Stats
Data:
Races - White alone (%)
Races - White alone (% change since 2000)
Races - Black alone (%)
Races - Black alone (% change since 2000)
Races - American Indian alone (%)
Races - American Indian alone (% change since 2000)
Races - Asian alone (%)
Races - Asian alone (% change since 2000)
Races - Hispanic (%)
Races - Hispanic (% change since 2000)
Races - Native Hawaiian and Other Pacific Islander alone (%)
Races - Native Hawaiian and Other Pacific Islander alone (% change since 2000)
Races - Two or more races(%)
Races - Two or more races(% change since 2000)
Races - Other race alone (%)
Races - Other race alone (% change since 2000)
Racial diversity
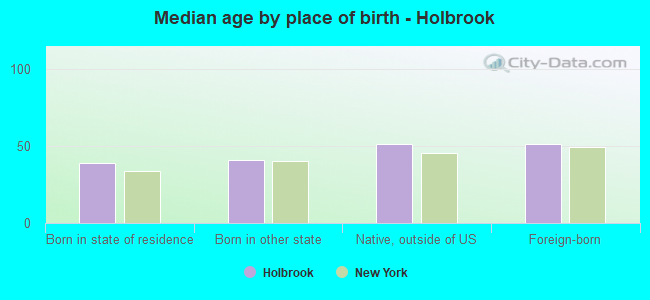
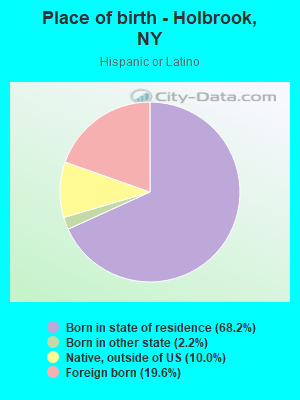
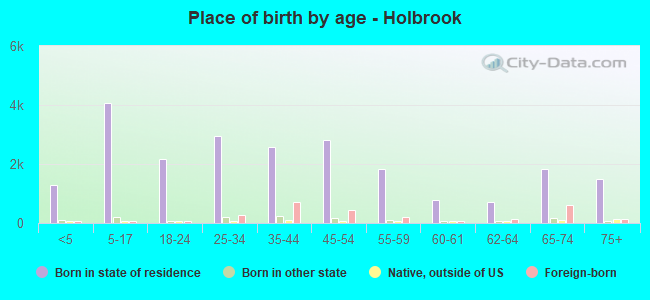
Place of birth - Born in state of residence (%)
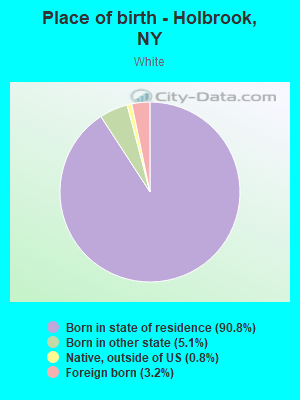
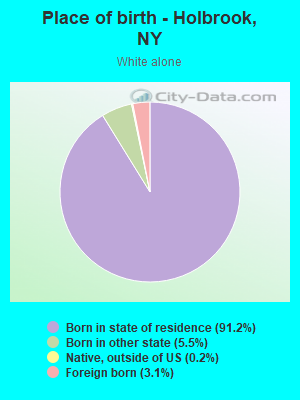
Place of birth - Born in state of residence (%) - White
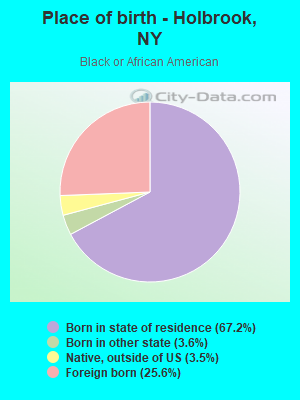
Place of birth - Born in state of residence (%) - Black or African American
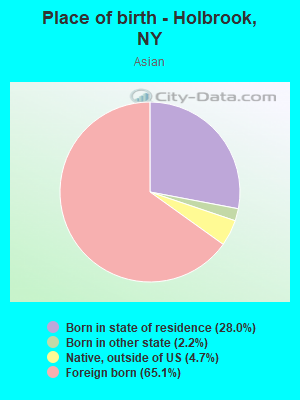
Place of birth - Born in state of residence (%) - Asian
Place of birth - Born in state of residence (%) - Hispanic or Latino
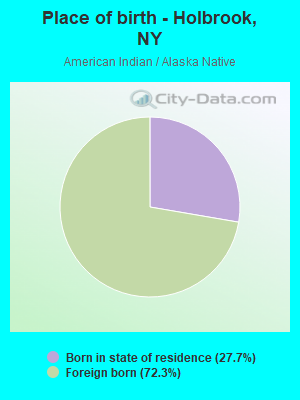
Place of birth - Born in state of residence (%) - American Indian and Alaska Native
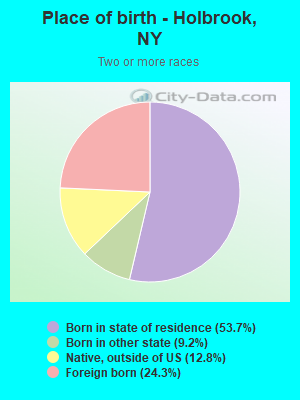
Place of birth - Born in state of residence (%) - Multirace
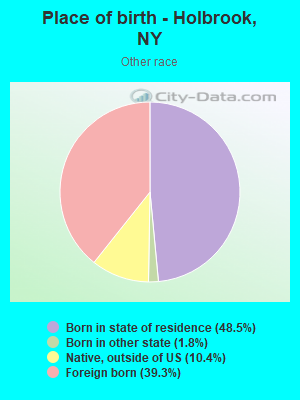
Place of birth - Born in state of residence (%) - Other Race
Place of birth - Born in other state (%)
Place of birth - Born in other state (%) - White
Place of birth - Born in other state (%) - Black or African American
Place of birth - Born in other state (%) - Asian
Place of birth - Born in other state (%) - Hispanic or Latino
Place of birth - Born in other state (%) - American Indian and Alaska Native
Place of birth - Born in other state (%) - Multirace
Place of birth - Born in other state (%) - Other Race
Place of birth - Native, outside of US (%)
Place of birth - Native, outside of US (%) - White
Place of birth - Native, outside of US (%) - Black or African American
Place of birth - Native, outside of US (%) - Asian
Place of birth - Native, outside of US (%) - Hispanic or Latino
Place of birth - Native, outside of US (%) - American Indian and Alaska Native
Place of birth - Native, outside of US (%) - Multirace
Place of birth - Native, outside of US (%) - Other Race
Place of birth - Foreign born (%)
Place of birth - Foreign born (%) - White
Place of birth - Foreign born (%) - Black or African American
Place of birth - Foreign born (%) - Asian
Place of birth - Foreign born (%) - Hispanic or Latino
Place of birth - Foreign born (%) - American Indian and Alaska Native
Place of birth - Foreign born (%) - Multirace
Place of birth - Foreign born (%) - Other Race
Residents speaking English at home (%)
Residents speaking English at home - Born in the United States (%)
Residents speaking English at home - Native, born elsewhere (%)
Residents speaking English at home - Foreign born (%)
Residents speaking Spanish at home (%)
Residents speaking Spanish at home - Born in the United States (%)
Residents speaking Spanish at home - Native, born elsewhere (%)
Residents speaking Spanish at home - Foreign born (%)
Residents speaking other language at home (%)
Residents speaking other language at home - Born in the United States (%)
Residents speaking other language at home - Native, born elsewhere (%)
Residents speaking other language at home - Foreign born (%)
Marital status - Never married (%)
Marital status - Now married (%)
Marital status - Separated (%)
Marital status - Widowed (%)
Marital status - Divorced (%)
Ancestries Reported - Arab (%)
Ancestries Reported - Czech (%)
Ancestries Reported - Danish (%)
Ancestries Reported - Dutch (%)
Ancestries Reported - English (%)
Ancestries Reported - French (%)
Ancestries Reported - French Canadian (%)
Ancestries Reported - German (%)
Ancestries Reported - Greek (%)
Ancestries Reported - Hungarian (%)
Ancestries Reported - Irish (%)
Ancestries Reported - Italian (%)
Ancestries Reported - Lithuanian (%)
Ancestries Reported - Norwegian (%)
Ancestries Reported - Polish (%)
Ancestries Reported - Portuguese (%)
Ancestries Reported - Russian (%)
Ancestries Reported - Scotch-Irish (%)
Ancestries Reported - Scottish (%)
Ancestries Reported - Slovak (%)
Ancestries Reported - Subsaharan African (%)
Ancestries Reported - Swedish (%)
Ancestries Reported - Swiss (%)
Ancestries Reported - Ukrainian (%)
Ancestries Reported - United States (%)
Ancestries Reported - Welsh (%)
Ancestries Reported - West Indian (%)
Ancestries Reported - Other (%)
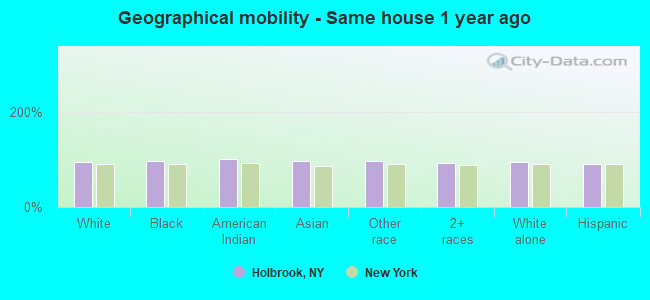
Geographical mobility - Same house 1 year ago (%)
Geographical mobility - Same house 1 year ago (%) - White
Geographical mobility - Same house 1 year ago (%) - Black or African American
Geographical mobility - Same house 1 year ago (%) - Asian
Geographical mobility - Same house 1 year ago (%) - Hispanic or Latino
Geographical mobility - Same house 1 year ago (%) - American Indian and Alaska Native
Geographical mobility - Same house 1 year ago (%) - Multirace
Geographical mobility - Same house 1 year ago (%) - Other Race
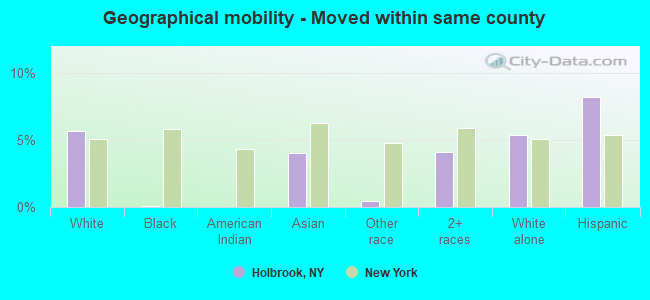
Geographical mobility - Moved within same county (%)
Geographical mobility - Moved within same county (%) - White
Geographical mobility - Moved within same county (%) - Black or African American
Geographical mobility - Moved within same county (%) - Asian
Geographical mobility - Moved within same county (%) - Hispanic or Latino
Geographical mobility - Moved within same county (%) - American Indian and Alaska Native
Geographical mobility - Moved within same county (%) - Multirace
Geographical mobility - Moved within same county (%) - Other Race
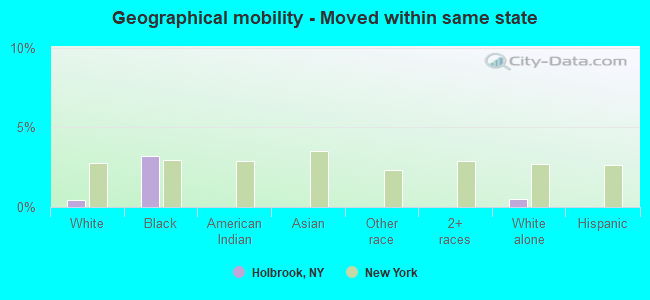
Geographical mobility - Moved from different county within same state (%)
Geographical mobility - Moved from different county within same state (%) - White
Geographical mobility - Moved from different county within same state (%) - Black or African American
Geographical mobility - Moved from different county within same state (%) - Asian
Geographical mobility - Moved from different county within same state (%) - Hispanic or Latino
Geographical mobility - Moved from different county within same state (%) - American Indian and Alaska Native
Geographical mobility - Moved from different county within same state (%) - Multirace
Geographical mobility - Moved from different county within same state (%) - Other Race
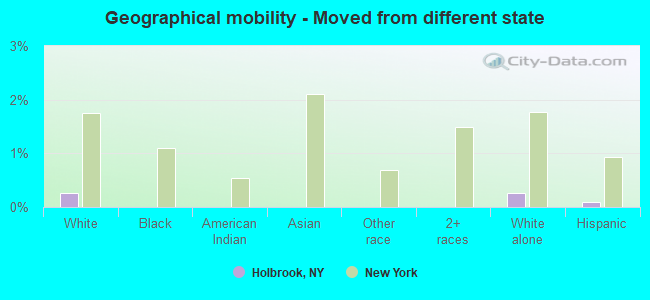
Geographical mobility - Moved from different state (%)
Geographical mobility - Moved from different state (%) - White
Geographical mobility - Moved from different state (%) - Black or African American
Geographical mobility - Moved from different state (%) - Asian
Geographical mobility - Moved from different state (%) - Hispanic or Latino
Geographical mobility - Moved from different state (%) - American Indian and Alaska Native
Geographical mobility - Moved from different state (%) - Multirace
Geographical mobility - Moved from different state (%) - Other Race
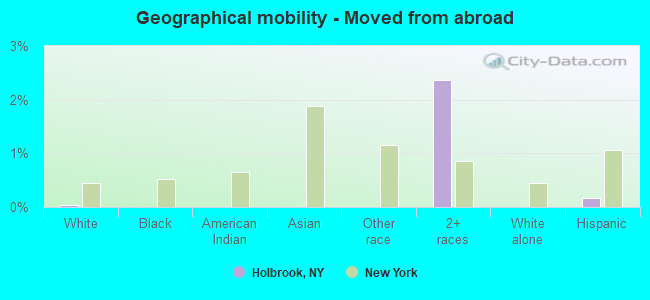
Geographical mobility - Moved from abroad (%)
Geographical mobility - Moved from abroad (%) - White
Geographical mobility - Moved from abroad (%) - Black or African American
Geographical mobility - Moved from abroad (%) - Asian
Geographical mobility - Moved from abroad (%) - Hispanic or Latino
Geographical mobility - Moved from abroad (%) - American Indian and Alaska Native
Geographical mobility - Moved from abroad (%) - Multirace
Geographical mobility - Moved from abroad (%) - Other Race
Place of birth for the foreign-born population - Ireland (%)
Place of birth for the foreign-born population - Denmark (%)
Place of birth for the foreign-born population - Norway (%)
Place of birth for the foreign-born population - Sweden (%)
Place of birth for the foreign-born population - United Kingdom (%)
Place of birth for the foreign-born population - England (%)
Place of birth for the foreign-born population - Scotland (%)
Place of birth for the foreign-born population - Other Northern Europe (%)
Place of birth for the foreign-born population - Austria (%)
Place of birth for the foreign-born population - Belgium (%)
Place of birth for the foreign-born population - France (%)
Place of birth for the foreign-born population - Germany (%)
Place of birth for the foreign-born population - Netherlands (%)
Place of birth for the foreign-born population - Switzerland (%)
Place of birth for the foreign-born population - Other Western Europe (%)
Place of birth for the foreign-born population - Greece (%)
Place of birth for the foreign-born population - Italy (%)
Place of birth for the foreign-born population - Portugal (%)
Place of birth for the foreign-born population - Spain (%)
Place of birth for the foreign-born population - Other Southern Europe (%)
Place of birth for the foreign-born population - Albania (%)
Place of birth for the foreign-born population - Belarus (%)
Place of birth for the foreign-born population - Bosnia and Herzegovina (%)
Place of birth for the foreign-born population - Bulgaria (%)
Place of birth for the foreign-born population - Croatia (%)
Place of birth for the foreign-born population - Czechoslovakia (%)
Place of birth for the foreign-born population - Hungary (%)
Place of birth for the foreign-born population - Latvia (%)
Place of birth for the foreign-born population - Lithuania (%)
Place of birth for the foreign-born population - North Macedonia (Macedonia) (%)
Place of birth for the foreign-born population - Moldova (%)
Place of birth for the foreign-born population - Poland (%)
Place of birth for the foreign-born population - Romania (%)
Place of birth for the foreign-born population - Russia (%)
Place of birth for the foreign-born population - Serbia (%)
Place of birth for the foreign-born population - Ukraine (%)
Place of birth for the foreign-born population - Other Eastern Europe (%)
Place of birth for the foreign-born population - China (%)
Place of birth for the foreign-born population - Hong Kong (%)
Place of birth for the foreign-born population - Taiwan (%)
Place of birth for the foreign-born population - Japan (%)
Place of birth for the foreign-born population - Korea (%)
Place of birth for the foreign-born population - Other Eastern Asia (%)
Place of birth for the foreign-born population - Afghanistan (%)
Place of birth for the foreign-born population - Bangladesh (%)
Place of birth for the foreign-born population - India (%)
Place of birth for the foreign-born population - Iran (%)
Place of birth for the foreign-born population - Kazakhstan (%)
Place of birth for the foreign-born population - Nepal (%)
Place of birth for the foreign-born population - Pakistan (%)
Place of birth for the foreign-born population - Sri Lanka (%)
Place of birth for the foreign-born population - Uzbekistan (%)
Place of birth for the foreign-born population - Other South Central Asia (%)
Place of birth for the foreign-born population - Burma (%)
Place of birth for the foreign-born population - Cambodia (%)
Place of birth for the foreign-born population - Indonesia (%)
Place of birth for the foreign-born population - Laos (%)
Place of birth for the foreign-born population - Malaysia (%)
Place of birth for the foreign-born population - Philippines (%)
Place of birth for the foreign-born population - Singapore (%)
Place of birth for the foreign-born population - Thailand (%)
Place of birth for the foreign-born population - Vietnam (%)
Place of birth for the foreign-born population - Other South Eastern Asia (%)
Place of birth for the foreign-born population - Armenia (%)
Place of birth for the foreign-born population - Iraq (%)
Place of birth for the foreign-born population - Israel (%)
Place of birth for the foreign-born population - Jordan (%)
Place of birth for the foreign-born population - Kuwait (%)
Place of birth for the foreign-born population - Lebanon (%)
Place of birth for the foreign-born population - Saudi Arabia (%)
Place of birth for the foreign-born population - Syria (%)
Place of birth for the foreign-born population - Turkey (%)
Place of birth for the foreign-born population - Yemen (%)
Place of birth for the foreign-born population - Other Western Asia (%)
Place of birth for the foreign-born population - Eritrea (%)
Place of birth for the foreign-born population - Ethiopia (%)
Place of birth for the foreign-born population - Kenya (%)
Place of birth for the foreign-born population - Somalia (%)
Place of birth for the foreign-born population - Uganda (%)
Place of birth for the foreign-born population - Zimbabwe (%)
Place of birth for the foreign-born population - Other Eastern Africa (%)
Place of birth for the foreign-born population - Cameroon (%)
Place of birth for the foreign-born population - Congo (%)
Place of birth for the foreign-born population - Democratic Republic of Congo (Zaire) (%)
Place of birth for the foreign-born population - Other Middle Africa (%)
Place of birth for the foreign-born population - Egypt (%)
Place of birth for the foreign-born population - Morocco (%)
Place of birth for the foreign-born population - Sudan (%)
Place of birth for the foreign-born population - Other Northern Africa (%)
Place of birth for the foreign-born population - South Africa (%)
Place of birth for the foreign-born population - Other Southern Africa (%)
Place of birth for the foreign-born population - Cabo Verde (%)
Place of birth for the foreign-born population - Ghana (%)
Place of birth for the foreign-born population - Liberia (%)
Place of birth for the foreign-born population - Nigeria (%)
Place of birth for the foreign-born population - Senegal (%)
Place of birth for the foreign-born population - Sierra Leone (%)
Place of birth for the foreign-born population - Other Western Africa (%)
Place of birth for the foreign-born population - Australia (%)
Place of birth for the foreign-born population - New Zealand (%)
Place of birth for the foreign-born population - Fiji (%)
Place of birth for the foreign-born population - Micronesia (%)
Place of birth for the foreign-born population - Bahamas (%)
Place of birth for the foreign-born population - Barbados (%)
Place of birth for the foreign-born population - Cuba (%)
Place of birth for the foreign-born population - Dominica (%)
Place of birth for the foreign-born population - Dominican Republic (%)
Place of birth for the foreign-born population - Grenada (%)
Place of birth for the foreign-born population - Haiti (%)
Place of birth for the foreign-born population - Jamaica (%)
Place of birth for the foreign-born population - St. Vincent and the Grenadines (%)
Place of birth for the foreign-born population - Trinidad and Tobago (%)
Place of birth for the foreign-born population - West Indies (%)
Place of birth for the foreign-born population - Other Caribbean (%)
Place of birth for the foreign-born population - Belize (%)
Place of birth for the foreign-born population - Costa Rica (%)
Place of birth for the foreign-born population - El Salvador (%)
Place of birth for the foreign-born population - Guatemala (%)
Place of birth for the foreign-born population - Honduras (%)
Place of birth for the foreign-born population - Mexico (%)
Place of birth for the foreign-born population - Nicaragua (%)
Place of birth for the foreign-born population - Panama (%)
Place of birth for the foreign-born population - Other Central America (%)
Place of birth for the foreign-born population - Argentina (%)
Place of birth for the foreign-born population - Bolivia (%)
Place of birth for the foreign-born population - Brazil (%)
Place of birth for the foreign-born population - Chile (%)
Place of birth for the foreign-born population - Colombia (%)
Place of birth for the foreign-born population - Ecuador (%)
Place of birth for the foreign-born population - Guyana (%)
Place of birth for the foreign-born population - Peru (%)
Place of birth for the foreign-born population - Uruguay (%)
Place of birth for the foreign-born population - Venezuela (%)
Place of birth for the foreign-born population - Other South America (%)
Place of birth for the foreign-born population - Canada (%)
Place of birth for the foreign-born population - Other Northern America (%)
Place of birth for the foreign-born population - Other (%)
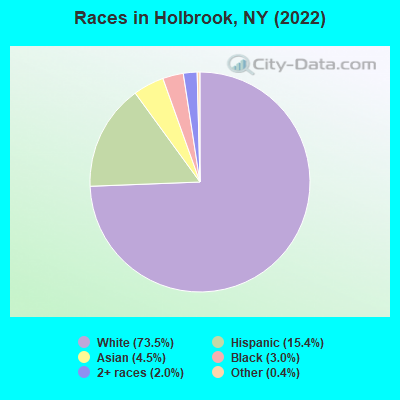
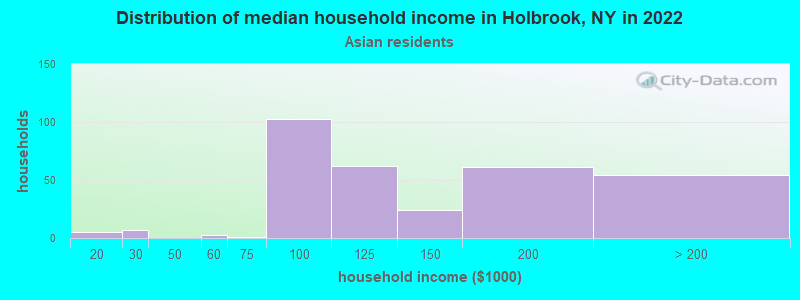
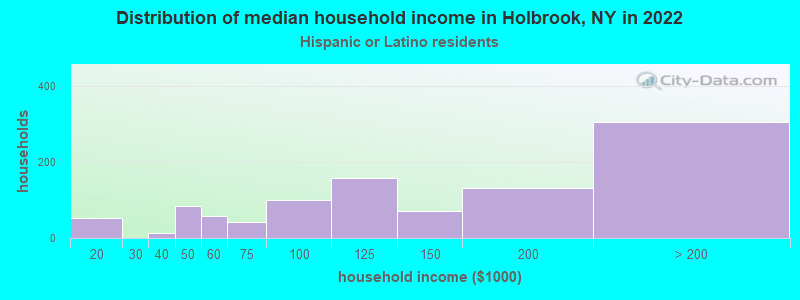
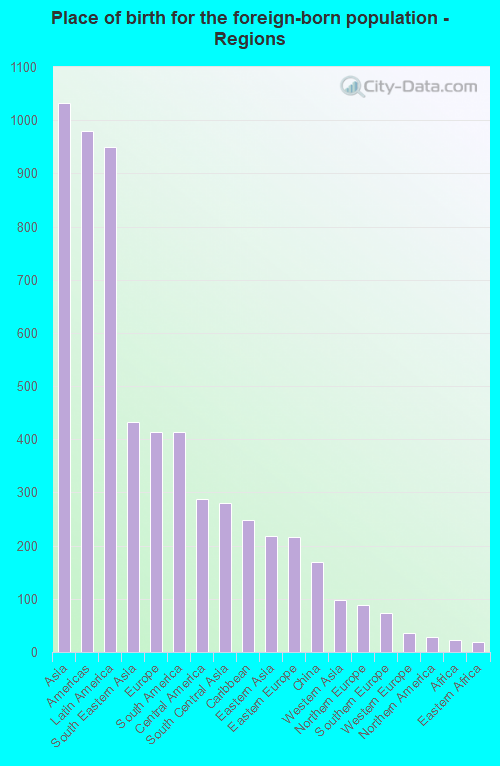
According to 2022 data, the most numerous races in Holbrook, NY are White alone (20,014 residents), Hispanic (4,188 residents), and Black alone (809 residents). 83.0% of Holbrook residents speak English at home. 9.0% of Holbrook, NY residents are foreign-born (3.8% born in Asia, 3.5% born in Latin America, 1.5% born in Europe), which is 144.6% less than the foreign-born rate of 22.0% across the entire state of New York.
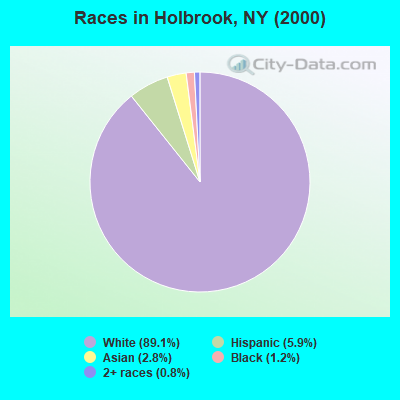
Race distribution in Holbrook
2000 2022
11,760,981 62.0% White alone 2,867,583 15.1% Hispanic 2,812,623 14.8% Black alone 1,035,926 5.5% Asian alone 366,116 1.9% Two or more races 75,499 0.4% Other race alone 52,499 0.3% American Indian alone 5,230 0.03% Native Hawaiian and Other
10,408,933 52.9% White alone 3,867,299 19.7% Hispanic 2,633,840 13.4% Black alone 1,776,286 9.0% Asian alone 732,670 3.7% Two or more races 216,110 1.1% Other race alone 35,082 0.2% American Indian alone 6,931 0.04% Native Hawaiian and Other
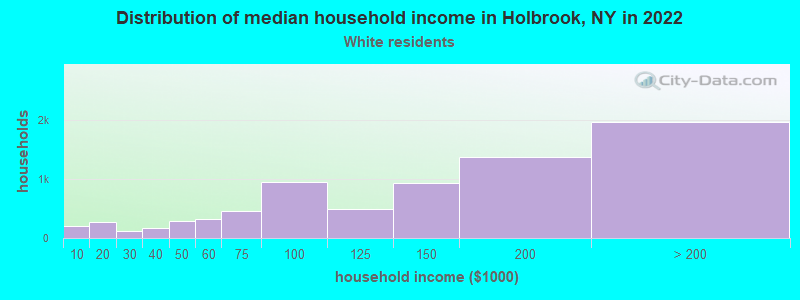
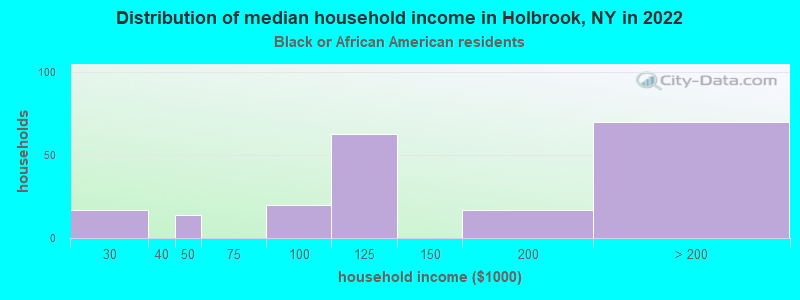
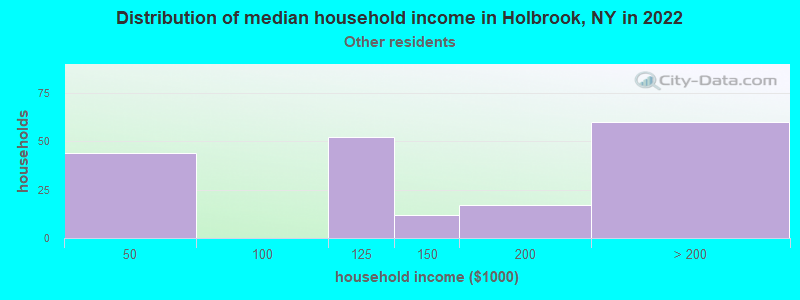
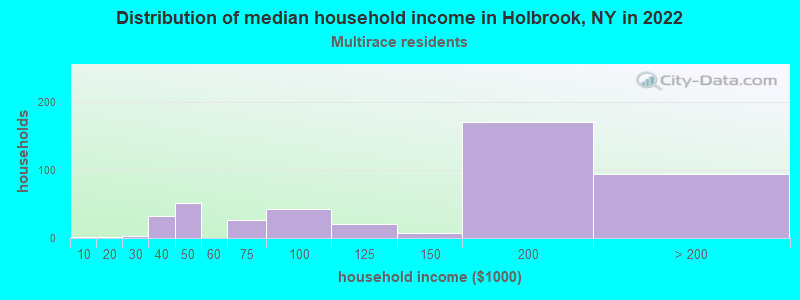
Income and house value in Holbrook Median household income in 2022 $137,960 White non-Hispanic householders$109,214 Black householders$110,540 Asian householders$145,361 Some other race householders$149,357 Two or more races householders$134,564 Hispanic or Latino race householdersMedian 2022 house value $523,010 White Non-Hispanic householders$525,362 Black or African American householders$661,480 American Indian or Alaska Native householders $514,484 Asian householders$549,469 Some other race householders$539,474 Two or more races householders$556,525 Hispanic or Latino householders
Median age by race in Holbrook
43.0 Median age for White residents43.3 42.6 28.8 Median age for Black or African American residents21.4 39.9 56.6 Median age for American Indian / Alaska Native residents-807,017,543.1 -513,692,161.9 44.6 Median age for Asian residents41.5 65.7 -742,816,091.2 Median age for Native Hawaiian / Pacific Islander residents-831,187,409.8 -771,300,447.7 37.5 Median age for Other race residents31.4 39.0 40.5 Median age for Two or more races residents45.7 38.2 44.8 Median age for White alone residents45.6 43.9 33.1 Median age for Hispanic or Latino residents34.5 30.2
Owner/renter occupied households by race in Holbrook
House owners and renters - White residents 6,043 79.9% Owner occupied1,517 20.1% Renter occupiedHouse owners and renters - Black or African American residents 117 53.5% Owner occupied102 46.5% Renter occupiedHouse owners and renters - American Indian / Alaska Native residents 24 100.0% Owner occupiedHouse owners and renters - Asian residents 261 75.0% Owner occupied87 25.0% Renter occupiedHouse owners and renters - Other race residents 76 42.7% Owner occupied102 57.3% Renter occupiedHouse owners and renters - Two or more races residents 456 95.5% Owner occupied22 4.5% Renter occupiedHouse owners and renters - White alone residents 5,715 78.8% Owner occupied1,536 21.2% Renter occupiedHouse owners and renters - Hispanic or Latino residents 814 78.8% Owner occupied219 21.2% Renter occupied
Language usage in Holbrook
English speakers - Total 83.0% of residents of Holbrook speak English at home.
8.3% of residents speak Spanish at home 1,676 78.0% Speak English very well473 22.0% Speak English less than very well7.6% of residents speak other language at home 1,300 66.1% Speak English very well668 33.9% Speak English less than very well
English speakers - Born in the United States 92.0% of residents of Holbrook speak English at home.
2.1% of residents speak Spanish at home 13 54.2% Speak English very well11 45.8% Speak English less than very well5.9% of residents speak other language at home 69 100.0% Speak English very well
English speakers - Native, born elsewhere 16.5% of residents of Holbrook speak English at home.
66.2% of residents speak Spanish at home 258 70.7% Speak English very well107 29.3% Speak English less than very well12.5% of residents speak other language at home 69 100.0% Speak English very well
English speakers - Foreign-born 21.3% of residents of Holbrook speak English at home.
29.4% of residents speak Spanish at home 510 65.6% Speak English very well268 34.4% Speak English less than very well45.7% of residents speak other language at home 590 48.7% Speak English very well621 51.3% Speak English less than very well
White (Caucasian) - Speak only English Native:
95.4% (18,919)Foreign-born:
31.2% (216)
White (Caucasian) - Speak another language Native:
4.7% (941)Foreign-born:
69.2% (478)
Black or African American - Speak only English Native:
91.4% (605)Foreign-born:
91.9% (238)
Black or African American - Speak another language Native:
7.6% (50)Foreign-born:
15.5% (40)
American Indian / Alaska Native - Speak another language Native:
100.0% (29)Foreign-born:
100.0% (83)
Asian - Speak only English Native:
22.9% (84)Foreign-born:
7.3% (58)
Asian - Speak another language Native:
81.3% (300)Foreign-born:
95.6% (767)
Other race - Speak another language Native:
49.2% (108)Foreign-born:
100.0% (163)
Two or more races - Speak only English Native:
63.7% (718)Foreign-born:
10.4% (40)
Two or more races - Speak another language Native:
36.2% (408)Foreign-born:
89.9% (343)
White alone - Speak only English Native:
97.0% (17,881)Foreign-born:
37.6% (227)
White alone - Speak another language Native:
2.9% (535)Foreign-born:
62.4% (376)
Hispanic or Latino - Speak only English Native:
60.4% (1,777)Foreign-born:
1.0% (8)
Hispanic or Latino - Speak another language Native:
40.3% (1,186)Foreign-born:
99.6% (799)
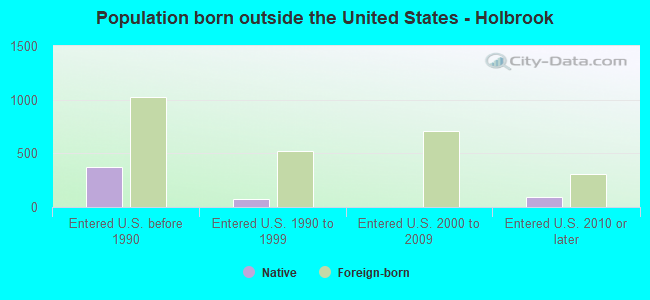
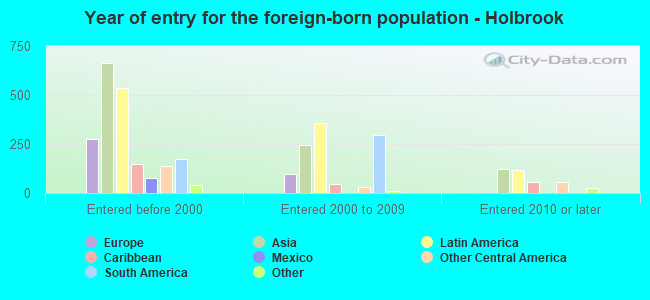
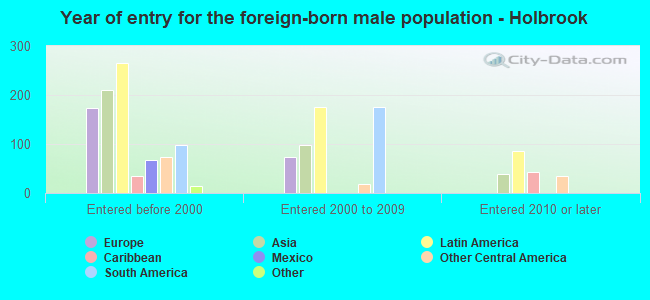
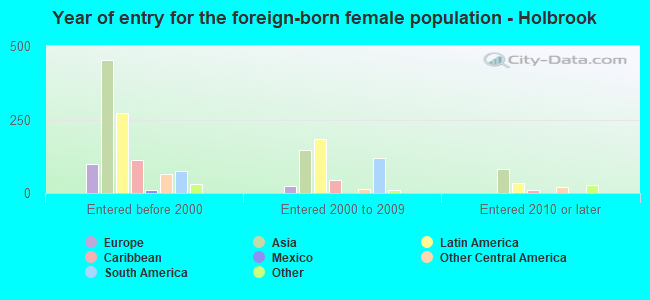
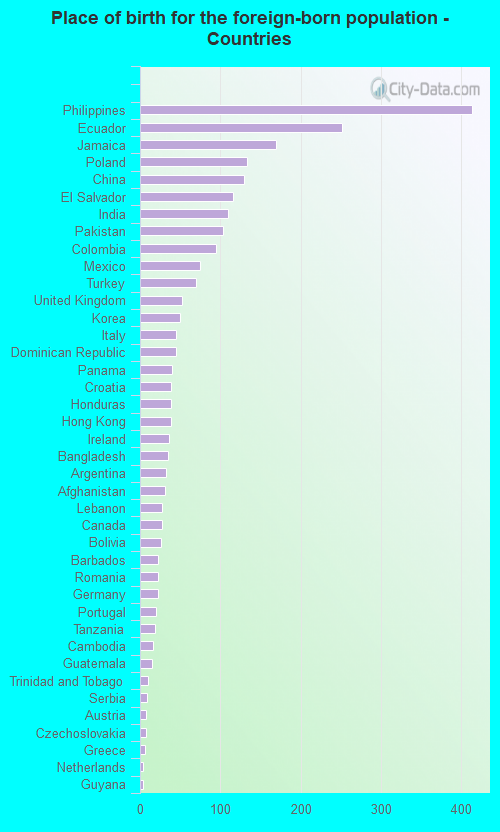
Foreign-born residents in Holbrook 2,450 residents are foreign born (3.8% Asia , 3.5% Latin America , 1.5% Europe ).
This city:
9.0%New York:
22.6%
Marital status for residents in Holbrook Marital status - White (Caucasian) population 15 years and over
Males 34.0% Never married55.1% Now married1.2% Separated1.2% Widowed8.4% DivorcedFemales 30.8% Never married49.5% Now married1.6% Separated8.1% Widowed10.0% DivorcedWomen who gave birth in the past 12 months Now married:
92.0% (129)Unmarried:
8.0% (11)
Women who did not give birth in the past 12 months Now married:
38.7% (1,811)Unmarried:
61.3% (2,864)
Marital status - Black or African American population 15 years and over
Males 62.2% Never married31.9% Now married0.0% Separated0.0% Widowed5.9% DivorcedFemales 60.9% Never married20.2% Now married0.0% Separated12.9% Widowed6.1% DivorcedWomen who gave birth in the past 12 months Now married:
0.0% (0)Unmarried:
100.0% (46)
Women who did not give birth in the past 12 months Now married:
10.2% (25)Unmarried:
89.8% (217)
Marital status - American Indian / Alaska Native population 15 years and over
Males 48.8% Never married0.0% Now married0.0% Separated0.0% Widowed51.2% DivorcedFemales 100.0% Never married0.0% Now married0.0% Separated0.0% Widowed0.0% DivorcedMarital status - Asian population 15 years and over
Males 39.9% Never married60.1% Now married0.0% Separated0.0% Widowed0.0% DivorcedFemales 8.5% Never married75.1% Now married0.0% Separated11.6% Widowed4.7% DivorcedWomen who gave birth in the past 12 months Now married:
100.0% (5)Unmarried:
0.0% (0)
Women who did not give birth in the past 12 months Now married:
76.2% (186)Unmarried:
23.8% (58)
Marital status - Other race population 15 years and over
Males 52.9% Never married47.1% Now married0.0% Separated0.0% Widowed0.0% DivorcedFemales 31.7% Never married55.4% Now married0.0% Separated0.0% Widowed12.9% DivorcedWomen who did not give birth in the past 12 months Now married:
45.7% (54)Unmarried:
54.3% (64)
Marital status - Two or more races population 15 years and over
Males 16.8% Never married82.2% Now married0.0% Separated1.0% Widowed0.0% DivorcedFemales 14.5% Never married71.7% Now married3.9% Separated4.6% Widowed5.3% DivorcedWomen who gave birth in the past 12 months Now married:
100.0% (7)Unmarried:
0.0% (0)
Women who did not give birth in the past 12 months Now married:
74.6% (258)Unmarried:
25.4% (88)
Marital status - White alone, not Hispanic / Latino population 15 years and over
Males 33.4% Never married55.0% Now married1.2% Separated1.3% Widowed9.1% DivorcedFemales 30.7% Never married49.2% Now married1.4% Separated7.9% Widowed10.9% DivorcedWomen who gave birth in the past 12 months Now married:
99.3% (140)Unmarried:
0.7% (1)
Women who did not give birth in the past 12 months Now married:
36.0% (1,622)Unmarried:
64.0% (2,889)
Marital status - Hispanic or Latino population 15 years and over
Males 35.6% Never married60.0% Now married1.3% Separated0.3% Widowed2.8% DivorcedFemales 28.1% Never married55.5% Now married4.4% Separated8.4% Widowed3.6% DivorcedWomen who gave birth in the past 12 months Now married:
29.4% (5)Unmarried:
70.6% (12)
Women who did not give birth in the past 12 months Now married:
63.4% (487)Unmarried:
36.6% (282)
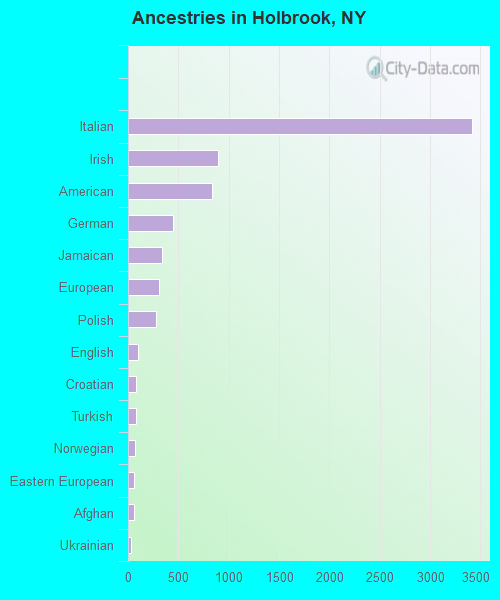
Ancestries in Holbrook
3,414 30.7% Italian898 8.1% Irish835 7.5% American449 4.0% German335 3.0% Jamaican312 2.8% European274 2.5% Polish99 0.9% English82 0.7% Croatian76 0.7% Turkish69 0.6% Norwegian64 0.6% Eastern European55 0.5% Afghan32 0.3% Ukrainian31 0.3% Scotch-Irish29 0.3% French Canadian25 0.2% Romanian24 0.2% Scottish22 0.2% Russian22 0.2% Barbadian20 0.2% Iraqi20 0.2% Lebanese13 0.1% Serbian12 0.1% Greek12 0.1% Swedish12 0.1% Welsh9 0.08% Portuguese8 0.07% British8 0.07% Hungarian6 0.05% Austrian6 0.05% Maltese5 0.05% Dutch4 0.04% Czech
Geographical mobility in Holbrook Same house 1 year ago 19,890 93.7% White (Caucasian)945 96.7% Black or African American83 100.0% American Indian / Alaska Native1,175 96.6% Asian400 96.9% Other race1,458 92.9% Two or more races18,651 94.0% White alone, not Hispanic / Latino3,771 91.2% Hispanic or LatinoMoved within same county 1,198 5.6% White / Caucasian1 0.1% Black or African American49 4.0% Asian2 0.4% Other race64 4.1% Two or more races1,065 5.4% White alone, not Hispanic / Latino340 8.2% Hispanic or LatinoMoved within same state 92 0.4% White / Caucasian31 3.2% Black or African American97 0.5% White alone, not Hispanic / LatinoMoved from different state 54 0.3% White / Caucasian51 0.3% White alone, not Hispanic / Latino4 0.1% Hispanic or LatinoMoved from abroad 6 0.0% White37 2.4% Two or more races7 0.2% Hispanic or Latino
Children Nativity (place of birth) in Holbrook
Children under 6 years - Living with two parents Both parents native 1,276 100.0% NativeBoth parents foreign-born 26 100.0% NativeOne native, one foreign-born parent 46 100.0% NativeChildren under 6 years - Living with one parent Native parent 315 100.0% NativeForeign-born parent 27 100.0% NativeChildren 6 to 17 years - Living with two parents Both parents native 2,238 100.0% Native0 0.0% Foreign-bornBoth parents foreign-born 434 96.4% Native16 3.6% Foreign-bornOne native, one foreign-born parent 242 100.0% NativeChildren 6 to 17 years - Living with one parent Native parent 912 100.0% NativeForeign-born parent 67 51.5% Native63 48.5% Foreign-born
Grandparents responsible for own grandchildren in Holbrook
Grandparents (30 to 59 years) White / Caucasian 33 31.9% Responsible for grandchildren71 68.1% Not responsible for grandchildrenAsian 9 100.0% Responsible for grandchildrenTwo or more races 74 100.0% Not responsible for grandchildrenWhite alone, not Hispanic / Latino 32 30.3% Responsible for grandchildren74 69.7% Not responsible for grandchildrenHispanic or Latino 39 100.0% Not responsible for grandchildren
Grandparents (60 years and over) White / Caucasian 321 100.0% Not responsible for grandchildrenWhite alone, not Hispanic / Latino 291 100.0% Not responsible for grandchildrenHispanic or Latino 120 100.0% Not responsible for grandchildren