Races in Holland, Michigan (MI) Detailed Stats
Data:
Races - White alone (%)
Races - White alone (% change since 2000)
Races - Black alone (%)
Races - Black alone (% change since 2000)
Races - American Indian alone (%)
Races - American Indian alone (% change since 2000)
Races - Asian alone (%)
Races - Asian alone (% change since 2000)
Races - Hispanic (%)
Races - Hispanic (% change since 2000)
Races - Native Hawaiian and Other Pacific Islander alone (%)
Races - Native Hawaiian and Other Pacific Islander alone (% change since 2000)
Races - Two or more races(%)
Races - Two or more races(% change since 2000)
Races - Other race alone (%)
Races - Other race alone (% change since 2000)
Racial diversity
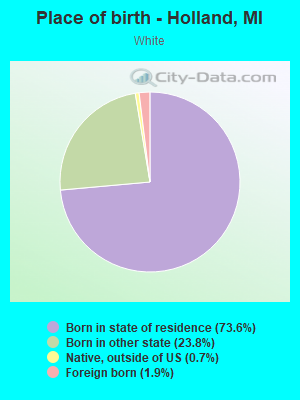
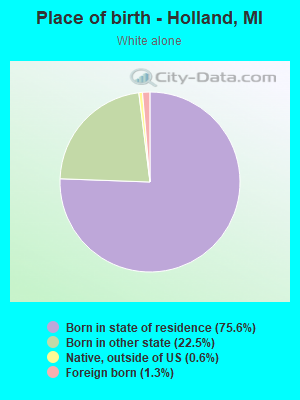
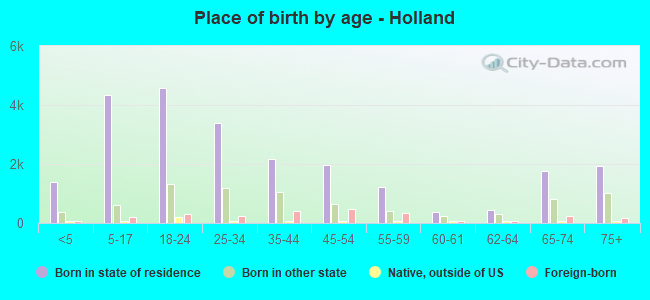
Place of birth - Born in state of residence (%)
Place of birth - Born in state of residence (%) - White
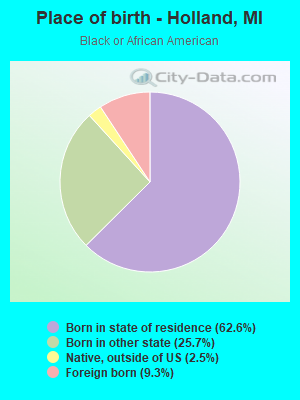
Place of birth - Born in state of residence (%) - Black or African American
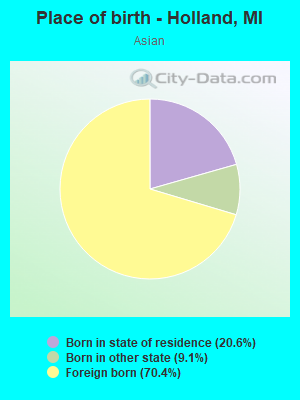
Place of birth - Born in state of residence (%) - Asian
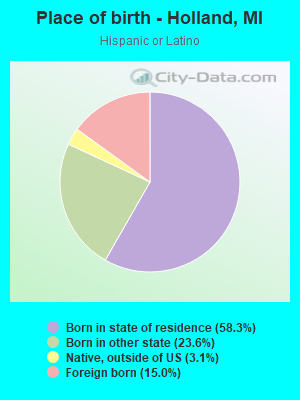
Place of birth - Born in state of residence (%) - Hispanic or Latino
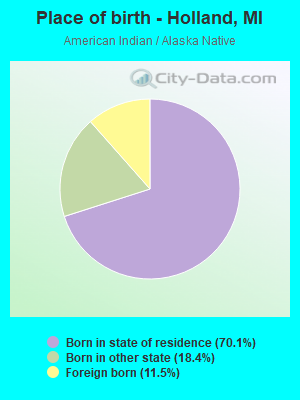
Place of birth - Born in state of residence (%) - American Indian and Alaska Native
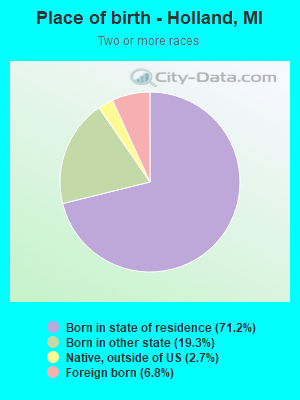
Place of birth - Born in state of residence (%) - Multirace
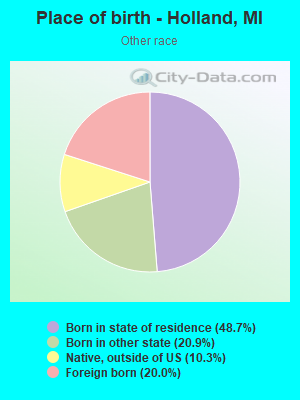
Place of birth - Born in state of residence (%) - Other Race
Place of birth - Born in other state (%)
Place of birth - Born in other state (%) - White
Place of birth - Born in other state (%) - Black or African American
Place of birth - Born in other state (%) - Asian
Place of birth - Born in other state (%) - Hispanic or Latino
Place of birth - Born in other state (%) - American Indian and Alaska Native
Place of birth - Born in other state (%) - Multirace
Place of birth - Born in other state (%) - Other Race
Place of birth - Native, outside of US (%)
Place of birth - Native, outside of US (%) - White
Place of birth - Native, outside of US (%) - Black or African American
Place of birth - Native, outside of US (%) - Asian
Place of birth - Native, outside of US (%) - Hispanic or Latino
Place of birth - Native, outside of US (%) - American Indian and Alaska Native
Place of birth - Native, outside of US (%) - Multirace
Place of birth - Native, outside of US (%) - Other Race
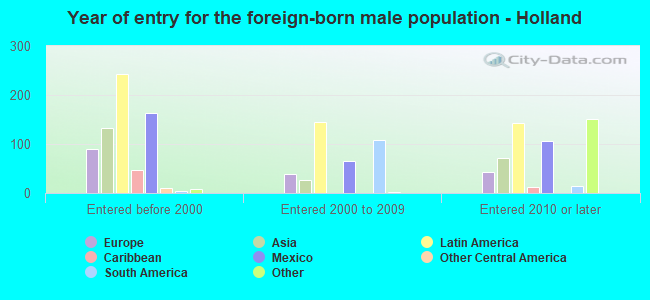
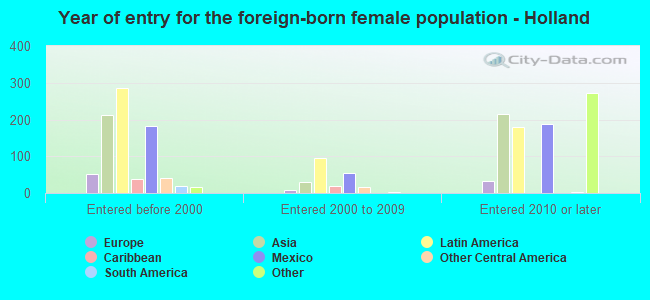
Place of birth - Foreign born (%)
Place of birth - Foreign born (%) - White
Place of birth - Foreign born (%) - Black or African American
Place of birth - Foreign born (%) - Asian
Place of birth - Foreign born (%) - Hispanic or Latino
Place of birth - Foreign born (%) - American Indian and Alaska Native
Place of birth - Foreign born (%) - Multirace
Place of birth - Foreign born (%) - Other Race
Residents speaking English at home (%)
Residents speaking English at home - Born in the United States (%)
Residents speaking English at home - Native, born elsewhere (%)
Residents speaking English at home - Foreign born (%)
Residents speaking Spanish at home (%)
Residents speaking Spanish at home - Born in the United States (%)
Residents speaking Spanish at home - Native, born elsewhere (%)
Residents speaking Spanish at home - Foreign born (%)
Residents speaking other language at home (%)
Residents speaking other language at home - Born in the United States (%)
Residents speaking other language at home - Native, born elsewhere (%)
Residents speaking other language at home - Foreign born (%)
Marital status - Never married (%)
Marital status - Now married (%)
Marital status - Separated (%)
Marital status - Widowed (%)
Marital status - Divorced (%)
Ancestries Reported - Arab (%)
Ancestries Reported - Czech (%)
Ancestries Reported - Danish (%)
Ancestries Reported - Dutch (%)
Ancestries Reported - English (%)
Ancestries Reported - French (%)
Ancestries Reported - French Canadian (%)
Ancestries Reported - German (%)
Ancestries Reported - Greek (%)
Ancestries Reported - Hungarian (%)
Ancestries Reported - Irish (%)
Ancestries Reported - Italian (%)
Ancestries Reported - Lithuanian (%)
Ancestries Reported - Norwegian (%)
Ancestries Reported - Polish (%)
Ancestries Reported - Portuguese (%)
Ancestries Reported - Russian (%)
Ancestries Reported - Scotch-Irish (%)
Ancestries Reported - Scottish (%)
Ancestries Reported - Slovak (%)
Ancestries Reported - Subsaharan African (%)
Ancestries Reported - Swedish (%)
Ancestries Reported - Swiss (%)
Ancestries Reported - Ukrainian (%)
Ancestries Reported - United States (%)
Ancestries Reported - Welsh (%)
Ancestries Reported - West Indian (%)
Ancestries Reported - Other (%)
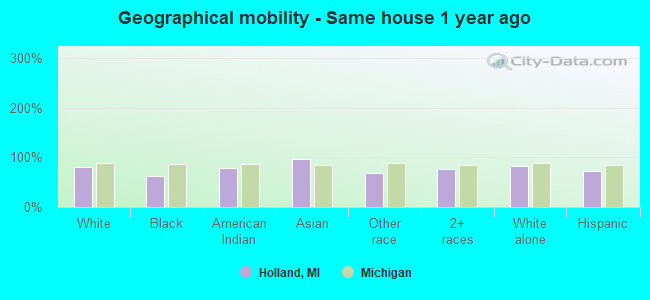
Geographical mobility - Same house 1 year ago (%)
Geographical mobility - Same house 1 year ago (%) - White
Geographical mobility - Same house 1 year ago (%) - Black or African American
Geographical mobility - Same house 1 year ago (%) - Asian
Geographical mobility - Same house 1 year ago (%) - Hispanic or Latino
Geographical mobility - Same house 1 year ago (%) - American Indian and Alaska Native
Geographical mobility - Same house 1 year ago (%) - Multirace
Geographical mobility - Same house 1 year ago (%) - Other Race
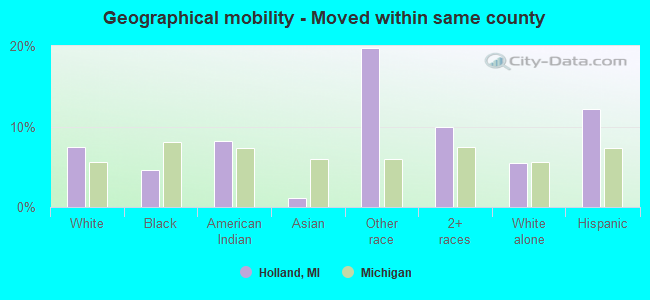
Geographical mobility - Moved within same county (%)
Geographical mobility - Moved within same county (%) - White
Geographical mobility - Moved within same county (%) - Black or African American
Geographical mobility - Moved within same county (%) - Asian
Geographical mobility - Moved within same county (%) - Hispanic or Latino
Geographical mobility - Moved within same county (%) - American Indian and Alaska Native
Geographical mobility - Moved within same county (%) - Multirace
Geographical mobility - Moved within same county (%) - Other Race
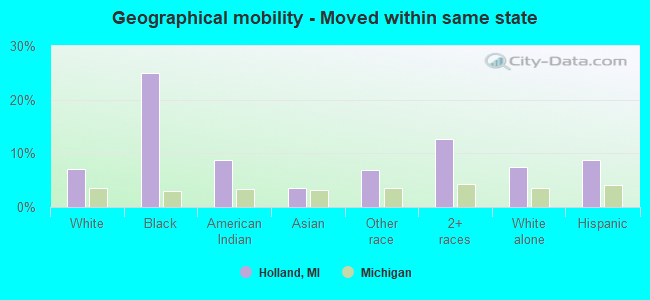
Geographical mobility - Moved from different county within same state (%)
Geographical mobility - Moved from different county within same state (%) - White
Geographical mobility - Moved from different county within same state (%) - Black or African American
Geographical mobility - Moved from different county within same state (%) - Asian
Geographical mobility - Moved from different county within same state (%) - Hispanic or Latino
Geographical mobility - Moved from different county within same state (%) - American Indian and Alaska Native
Geographical mobility - Moved from different county within same state (%) - Multirace
Geographical mobility - Moved from different county within same state (%) - Other Race
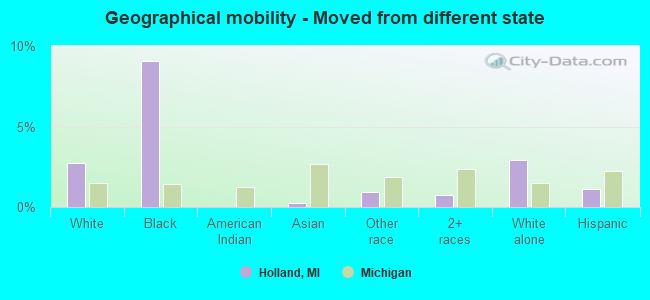
Geographical mobility - Moved from different state (%)
Geographical mobility - Moved from different state (%) - White
Geographical mobility - Moved from different state (%) - Black or African American
Geographical mobility - Moved from different state (%) - Asian
Geographical mobility - Moved from different state (%) - Hispanic or Latino
Geographical mobility - Moved from different state (%) - American Indian and Alaska Native
Geographical mobility - Moved from different state (%) - Multirace
Geographical mobility - Moved from different state (%) - Other Race
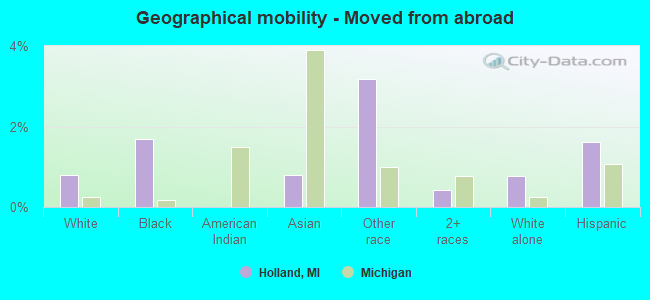
Geographical mobility - Moved from abroad (%)
Geographical mobility - Moved from abroad (%) - White
Geographical mobility - Moved from abroad (%) - Black or African American
Geographical mobility - Moved from abroad (%) - Asian
Geographical mobility - Moved from abroad (%) - Hispanic or Latino
Geographical mobility - Moved from abroad (%) - American Indian and Alaska Native
Geographical mobility - Moved from abroad (%) - Multirace
Geographical mobility - Moved from abroad (%) - Other Race
Place of birth for the foreign-born population - Ireland (%)
Place of birth for the foreign-born population - Denmark (%)
Place of birth for the foreign-born population - Norway (%)
Place of birth for the foreign-born population - Sweden (%)
Place of birth for the foreign-born population - United Kingdom (%)
Place of birth for the foreign-born population - England (%)
Place of birth for the foreign-born population - Scotland (%)
Place of birth for the foreign-born population - Other Northern Europe (%)
Place of birth for the foreign-born population - Austria (%)
Place of birth for the foreign-born population - Belgium (%)
Place of birth for the foreign-born population - France (%)
Place of birth for the foreign-born population - Germany (%)
Place of birth for the foreign-born population - Netherlands (%)
Place of birth for the foreign-born population - Switzerland (%)
Place of birth for the foreign-born population - Other Western Europe (%)
Place of birth for the foreign-born population - Greece (%)
Place of birth for the foreign-born population - Italy (%)
Place of birth for the foreign-born population - Portugal (%)
Place of birth for the foreign-born population - Spain (%)
Place of birth for the foreign-born population - Other Southern Europe (%)
Place of birth for the foreign-born population - Albania (%)
Place of birth for the foreign-born population - Belarus (%)
Place of birth for the foreign-born population - Bosnia and Herzegovina (%)
Place of birth for the foreign-born population - Bulgaria (%)
Place of birth for the foreign-born population - Croatia (%)
Place of birth for the foreign-born population - Czechoslovakia (%)
Place of birth for the foreign-born population - Hungary (%)
Place of birth for the foreign-born population - Latvia (%)
Place of birth for the foreign-born population - Lithuania (%)
Place of birth for the foreign-born population - North Macedonia (Macedonia) (%)
Place of birth for the foreign-born population - Moldova (%)
Place of birth for the foreign-born population - Poland (%)
Place of birth for the foreign-born population - Romania (%)
Place of birth for the foreign-born population - Russia (%)
Place of birth for the foreign-born population - Serbia (%)
Place of birth for the foreign-born population - Ukraine (%)
Place of birth for the foreign-born population - Other Eastern Europe (%)
Place of birth for the foreign-born population - China (%)
Place of birth for the foreign-born population - Hong Kong (%)
Place of birth for the foreign-born population - Taiwan (%)
Place of birth for the foreign-born population - Japan (%)
Place of birth for the foreign-born population - Korea (%)
Place of birth for the foreign-born population - Other Eastern Asia (%)
Place of birth for the foreign-born population - Afghanistan (%)
Place of birth for the foreign-born population - Bangladesh (%)
Place of birth for the foreign-born population - India (%)
Place of birth for the foreign-born population - Iran (%)
Place of birth for the foreign-born population - Kazakhstan (%)
Place of birth for the foreign-born population - Nepal (%)
Place of birth for the foreign-born population - Pakistan (%)
Place of birth for the foreign-born population - Sri Lanka (%)
Place of birth for the foreign-born population - Uzbekistan (%)
Place of birth for the foreign-born population - Other South Central Asia (%)
Place of birth for the foreign-born population - Burma (%)
Place of birth for the foreign-born population - Cambodia (%)
Place of birth for the foreign-born population - Indonesia (%)
Place of birth for the foreign-born population - Laos (%)
Place of birth for the foreign-born population - Malaysia (%)
Place of birth for the foreign-born population - Philippines (%)
Place of birth for the foreign-born population - Singapore (%)
Place of birth for the foreign-born population - Thailand (%)
Place of birth for the foreign-born population - Vietnam (%)
Place of birth for the foreign-born population - Other South Eastern Asia (%)
Place of birth for the foreign-born population - Armenia (%)
Place of birth for the foreign-born population - Iraq (%)
Place of birth for the foreign-born population - Israel (%)
Place of birth for the foreign-born population - Jordan (%)
Place of birth for the foreign-born population - Kuwait (%)
Place of birth for the foreign-born population - Lebanon (%)
Place of birth for the foreign-born population - Saudi Arabia (%)
Place of birth for the foreign-born population - Syria (%)
Place of birth for the foreign-born population - Turkey (%)
Place of birth for the foreign-born population - Yemen (%)
Place of birth for the foreign-born population - Other Western Asia (%)
Place of birth for the foreign-born population - Eritrea (%)
Place of birth for the foreign-born population - Ethiopia (%)
Place of birth for the foreign-born population - Kenya (%)
Place of birth for the foreign-born population - Somalia (%)
Place of birth for the foreign-born population - Uganda (%)
Place of birth for the foreign-born population - Zimbabwe (%)
Place of birth for the foreign-born population - Other Eastern Africa (%)
Place of birth for the foreign-born population - Cameroon (%)
Place of birth for the foreign-born population - Congo (%)
Place of birth for the foreign-born population - Democratic Republic of Congo (Zaire) (%)
Place of birth for the foreign-born population - Other Middle Africa (%)
Place of birth for the foreign-born population - Egypt (%)
Place of birth for the foreign-born population - Morocco (%)
Place of birth for the foreign-born population - Sudan (%)
Place of birth for the foreign-born population - Other Northern Africa (%)
Place of birth for the foreign-born population - South Africa (%)
Place of birth for the foreign-born population - Other Southern Africa (%)
Place of birth for the foreign-born population - Cabo Verde (%)
Place of birth for the foreign-born population - Ghana (%)
Place of birth for the foreign-born population - Liberia (%)
Place of birth for the foreign-born population - Nigeria (%)
Place of birth for the foreign-born population - Senegal (%)
Place of birth for the foreign-born population - Sierra Leone (%)
Place of birth for the foreign-born population - Other Western Africa (%)
Place of birth for the foreign-born population - Australia (%)
Place of birth for the foreign-born population - New Zealand (%)
Place of birth for the foreign-born population - Fiji (%)
Place of birth for the foreign-born population - Micronesia (%)
Place of birth for the foreign-born population - Bahamas (%)
Place of birth for the foreign-born population - Barbados (%)
Place of birth for the foreign-born population - Cuba (%)
Place of birth for the foreign-born population - Dominica (%)
Place of birth for the foreign-born population - Dominican Republic (%)
Place of birth for the foreign-born population - Grenada (%)
Place of birth for the foreign-born population - Haiti (%)
Place of birth for the foreign-born population - Jamaica (%)
Place of birth for the foreign-born population - St. Vincent and the Grenadines (%)
Place of birth for the foreign-born population - Trinidad and Tobago (%)
Place of birth for the foreign-born population - West Indies (%)
Place of birth for the foreign-born population - Other Caribbean (%)
Place of birth for the foreign-born population - Belize (%)
Place of birth for the foreign-born population - Costa Rica (%)
Place of birth for the foreign-born population - El Salvador (%)
Place of birth for the foreign-born population - Guatemala (%)
Place of birth for the foreign-born population - Honduras (%)
Place of birth for the foreign-born population - Mexico (%)
Place of birth for the foreign-born population - Nicaragua (%)
Place of birth for the foreign-born population - Panama (%)
Place of birth for the foreign-born population - Other Central America (%)
Place of birth for the foreign-born population - Argentina (%)
Place of birth for the foreign-born population - Bolivia (%)
Place of birth for the foreign-born population - Brazil (%)
Place of birth for the foreign-born population - Chile (%)
Place of birth for the foreign-born population - Colombia (%)
Place of birth for the foreign-born population - Ecuador (%)
Place of birth for the foreign-born population - Guyana (%)
Place of birth for the foreign-born population - Peru (%)
Place of birth for the foreign-born population - Uruguay (%)
Place of birth for the foreign-born population - Venezuela (%)
Place of birth for the foreign-born population - Other South America (%)
Place of birth for the foreign-born population - Canada (%)
Place of birth for the foreign-born population - Other Northern America (%)
Place of birth for the foreign-born population - Other (%)
Latest news about races in Holland, MI collected exclusively by city-data.com from local newspapers, TV, and radio stations
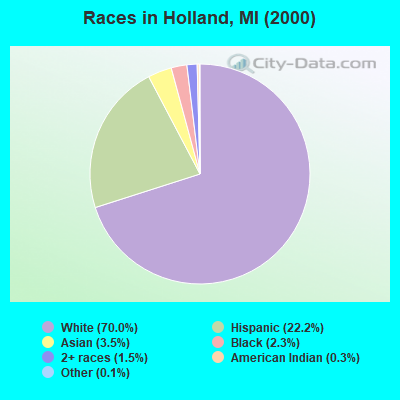
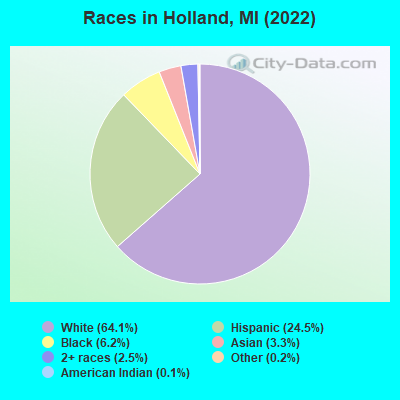
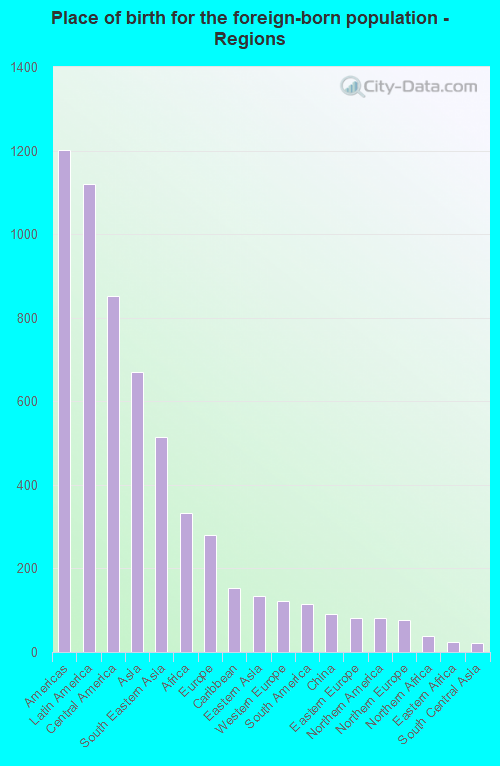
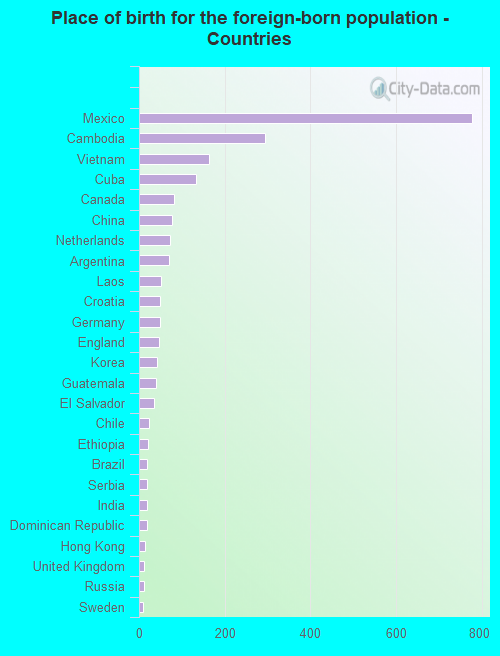
According to 2022 data, the most numerous races in Holland, MI are White alone (22,248 residents), Black alone (2,139 residents), and Hispanic (8,518 residents). 83.7% of Holland residents speak English at home. 7.2% of Holland, MI residents are foreign-born (3.3% born in Latin America, 2.0% born in Asia, 1.0% born in Africa, 0.8% born in Europe), which is 16.2% greater than the foreign-born rate of 6.0% across the entire state of Michigan.
Race distribution in Holland
2000 2022
7,806,691 78.6% White alone 1,402,047 14.1% Black alone 323,877 3.3% Hispanic 175,311 1.8% Asian alone 163,487 1.6% Two or more races 53,421 0.5% American Indian alone 11,465 0.1% Other race alone 2,145 0.02% Native Hawaiian and Other
7,289,051 72.6% White alone 1,310,464 13.1% Black alone 572,405 5.7% Hispanic 450,031 4.5% Two or more races 335,732 3.3% Asian alone 45,217 0.5% Other race alone 29,011 0.3% American Indian alone 2,207 0.02% Native Hawaiian and Other
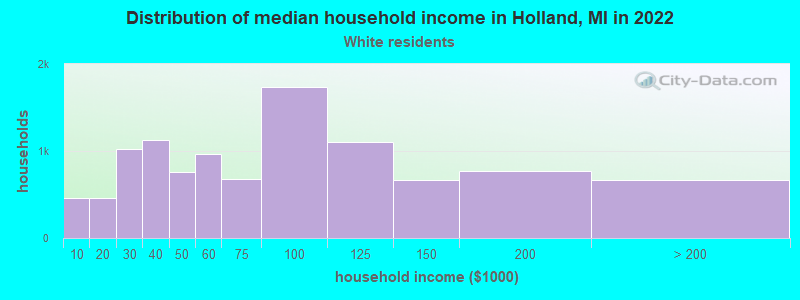
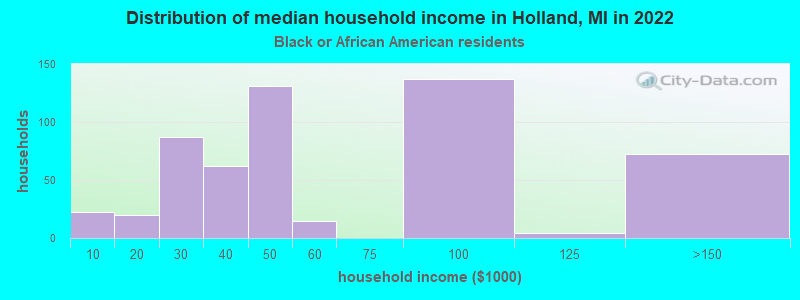
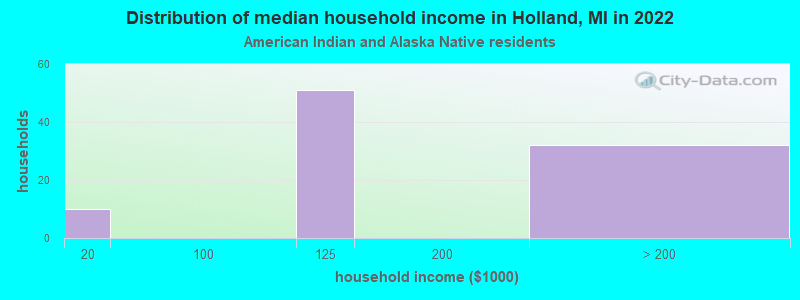
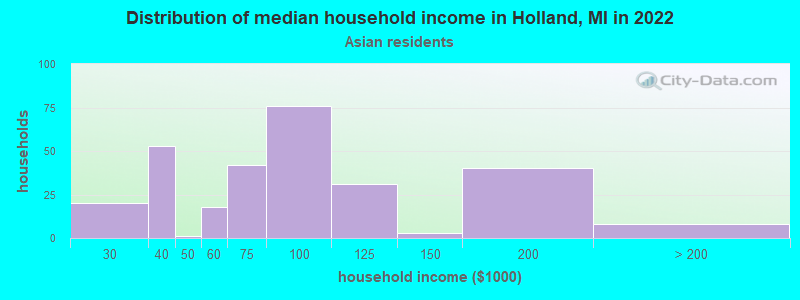
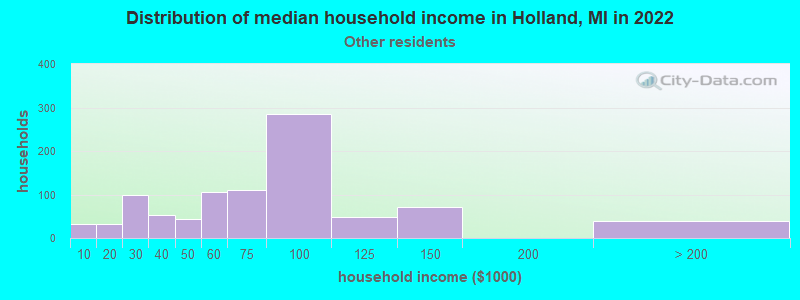
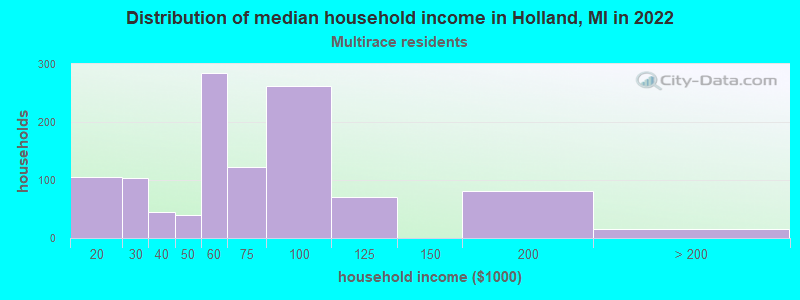
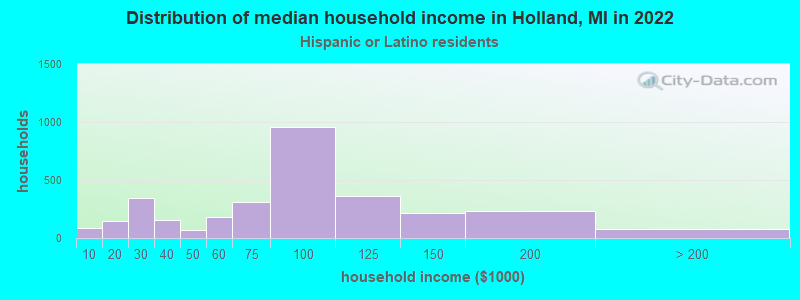
Income and house value in Holland Median household income in 2022 $68,765 White non-Hispanic householders$53,124 Black householders$121,944 American Indian and Alaska Native householders$90,897 Asian householders$72,555 Some other race householders$66,242 Two or more races householders$95,579 Hispanic or Latino race householdersMedian 2022 house value $263,328 White Non-Hispanic householders$256,934 Black or African American householders$499,896 American Indian or Alaska Native householders $303,584 Asian householders$196,548 Some other race householders$252,434 Two or more races householders$200,337 Hispanic or Latino householders
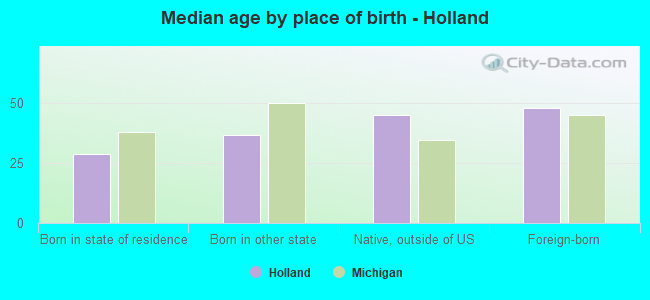
Median age by race in Holland
37.9 Median age for White residents38.0 37.9 22.8 Median age for Black or African American residents23.9 22.2 25.3 Median age for American Indian / Alaska Native residents45.5 38.8 34.6 Median age for Asian residents29.1 42.7 -670,531,400.3 Median age for Native Hawaiian / Pacific Islander residents-666,666,666.0 -666,666,666.0 31.8 Median age for Other race residents22.1 42.2 25.0 Median age for Two or more races residents24.2 25.2 39.0 Median age for White alone residents39.9 38.7 26.5 Median age for Hispanic or Latino residents24.7 27.9
Owner/renter occupied households by race in Holland
House owners and renters - White residents 7,364 71.2% Owner occupied2,976 28.8% Renter occupiedHouse owners and renters - Black or African American residents 22 3.5% Owner occupied628 96.5% Renter occupiedHouse owners and renters - American Indian / Alaska Native residents 23 27.8% Owner occupied61 72.2% Renter occupiedHouse owners and renters - Asian residents 191 71.2% Owner occupied77 28.8% Renter occupiedHouse owners and renters - Other race residents 405 28.3% Owner occupied1,026 71.7% Renter occupiedHouse owners and renters - Two or more races residents 525 63.3% Owner occupied305 36.7% Renter occupiedHouse owners and renters - White alone residents 6,688 71.6% Owner occupied2,648 28.4% Renter occupiedHouse owners and renters - Hispanic or Latino residents 1,483 49.0% Owner occupied1,545 51.0% Renter occupied
Language usage in Holland
English speakers - Total 83.7% of residents of Holland speak English at home.
12.8% of residents speak Spanish at home 2,944 69.7% Speak English very well1,277 30.3% Speak English less than very well3.9% of residents speak other language at home 486 37.9% Speak English very well795 62.1% Speak English less than very well
English speakers - Born in the United States 82.9% of residents of Holland speak English at home.
17.5% of residents speak Spanish at home 1,238 93.0% Speak English very well93 7.0% Speak English less than very well1.6% of residents speak other language at home 105 89.0% Speak English very well13 11.0% Speak English less than very well
English speakers - Native, born elsewhere 40.4% of residents of Holland speak English at home.
47.3% of residents speak Spanish at home 103 42.6% Speak English very well139 57.4% Speak English less than very well8.8% of residents speak other language at home 45 100.0% Speak English very well
English speakers - Foreign-born 15.2% of residents of Holland speak English at home.
47.0% of residents speak Spanish at home 374 31.5% Speak English very well814 68.5% Speak English less than very well36.2% of residents speak other language at home 273 29.8% Speak English very well642 70.2% Speak English less than very well
White (Caucasian) - Speak only English Native:
94.6% (22,069)Foreign-born:
30.4% (145)
White (Caucasian) - Speak another language Native:
4.5% (1,039)Foreign-born:
73.0% (349)
Black or African American - Speak only English Native:
95.0% (1,420)Foreign-born:
65.1% (212)
Black or African American - Speak another language Native:
4.6% (69)Foreign-born:
31.1% (101)
American Indian / Alaska Native - Speak another language Native:
38.5% (111)Foreign-born:
100.0% (38)
Asian - Speak only English Native:
66.2% (231)Foreign-born:
8.8% (67)
Asian - Speak another language Native:
33.3% (116)Foreign-born:
94.5% (723)
Other race - Speak only English Native:
61.4% (1,550)Foreign-born:
13.9% (94)
Other race - Speak another language Native:
37.2% (940)Foreign-born:
84.9% (571)
Two or more races - Speak another language Native:
37.8% (1,148)Foreign-born:
100.0% (274)
White alone - Speak only English Native:
98.1% (20,785)Foreign-born:
49.6% (146)
White alone - Speak another language Native:
1.9% (412)Foreign-born:
45.9% (135)
Hispanic or Latino - Speak only English Native:
59.9% (3,953)Foreign-born:
5.8% (73)
Hispanic or Latino - Speak another language Native:
39.1% (2,578)Foreign-born:
94.3% (1,187)
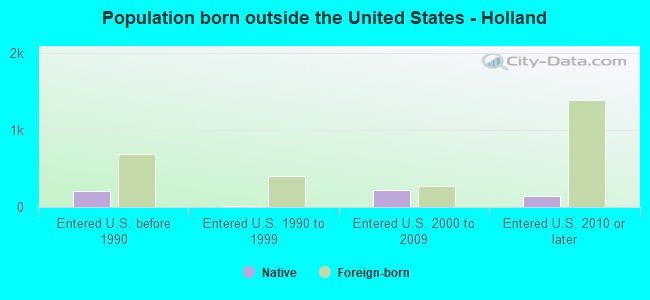
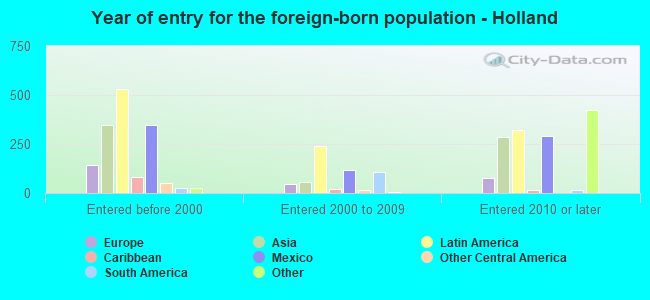
Foreign-born residents in Holland 2,486 residents are foreign born (3.3% Latin America , 2.0% Asia , 1.0% Africa , 0.8% Europe ).
This city:
7.2%Michigan:
6.9%
Marital status for residents in Holland Marital status - White (Caucasian) population 15 years and over
Males 39.4% Never married45.3% Now married0.9% Separated3.7% Widowed10.5% DivorcedFemales 37.7% Never married40.4% Now married0.6% Separated9.2% Widowed12.1% DivorcedWomen who gave birth in the past 12 months Now married:
100.0% (126)Unmarried:
0.0% (0)
Women who did not give birth in the past 12 months Now married:
31.1% (1,963)Unmarried:
68.9% (4,352)
Marital status - Black or African American population 15 years and over
Males 76.5% Never married17.3% Now married2.9% Separated0.0% Widowed3.3% DivorcedFemales 85.1% Never married1.5% Now married0.0% Separated10.6% Widowed2.7% DivorcedWomen who did not give birth in the past 12 months Now married:
1.3% (6)Unmarried:
98.7% (508)
Marital status - American Indian / Alaska Native population 15 years and over
Males 74.8% Never married25.2% Now married0.0% Separated0.0% Widowed0.0% DivorcedFemales 77.2% Never married14.6% Now married0.0% Separated5.7% Widowed2.5% DivorcedWomen who did not give birth in the past 12 months Now married:
0.0% (0)Unmarried:
100.0% (126)
Marital status - Asian population 15 years and over
Males 48.2% Never married39.7% Now married0.0% Separated0.0% Widowed12.2% DivorcedFemales 39.6% Never married50.6% Now married1.4% Separated8.0% Widowed0.3% DivorcedWomen who gave birth in the past 12 months Now married:
59.2% (51)Unmarried:
40.8% (35)
Women who did not give birth in the past 12 months Now married:
48.9% (181)Unmarried:
51.1% (189)
Marital status - Other race population 15 years and over
Males 40.4% Never married41.8% Now married0.0% Separated0.0% Widowed17.8% DivorcedFemales 39.3% Never married33.7% Now married4.0% Separated7.1% Widowed16.0% DivorcedWomen who gave birth in the past 12 months Now married:
100.0% (12)Unmarried:
0.0% (0)
Women who did not give birth in the past 12 months Now married:
40.1% (380)Unmarried:
59.9% (569)
Marital status - Two or more races population 15 years and over
Males 39.9% Never married52.0% Now married4.4% Separated2.5% Widowed1.1% DivorcedFemales 28.7% Never married53.1% Now married0.0% Separated3.3% Widowed14.8% DivorcedWomen who gave birth in the past 12 months Now married:
56.5% (32)Unmarried:
43.5% (25)
Women who did not give birth in the past 12 months Now married:
47.6% (453)Unmarried:
52.4% (498)
Marital status - White alone, not Hispanic / Latino population 15 years and over
Males 39.1% Never married46.1% Now married0.5% Separated3.2% Widowed11.2% DivorcedFemales 37.2% Never married40.1% Now married0.2% Separated9.5% Widowed13.0% DivorcedWomen who gave birth in the past 12 months Now married:
100.0% (129)Unmarried:
0.0% (0)
Women who did not give birth in the past 12 months Now married:
30.9% (1,801)Unmarried:
69.1% (4,028)
Marital status - Hispanic or Latino population 15 years and over
Males 42.4% Never married44.9% Now married2.7% Separated3.1% Widowed6.9% DivorcedFemales 37.9% Never married41.9% Now married3.0% Separated5.4% Widowed11.8% DivorcedWomen who gave birth in the past 12 months Now married:
100.0% (10)Unmarried:
0.0% (0)
Women who did not give birth in the past 12 months Now married:
38.8% (863)Unmarried:
61.2% (1,364)
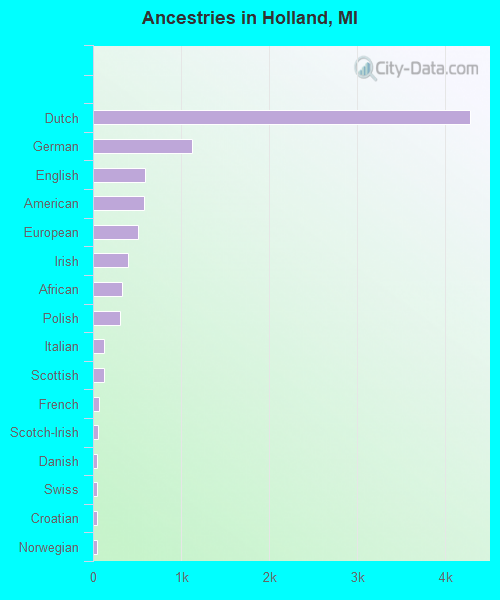
Ancestries in Holland
4,284 26.2% Dutch1,127 6.9% German587 3.6% English576 3.5% American506 3.1% European399 2.4% Irish327 2.0% African311 1.9% Polish123 0.8% Italian122 0.7% Scottish67 0.4% French57 0.3% Scotch-Irish50 0.3% Danish47 0.3% Swiss45 0.3% Croatian44 0.3% Norwegian24 0.1% Swedish23 0.1% Serbian21 0.1% Nigerian17 0.1% Belgian17 0.1% Hungarian17 0.1% Northern European15 0.09% Lebanese15 0.09% Russian14 0.09% Albanian14 0.09% Czech14 0.09% Romanian13 0.08% British12 0.07% Eastern European12 0.07% French Canadian11 0.07% Czechoslovakian9 0.05% Assyrian8 0.05% Greek8 0.05% Ethiopian8 0.05% Canadian7 0.04% Finnish5 0.03% Turkish1 0.01% Welsh
Geographical mobility in Holland Same house 1 year ago 20,141 81.2% White (Caucasian)1,402 63.1% Black or African American258 79.2% American Indian / Alaska Native1,043 96.1% Asian1,853 67.7% Other race2,974 76.5% Two or more races18,451 83.1% White alone, not Hispanic / Latino6,069 72.5% Hispanic or LatinoMoved within same county 1,845 7.4% White / Caucasian103 4.7% Black or African American27 8.3% American Indian / Alaska Native12 1.1% Asian540 19.7% Other race385 9.9% Two or more races1,220 5.5% White alone, not Hispanic / Latino1,024 12.2% Hispanic or LatinoMoved within same state 1,755 7.1% White / Caucasian554 24.9% Black or African American29 8.9% American Indian / Alaska Native38 3.5% Asian188 6.9% Other race491 12.6% Two or more races1,635 7.4% White alone, not Hispanic / Latino733 8.8% Hispanic or LatinoMoved from different state 672 2.7% White / Caucasian201 9.1% Black or African American3 0.3% Asian25 0.9% Other race28 0.7% Two or more races653 2.9% White alone, not Hispanic / Latino94 1.1% Hispanic or LatinoMoved from abroad 198 0.8% White38 1.7% Black or African American9 0.8% Asian87 3.2% Other race17 0.4% Two or more races174 0.8% White alone, not Hispanic / Latino135 1.6% Hispanic or Latino
Children Nativity (place of birth) in Holland
Children under 6 years - Living with two parents Both parents native 1,192 100.0% NativeBoth parents foreign-born 21 100.0% NativeOne native, one foreign-born parent 61 100.0% NativeChildren under 6 years - Living with one parent Native parent 565 100.0% NativeForeign-born parent 6 100.0% NativeChildren 6 to 17 years - Living with two parents Both parents native 2,492 98.3% Native42 1.7% Foreign-bornBoth parents foreign-born 120 100.0% NativeOne native, one foreign-born parent 120 98.8% Native1 1.2% Foreign-bornChildren 6 to 17 years - Living with one parent Native parent 1,856 93.2% Native136 6.8% Foreign-bornForeign-born parent 97 100.0% Native
Grandparents responsible for own grandchildren in Holland
Grandparents (30 to 59 years) White / Caucasian 1 1.7% Responsible for grandchildren83 98.3% Not responsible for grandchildrenBlack or African American 68 87.6% Responsible for grandchildren10 12.4% Not responsible for grandchildrenAmerican Indian / Alaska Native 37 100.0% Not responsible for grandchildrenOther race 18 100.0% Not responsible for grandchildrenTwo or more races 19 100.0% Not responsible for grandchildrenWhite alone, not Hispanic / Latino 1 1.6% Responsible for grandchildren91 98.4% Not responsible for grandchildrenHispanic or Latino 48 100.0% Not responsible for grandchildrenGrandparents (60 years and over) White / Caucasian 24 24.6% Responsible for grandchildren73 75.4% Not responsible for grandchildrenBlack or African American 68 100.0% Not responsible for grandchildrenOther race 88 100.0% Not responsible for grandchildrenTwo or more races 15 100.0% Not responsible for grandchildrenWhite alone, not Hispanic / Latino 15 35.5% Responsible for grandchildren26 64.5% Not responsible for grandchildrenHispanic or Latino 5 5.2% Responsible for grandchildren96 94.8% Not responsible for grandchildren