Races in Holly Springs, Georgia (GA) Detailed Stats
Data:
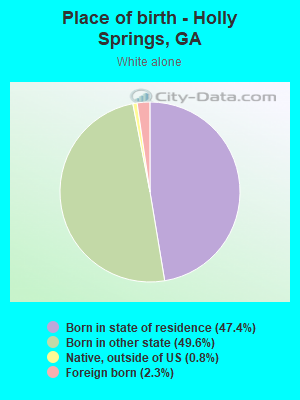
Races - White alone (%)
Races - White alone (% change since 2000)
Races - Black alone (%)
Races - Black alone (% change since 2000)
Races - American Indian alone (%)
Races - American Indian alone (% change since 2000)
Races - Asian alone (%)
Races - Asian alone (% change since 2000)
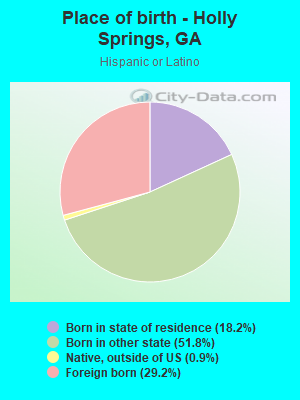
Races - Hispanic (%)
Races - Hispanic (% change since 2000)
Races - Native Hawaiian and Other Pacific Islander alone (%)
Races - Native Hawaiian and Other Pacific Islander alone (% change since 2000)
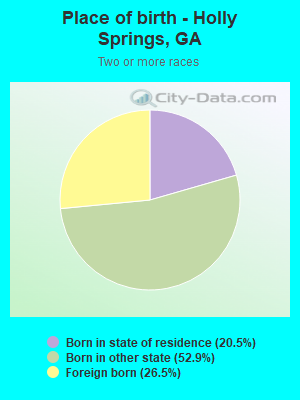
Races - Two or more races(%)
Races - Two or more races(% change since 2000)
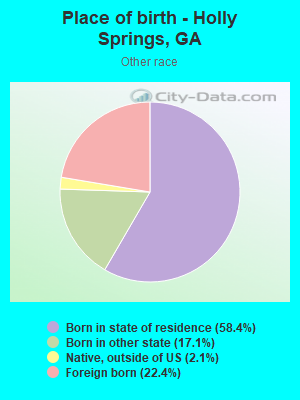
Races - Other race alone (%)
Races - Other race alone (% change since 2000)
Racial diversity
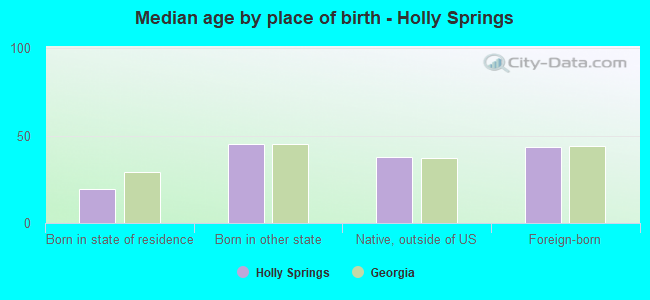
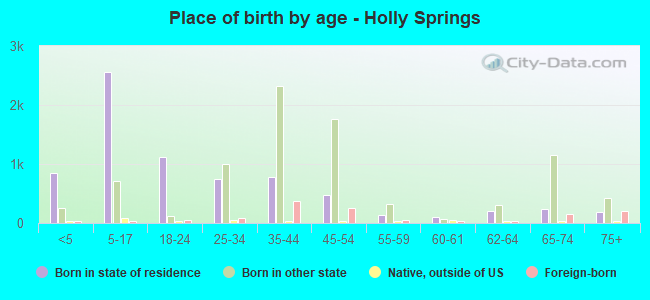
Place of birth - Born in state of residence (%)
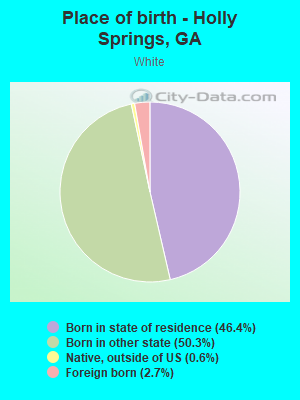
Place of birth - Born in state of residence (%) - White
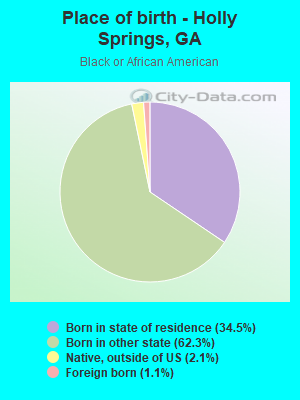
Place of birth - Born in state of residence (%) - Black or African American
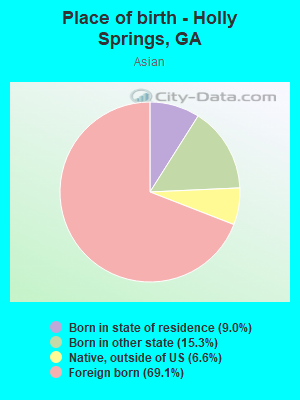
Place of birth - Born in state of residence (%) - Asian
Place of birth - Born in state of residence (%) - Hispanic or Latino
Place of birth - Born in state of residence (%) - American Indian and Alaska Native
Place of birth - Born in state of residence (%) - Multirace
Place of birth - Born in state of residence (%) - Other Race
Place of birth - Born in other state (%)
Place of birth - Born in other state (%) - White
Place of birth - Born in other state (%) - Black or African American
Place of birth - Born in other state (%) - Asian
Place of birth - Born in other state (%) - Hispanic or Latino
Place of birth - Born in other state (%) - American Indian and Alaska Native
Place of birth - Born in other state (%) - Multirace
Place of birth - Born in other state (%) - Other Race
Place of birth - Native, outside of US (%)
Place of birth - Native, outside of US (%) - White
Place of birth - Native, outside of US (%) - Black or African American
Place of birth - Native, outside of US (%) - Asian
Place of birth - Native, outside of US (%) - Hispanic or Latino
Place of birth - Native, outside of US (%) - American Indian and Alaska Native
Place of birth - Native, outside of US (%) - Multirace
Place of birth - Native, outside of US (%) - Other Race
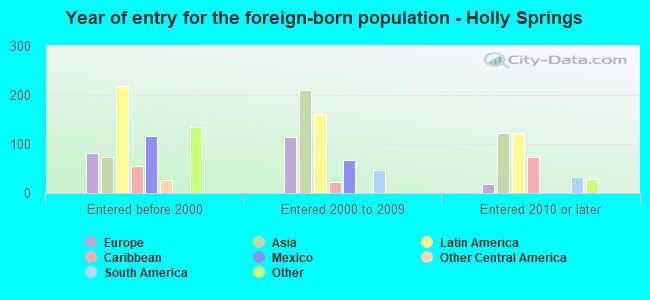
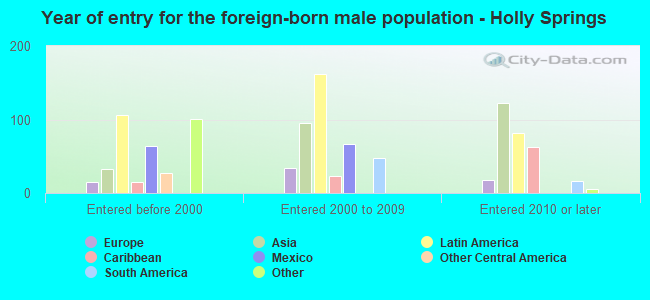
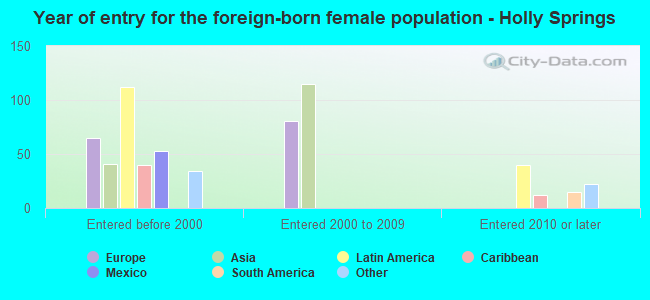
Place of birth - Foreign born (%)
Place of birth - Foreign born (%) - White
Place of birth - Foreign born (%) - Black or African American
Place of birth - Foreign born (%) - Asian
Place of birth - Foreign born (%) - Hispanic or Latino
Place of birth - Foreign born (%) - American Indian and Alaska Native
Place of birth - Foreign born (%) - Multirace
Place of birth - Foreign born (%) - Other Race
Residents speaking English at home (%)
Residents speaking English at home - Born in the United States (%)
Residents speaking English at home - Native, born elsewhere (%)
Residents speaking English at home - Foreign born (%)
Residents speaking Spanish at home (%)
Residents speaking Spanish at home - Born in the United States (%)
Residents speaking Spanish at home - Native, born elsewhere (%)
Residents speaking Spanish at home - Foreign born (%)
Residents speaking other language at home (%)
Residents speaking other language at home - Born in the United States (%)
Residents speaking other language at home - Native, born elsewhere (%)
Residents speaking other language at home - Foreign born (%)
Marital status - Never married (%)
Marital status - Now married (%)
Marital status - Separated (%)
Marital status - Widowed (%)
Marital status - Divorced (%)
Ancestries Reported - Arab (%)
Ancestries Reported - Czech (%)
Ancestries Reported - Danish (%)
Ancestries Reported - Dutch (%)
Ancestries Reported - English (%)
Ancestries Reported - French (%)
Ancestries Reported - French Canadian (%)
Ancestries Reported - German (%)
Ancestries Reported - Greek (%)
Ancestries Reported - Hungarian (%)
Ancestries Reported - Irish (%)
Ancestries Reported - Italian (%)
Ancestries Reported - Lithuanian (%)
Ancestries Reported - Norwegian (%)
Ancestries Reported - Polish (%)
Ancestries Reported - Portuguese (%)
Ancestries Reported - Russian (%)
Ancestries Reported - Scotch-Irish (%)
Ancestries Reported - Scottish (%)
Ancestries Reported - Slovak (%)
Ancestries Reported - Subsaharan African (%)
Ancestries Reported - Swedish (%)
Ancestries Reported - Swiss (%)
Ancestries Reported - Ukrainian (%)
Ancestries Reported - United States (%)
Ancestries Reported - Welsh (%)
Ancestries Reported - West Indian (%)
Ancestries Reported - Other (%)
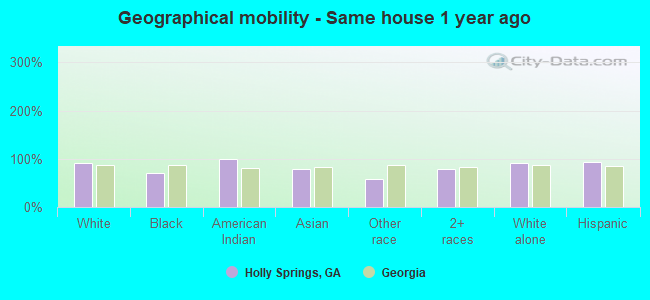
Geographical mobility - Same house 1 year ago (%)
Geographical mobility - Same house 1 year ago (%) - White
Geographical mobility - Same house 1 year ago (%) - Black or African American
Geographical mobility - Same house 1 year ago (%) - Asian
Geographical mobility - Same house 1 year ago (%) - Hispanic or Latino
Geographical mobility - Same house 1 year ago (%) - American Indian and Alaska Native
Geographical mobility - Same house 1 year ago (%) - Multirace
Geographical mobility - Same house 1 year ago (%) - Other Race
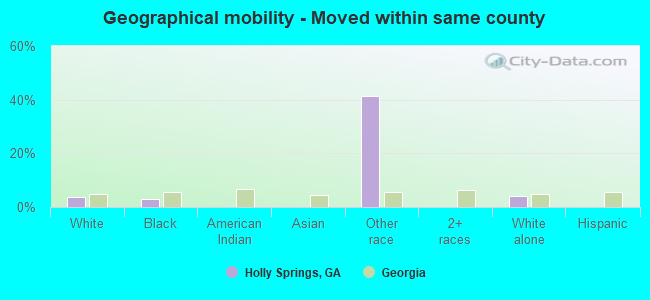
Geographical mobility - Moved within same county (%)
Geographical mobility - Moved within same county (%) - White
Geographical mobility - Moved within same county (%) - Black or African American
Geographical mobility - Moved within same county (%) - Asian
Geographical mobility - Moved within same county (%) - Hispanic or Latino
Geographical mobility - Moved within same county (%) - American Indian and Alaska Native
Geographical mobility - Moved within same county (%) - Multirace
Geographical mobility - Moved within same county (%) - Other Race
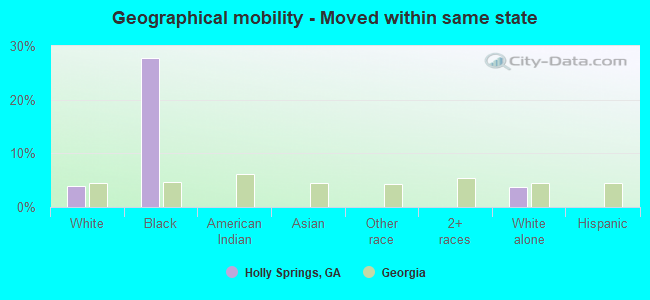
Geographical mobility - Moved from different county within same state (%)
Geographical mobility - Moved from different county within same state (%) - White
Geographical mobility - Moved from different county within same state (%) - Black or African American
Geographical mobility - Moved from different county within same state (%) - Asian
Geographical mobility - Moved from different county within same state (%) - Hispanic or Latino
Geographical mobility - Moved from different county within same state (%) - American Indian and Alaska Native
Geographical mobility - Moved from different county within same state (%) - Multirace
Geographical mobility - Moved from different county within same state (%) - Other Race
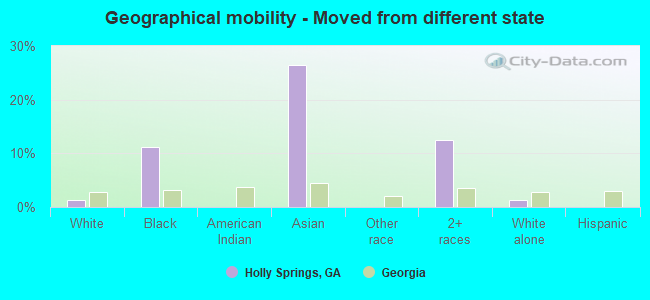
Geographical mobility - Moved from different state (%)
Geographical mobility - Moved from different state (%) - White
Geographical mobility - Moved from different state (%) - Black or African American
Geographical mobility - Moved from different state (%) - Asian
Geographical mobility - Moved from different state (%) - Hispanic or Latino
Geographical mobility - Moved from different state (%) - American Indian and Alaska Native
Geographical mobility - Moved from different state (%) - Multirace
Geographical mobility - Moved from different state (%) - Other Race
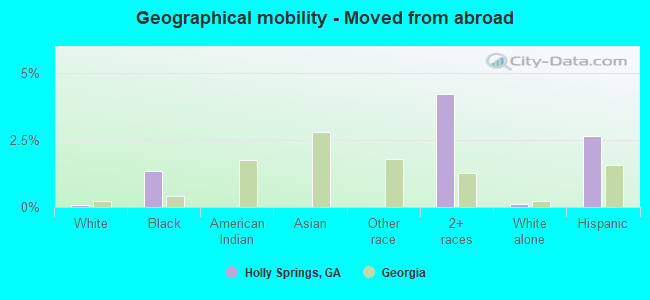
Geographical mobility - Moved from abroad (%)
Geographical mobility - Moved from abroad (%) - White
Geographical mobility - Moved from abroad (%) - Black or African American
Geographical mobility - Moved from abroad (%) - Asian
Geographical mobility - Moved from abroad (%) - Hispanic or Latino
Geographical mobility - Moved from abroad (%) - American Indian and Alaska Native
Geographical mobility - Moved from abroad (%) - Multirace
Geographical mobility - Moved from abroad (%) - Other Race
Place of birth for the foreign-born population - Ireland (%)
Place of birth for the foreign-born population - Denmark (%)
Place of birth for the foreign-born population - Norway (%)
Place of birth for the foreign-born population - Sweden (%)
Place of birth for the foreign-born population - United Kingdom (%)
Place of birth for the foreign-born population - England (%)
Place of birth for the foreign-born population - Scotland (%)
Place of birth for the foreign-born population - Other Northern Europe (%)
Place of birth for the foreign-born population - Austria (%)
Place of birth for the foreign-born population - Belgium (%)
Place of birth for the foreign-born population - France (%)
Place of birth for the foreign-born population - Germany (%)
Place of birth for the foreign-born population - Netherlands (%)
Place of birth for the foreign-born population - Switzerland (%)
Place of birth for the foreign-born population - Other Western Europe (%)
Place of birth for the foreign-born population - Greece (%)
Place of birth for the foreign-born population - Italy (%)
Place of birth for the foreign-born population - Portugal (%)
Place of birth for the foreign-born population - Spain (%)
Place of birth for the foreign-born population - Other Southern Europe (%)
Place of birth for the foreign-born population - Albania (%)
Place of birth for the foreign-born population - Belarus (%)
Place of birth for the foreign-born population - Bosnia and Herzegovina (%)
Place of birth for the foreign-born population - Bulgaria (%)
Place of birth for the foreign-born population - Croatia (%)
Place of birth for the foreign-born population - Czechoslovakia (%)
Place of birth for the foreign-born population - Hungary (%)
Place of birth for the foreign-born population - Latvia (%)
Place of birth for the foreign-born population - Lithuania (%)
Place of birth for the foreign-born population - North Macedonia (Macedonia) (%)
Place of birth for the foreign-born population - Moldova (%)
Place of birth for the foreign-born population - Poland (%)
Place of birth for the foreign-born population - Romania (%)
Place of birth for the foreign-born population - Russia (%)
Place of birth for the foreign-born population - Serbia (%)
Place of birth for the foreign-born population - Ukraine (%)
Place of birth for the foreign-born population - Other Eastern Europe (%)
Place of birth for the foreign-born population - China (%)
Place of birth for the foreign-born population - Hong Kong (%)
Place of birth for the foreign-born population - Taiwan (%)
Place of birth for the foreign-born population - Japan (%)
Place of birth for the foreign-born population - Korea (%)
Place of birth for the foreign-born population - Other Eastern Asia (%)
Place of birth for the foreign-born population - Afghanistan (%)
Place of birth for the foreign-born population - Bangladesh (%)
Place of birth for the foreign-born population - India (%)
Place of birth for the foreign-born population - Iran (%)
Place of birth for the foreign-born population - Kazakhstan (%)
Place of birth for the foreign-born population - Nepal (%)
Place of birth for the foreign-born population - Pakistan (%)
Place of birth for the foreign-born population - Sri Lanka (%)
Place of birth for the foreign-born population - Uzbekistan (%)
Place of birth for the foreign-born population - Other South Central Asia (%)
Place of birth for the foreign-born population - Burma (%)
Place of birth for the foreign-born population - Cambodia (%)
Place of birth for the foreign-born population - Indonesia (%)
Place of birth for the foreign-born population - Laos (%)
Place of birth for the foreign-born population - Malaysia (%)
Place of birth for the foreign-born population - Philippines (%)
Place of birth for the foreign-born population - Singapore (%)
Place of birth for the foreign-born population - Thailand (%)
Place of birth for the foreign-born population - Vietnam (%)
Place of birth for the foreign-born population - Other South Eastern Asia (%)
Place of birth for the foreign-born population - Armenia (%)
Place of birth for the foreign-born population - Iraq (%)
Place of birth for the foreign-born population - Israel (%)
Place of birth for the foreign-born population - Jordan (%)
Place of birth for the foreign-born population - Kuwait (%)
Place of birth for the foreign-born population - Lebanon (%)
Place of birth for the foreign-born population - Saudi Arabia (%)
Place of birth for the foreign-born population - Syria (%)
Place of birth for the foreign-born population - Turkey (%)
Place of birth for the foreign-born population - Yemen (%)
Place of birth for the foreign-born population - Other Western Asia (%)
Place of birth for the foreign-born population - Eritrea (%)
Place of birth for the foreign-born population - Ethiopia (%)
Place of birth for the foreign-born population - Kenya (%)
Place of birth for the foreign-born population - Somalia (%)
Place of birth for the foreign-born population - Uganda (%)
Place of birth for the foreign-born population - Zimbabwe (%)
Place of birth for the foreign-born population - Other Eastern Africa (%)
Place of birth for the foreign-born population - Cameroon (%)
Place of birth for the foreign-born population - Congo (%)
Place of birth for the foreign-born population - Democratic Republic of Congo (Zaire) (%)
Place of birth for the foreign-born population - Other Middle Africa (%)
Place of birth for the foreign-born population - Egypt (%)
Place of birth for the foreign-born population - Morocco (%)
Place of birth for the foreign-born population - Sudan (%)
Place of birth for the foreign-born population - Other Northern Africa (%)
Place of birth for the foreign-born population - South Africa (%)
Place of birth for the foreign-born population - Other Southern Africa (%)
Place of birth for the foreign-born population - Cabo Verde (%)
Place of birth for the foreign-born population - Ghana (%)
Place of birth for the foreign-born population - Liberia (%)
Place of birth for the foreign-born population - Nigeria (%)
Place of birth for the foreign-born population - Senegal (%)
Place of birth for the foreign-born population - Sierra Leone (%)
Place of birth for the foreign-born population - Other Western Africa (%)
Place of birth for the foreign-born population - Australia (%)
Place of birth for the foreign-born population - New Zealand (%)
Place of birth for the foreign-born population - Fiji (%)
Place of birth for the foreign-born population - Micronesia (%)
Place of birth for the foreign-born population - Bahamas (%)
Place of birth for the foreign-born population - Barbados (%)
Place of birth for the foreign-born population - Cuba (%)
Place of birth for the foreign-born population - Dominica (%)
Place of birth for the foreign-born population - Dominican Republic (%)
Place of birth for the foreign-born population - Grenada (%)
Place of birth for the foreign-born population - Haiti (%)
Place of birth for the foreign-born population - Jamaica (%)
Place of birth for the foreign-born population - St. Vincent and the Grenadines (%)
Place of birth for the foreign-born population - Trinidad and Tobago (%)
Place of birth for the foreign-born population - West Indies (%)
Place of birth for the foreign-born population - Other Caribbean (%)
Place of birth for the foreign-born population - Belize (%)
Place of birth for the foreign-born population - Costa Rica (%)
Place of birth for the foreign-born population - El Salvador (%)
Place of birth for the foreign-born population - Guatemala (%)
Place of birth for the foreign-born population - Honduras (%)
Place of birth for the foreign-born population - Mexico (%)
Place of birth for the foreign-born population - Nicaragua (%)
Place of birth for the foreign-born population - Panama (%)
Place of birth for the foreign-born population - Other Central America (%)
Place of birth for the foreign-born population - Argentina (%)
Place of birth for the foreign-born population - Bolivia (%)
Place of birth for the foreign-born population - Brazil (%)
Place of birth for the foreign-born population - Chile (%)
Place of birth for the foreign-born population - Colombia (%)
Place of birth for the foreign-born population - Ecuador (%)
Place of birth for the foreign-born population - Guyana (%)
Place of birth for the foreign-born population - Peru (%)
Place of birth for the foreign-born population - Uruguay (%)
Place of birth for the foreign-born population - Venezuela (%)
Place of birth for the foreign-born population - Other South America (%)
Place of birth for the foreign-born population - Canada (%)
Place of birth for the foreign-born population - Other Northern America (%)
Place of birth for the foreign-born population - Other (%)
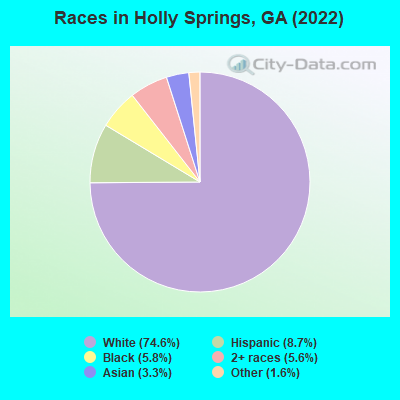
According to 2022 data, the most numerous races in Holly Springs, GA are White alone (13,032 residents), Black alone (1,008 residents), and Hispanic (1,513 residents). 89.6% of Holly Springs residents speak English at home. 7.9% of Holly Springs, GA residents are foreign-born (3.1% born in Latin America, 1.9% born in Asia, 1.6% born in Europe, 1.0% born in Africa), which is 26.4% less than the foreign-born rate of 10.0% across the entire state of Georgia.
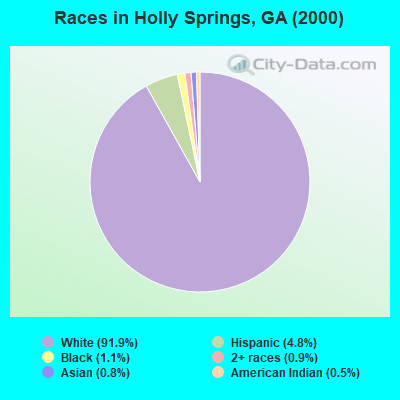
Race distribution in Holly Springs
2000 2022
5,128,661 62.6% White alone 2,331,465 28.5% Black alone 435,227 5.3% Hispanic 171,513 2.1% Asian alone 87,364 1.1% Two or more races 17,670 0.2% American Indian alone 11,275 0.1% Other race alone 3,278 0.04% Native Hawaiian and Other
5,415,657 49.6% White alone 3,349,240 30.7% Black alone 1,132,604 10.4% Hispanic 479,156 4.4% Asian alone 462,923 4.2% Two or more races 54,416 0.5% Other race alone 11,923 0.1% American Indian alone 6,957 0.06% Native Hawaiian and Other
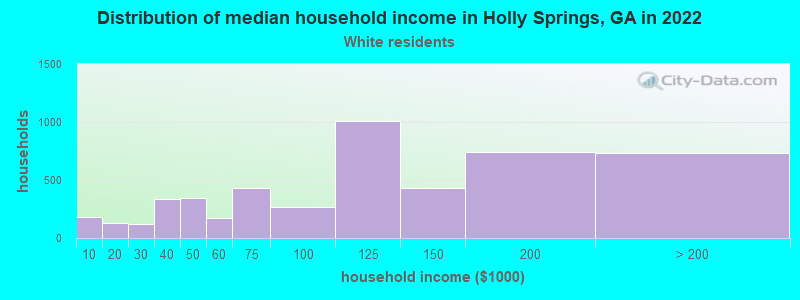
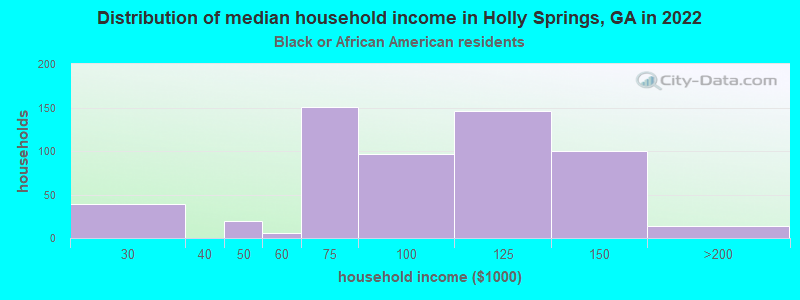
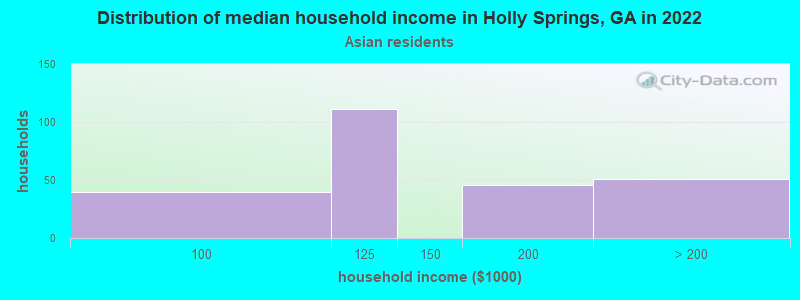
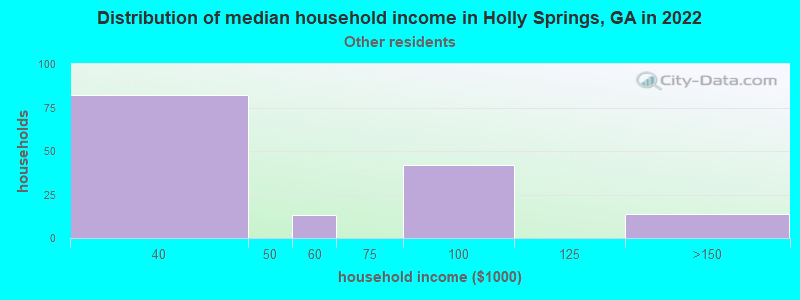
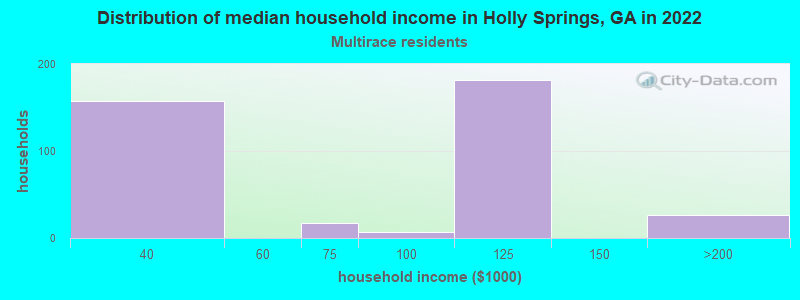
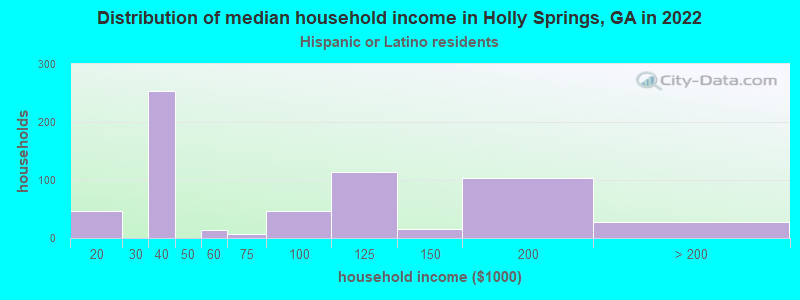
Income and house value in Holly Springs Median household income in 2022 $107,205 White non-Hispanic householders$97,096 Black householders$110,920 Asian householdersMedian 2022 house value $452,741 White Non-Hispanic householders$370,460 Two or more races householders$487,447 Hispanic or Latino householders
Median age by race in Holly Springs
40.8 Median age for White residents40.6 41.0 42.8 Median age for Black or African American residents35.6 45.3 -696,165,191.0 Median age for American Indian / Alaska Native residents-463,636,363.2 -696,476,964.1 48.8 Median age for Asian residents57.6 43.2 -657,243,815.6 Median age for Native Hawaiian / Pacific Islander residents-693,227,090.9 -776,776,776.0 36.3 Median age for Other race residents39.3 10.9 27.2 Median age for Two or more races residents30.9 28.1 40.3 Median age for White alone residents38.7 41.5 42.1 Median age for Hispanic or Latino residents44.4 24.7
Owner/renter occupied households by race in Holly Springs
House owners and renters - White residents 3,746 74.2% Owner occupied1,304 25.8% Renter occupiedHouse owners and renters - Black or African American residents 269 68.2% Owner occupied126 31.8% Renter occupiedHouse owners and renters - Asian residents 259 100.0% Owner occupiedHouse owners and renters - Other race residents 219 100.0% Owner occupiedHouse owners and renters - Two or more races residents 414 84.8% Owner occupied74 15.2% Renter occupiedHouse owners and renters - White alone residents 3,715 78.3% Owner occupied1,031 21.7% Renter occupiedHouse owners and renters - Hispanic or Latino residents 275 49.0% Owner occupied286 51.0% Renter occupied
Language usage in Holly Springs
English speakers - Total 89.6% of residents of Holly Springs speak English at home.
5.8% of residents speak Spanish at home 683 71.3% Speak English very well275 28.7% Speak English less than very well4.4% of residents speak other language at home 514 71.2% Speak English very well208 28.8% Speak English less than very well
English speakers - Born in the United States 96.2% of residents of Holly Springs speak English at home.
2.2% of residents speak Spanish at home 168 90.8% Speak English very well17 9.2% Speak English less than very well1.3% of residents speak other language at home 112 100.0% Speak English very well
English speakers - Native, born elsewhere 67.8% of residents of Holly Springs speak English at home.
12.1% of residents speak Spanish at home 8 30.8% Speak English very well18 69.2% Speak English less than very well4.7% of residents speak other language at home 10 100.0% Speak English less than very well
English speakers - Foreign-born 23.5% of residents of Holly Springs speak English at home.
36.1% of residents speak Spanish at home 246 53.5% Speak English very well214 46.5% Speak English less than very well36.6% of residents speak other language at home 284 60.8% Speak English very well183 39.2% Speak English less than very well
White (Caucasian) - Speak only English Native:
97.9% (11,983)Foreign-born:
27.8% (102)
White (Caucasian) - Speak another language Native:
2.0% (239)Foreign-born:
72.8% (267)
Black or African American - Speak only English Native:
97.2% (980)Foreign-born:
100.0% (12)
Asian - Speak only English Native:
100.0% (186)Foreign-born:
13.1% (48)
Asian - Speak another language Native:
4.3% (8)Foreign-born:
86.5% (319)
Other race - Speak only English Native:
32.0% (125)Foreign-born:
13.7% (15)
Other race - Speak another language Native:
67.1% (262)Foreign-born:
82.4% (89)
Two or more races - Speak only English Native:
81.5% (892)Foreign-born:
27.7% (119)
Two or more races - Speak another language Native:
18.1% (198)Foreign-born:
60.9% (261)
White alone - Speak only English Native:
98.3% (11,653)Foreign-born:
37.7% (112)
White alone - Speak another language Native:
1.7% (200)Foreign-born:
66.3% (196)
Hispanic or Latino - Speak only English Native:
56.9% (558)Foreign-born:
2.3% (10)
Hispanic or Latino - Speak another language Native:
43.6% (428)Foreign-born:
100.0% (448)
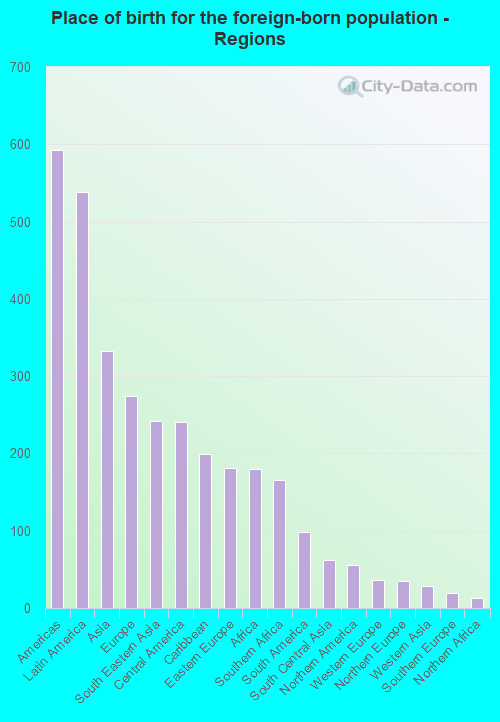
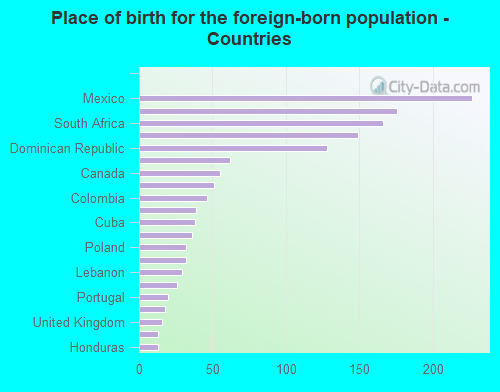
Foreign-born residents in Holly Springs 1,382 residents are foreign born (3.1% Latin America , 1.9% Asia , 1.6% Europe , 1.0% Africa ).
This city:
7.9%Georgia:
10.4%
Marital status for residents in Holly Springs Marital status - White (Caucasian) population 15 years and over
Males 24.3% Never married66.7% Now married0.2% Separated2.8% Widowed6.0% DivorcedFemales 22.5% Never married56.1% Now married1.0% Separated5.3% Widowed15.1% DivorcedWomen who gave birth in the past 12 months Now married:
100.0% (197)Unmarried:
0.0% (0)
Women who did not give birth in the past 12 months Now married:
59.1% (2,082)Unmarried:
40.9% (1,443)
Marital status - Black or African American population 15 years and over
Males 40.5% Never married42.8% Now married0.0% Separated0.0% Widowed16.7% DivorcedFemales 33.7% Never married40.5% Now married3.0% Separated4.2% Widowed18.5% DivorcedWomen who did not give birth in the past 12 months Now married:
32.0% (101)Unmarried:
68.0% (215)
Marital status - Asian population 15 years and over
Males 0.0% Never married100.0% Now married0.0% Separated0.0% Widowed0.0% DivorcedFemales 16.8% Never married78.5% Now married0.0% Separated0.0% Widowed4.7% DivorcedWomen who did not give birth in the past 12 months Now married:
72.8% (152)Unmarried:
27.2% (57)
Marital status - Other race population 15 years and over
Males 51.2% Never married48.8% Now married0.0% Separated0.0% Widowed0.0% DivorcedFemales 35.5% Never married64.5% Now married0.0% Separated0.0% Widowed0.0% DivorcedWomen who did not give birth in the past 12 months Now married:
50.0% (14)Unmarried:
50.0% (14)
Marital status - Two or more races population 15 years and over
Males 55.0% Never married41.3% Now married0.0% Separated0.0% Widowed3.6% DivorcedFemales 33.2% Never married48.7% Now married0.0% Separated7.0% Widowed11.1% DivorcedWomen who did not give birth in the past 12 months Now married:
50.0% (257)Unmarried:
50.0% (257)
Marital status - White alone, not Hispanic / Latino population 15 years and over
Males 26.2% Never married63.9% Now married0.2% Separated3.1% Widowed6.6% DivorcedFemales 20.1% Never married58.0% Now married1.1% Separated4.9% Widowed15.9% DivorcedWomen who gave birth in the past 12 months Now married:
100.0% (204)Unmarried:
0.0% (0)
Women who did not give birth in the past 12 months Now married:
61.7% (2,102)Unmarried:
38.3% (1,304)
Marital status - Hispanic or Latino population 15 years and over
Males 17.1% Never married81.2% Now married0.0% Separated0.0% Widowed1.7% DivorcedFemales 46.1% Never married41.4% Now married0.0% Separated12.5% Widowed0.0% DivorcedWomen who did not give birth in the past 12 months Now married:
45.8% (190)Unmarried:
54.2% (225)
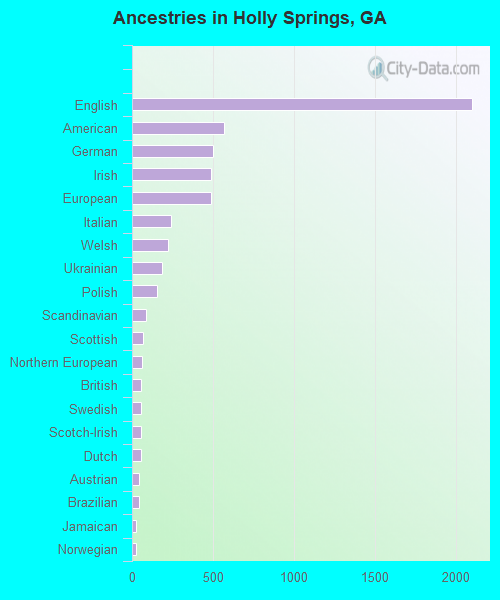
Ancestries in Holly Springs
2,102 27.8% English566 7.5% American502 6.6% German490 6.5% Irish487 6.4% European241 3.2% Italian222 2.9% Welsh188 2.5% Ukrainian157 2.1% Polish88 1.2% Scandinavian68 0.9% Scottish64 0.8% Northern European58 0.8% British56 0.7% Swedish55 0.7% Scotch-Irish53 0.7% Dutch44 0.6% Austrian43 0.6% Brazilian25 0.3% Jamaican23 0.3% Norwegian16 0.2% Egyptian15 0.2% Armenian15 0.2% Portuguese12 0.2% French10 0.1% Hungarian10 0.1% Russian
Children Nativity (place of birth) in Holly Springs
Children under 6 years - Living with two parents Both parents native 899 100.0% NativeBoth parents foreign-born 100 100.0% NativeOne native, one foreign-born parent 41 100.0% NativeChildren under 6 years - Living with one parent Native parent 20 100.0% NativeForeign-born parent 130 100.0% NativeChildren 6 to 17 years - Living with two parents Both parents native 2,026 100.0% NativeBoth parents foreign-born 174 84.0% Native33 16.0% Foreign-bornOne native, one foreign-born parent 209 100.0% NativeChildren 6 to 17 years - Living with one parent Native parent 522 100.0% NativeForeign-born parent 31 53.0% Native27 47.0% Foreign-born
Grandparents responsible for own grandchildren in Holly Springs
Grandparents (30 to 59 years) White / Caucasian 84 60.1% Responsible for grandchildren56 39.9% Not responsible for grandchildrenWhite alone, not Hispanic / Latino 86 60.1% Responsible for grandchildren57 39.9% Not responsible for grandchildrenGrandparents (60 years and over) White / Caucasian 23 9.7% Responsible for grandchildren216 90.3% Not responsible for grandchildrenWhite alone, not Hispanic / Latino 23 9.1% Responsible for grandchildren234 90.9% Not responsible for grandchildren