Races in Holtsville, New York (NY) Detailed Stats
Data:
Races - White alone (%)
Races - White alone (% change since 2000)
Races - Black alone (%)
Races - Black alone (% change since 2000)
Races - American Indian alone (%)
Races - American Indian alone (% change since 2000)
Races - Asian alone (%)
Races - Asian alone (% change since 2000)
Races - Hispanic (%)
Races - Hispanic (% change since 2000)
Races - Native Hawaiian and Other Pacific Islander alone (%)
Races - Native Hawaiian and Other Pacific Islander alone (% change since 2000)
Races - Two or more races(%)
Races - Two or more races(% change since 2000)
Races - Other race alone (%)
Races - Other race alone (% change since 2000)
Racial diversity
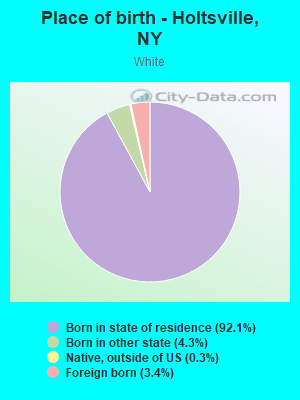
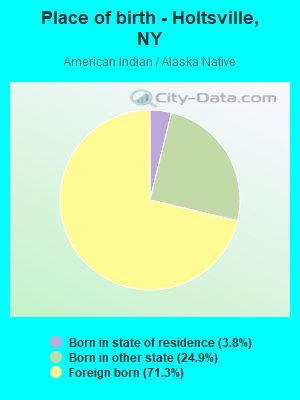
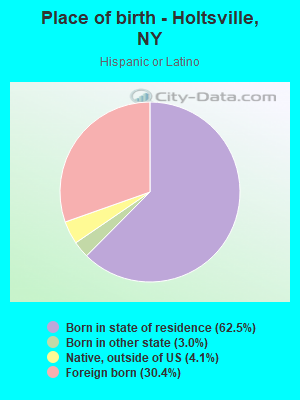
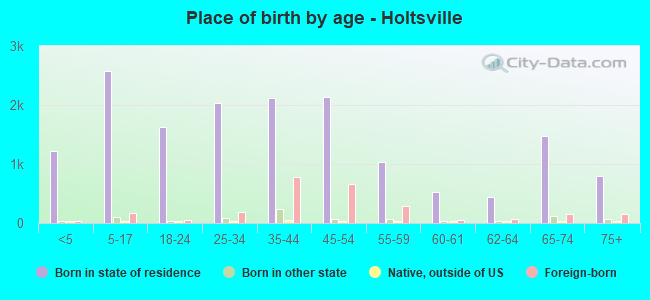
Place of birth - Born in state of residence (%)
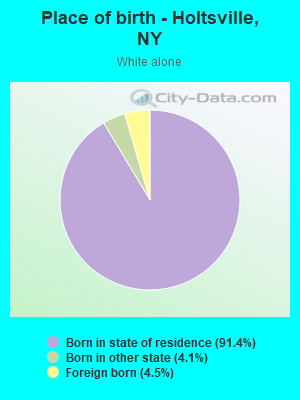
Place of birth - Born in state of residence (%) - White
Place of birth - Born in state of residence (%) - Black or African American
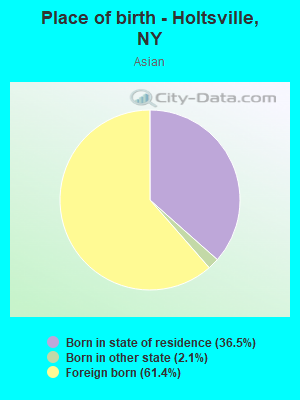
Place of birth - Born in state of residence (%) - Asian
Place of birth - Born in state of residence (%) - Hispanic or Latino
Place of birth - Born in state of residence (%) - American Indian and Alaska Native
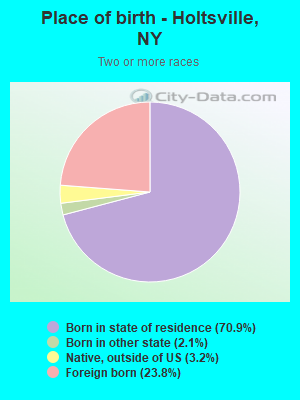
Place of birth - Born in state of residence (%) - Multirace
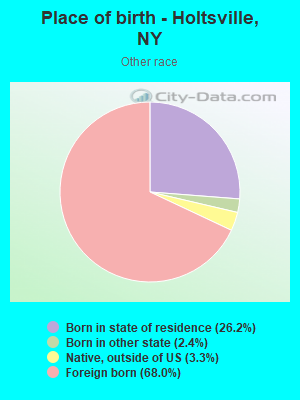
Place of birth - Born in state of residence (%) - Other Race
Place of birth - Born in other state (%)
Place of birth - Born in other state (%) - White
Place of birth - Born in other state (%) - Black or African American
Place of birth - Born in other state (%) - Asian
Place of birth - Born in other state (%) - Hispanic or Latino
Place of birth - Born in other state (%) - American Indian and Alaska Native
Place of birth - Born in other state (%) - Multirace
Place of birth - Born in other state (%) - Other Race
Place of birth - Native, outside of US (%)
Place of birth - Native, outside of US (%) - White
Place of birth - Native, outside of US (%) - Black or African American
Place of birth - Native, outside of US (%) - Asian
Place of birth - Native, outside of US (%) - Hispanic or Latino
Place of birth - Native, outside of US (%) - American Indian and Alaska Native
Place of birth - Native, outside of US (%) - Multirace
Place of birth - Native, outside of US (%) - Other Race
Place of birth - Foreign born (%)
Place of birth - Foreign born (%) - White
Place of birth - Foreign born (%) - Black or African American
Place of birth - Foreign born (%) - Asian
Place of birth - Foreign born (%) - Hispanic or Latino
Place of birth - Foreign born (%) - American Indian and Alaska Native
Place of birth - Foreign born (%) - Multirace
Place of birth - Foreign born (%) - Other Race
Residents speaking English at home (%)
Residents speaking English at home - Born in the United States (%)
Residents speaking English at home - Native, born elsewhere (%)
Residents speaking English at home - Foreign born (%)
Residents speaking Spanish at home (%)
Residents speaking Spanish at home - Born in the United States (%)
Residents speaking Spanish at home - Native, born elsewhere (%)
Residents speaking Spanish at home - Foreign born (%)
Residents speaking other language at home (%)
Residents speaking other language at home - Born in the United States (%)
Residents speaking other language at home - Native, born elsewhere (%)
Residents speaking other language at home - Foreign born (%)
Marital status - Never married (%)
Marital status - Now married (%)
Marital status - Separated (%)
Marital status - Widowed (%)
Marital status - Divorced (%)
Ancestries Reported - Arab (%)
Ancestries Reported - Czech (%)
Ancestries Reported - Danish (%)
Ancestries Reported - Dutch (%)
Ancestries Reported - English (%)
Ancestries Reported - French (%)
Ancestries Reported - French Canadian (%)
Ancestries Reported - German (%)
Ancestries Reported - Greek (%)
Ancestries Reported - Hungarian (%)
Ancestries Reported - Irish (%)
Ancestries Reported - Italian (%)
Ancestries Reported - Lithuanian (%)
Ancestries Reported - Norwegian (%)
Ancestries Reported - Polish (%)
Ancestries Reported - Portuguese (%)
Ancestries Reported - Russian (%)
Ancestries Reported - Scotch-Irish (%)
Ancestries Reported - Scottish (%)
Ancestries Reported - Slovak (%)
Ancestries Reported - Subsaharan African (%)
Ancestries Reported - Swedish (%)
Ancestries Reported - Swiss (%)
Ancestries Reported - Ukrainian (%)
Ancestries Reported - United States (%)
Ancestries Reported - Welsh (%)
Ancestries Reported - West Indian (%)
Ancestries Reported - Other (%)
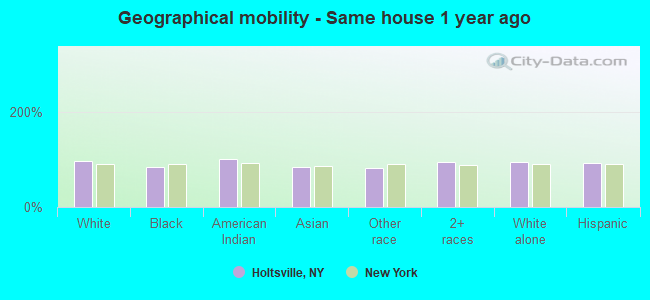
Geographical mobility - Same house 1 year ago (%)
Geographical mobility - Same house 1 year ago (%) - White
Geographical mobility - Same house 1 year ago (%) - Black or African American
Geographical mobility - Same house 1 year ago (%) - Asian
Geographical mobility - Same house 1 year ago (%) - Hispanic or Latino
Geographical mobility - Same house 1 year ago (%) - American Indian and Alaska Native
Geographical mobility - Same house 1 year ago (%) - Multirace
Geographical mobility - Same house 1 year ago (%) - Other Race
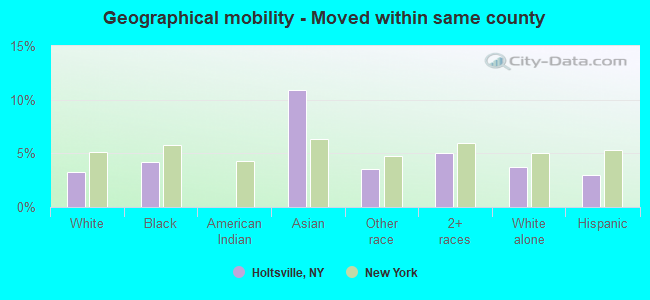
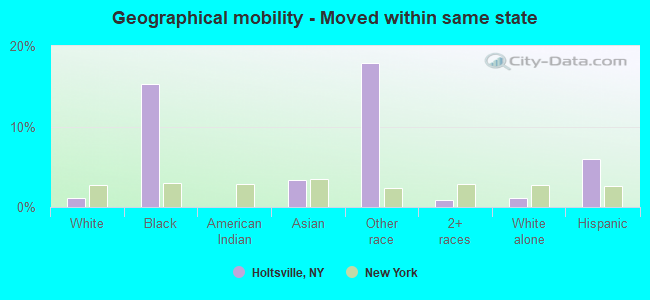
Geographical mobility - Moved within same county (%)
Geographical mobility - Moved within same county (%) - White
Geographical mobility - Moved within same county (%) - Black or African American
Geographical mobility - Moved within same county (%) - Asian
Geographical mobility - Moved within same county (%) - Hispanic or Latino
Geographical mobility - Moved within same county (%) - American Indian and Alaska Native
Geographical mobility - Moved within same county (%) - Multirace
Geographical mobility - Moved within same county (%) - Other Race
Geographical mobility - Moved from different county within same state (%)
Geographical mobility - Moved from different county within same state (%) - White
Geographical mobility - Moved from different county within same state (%) - Black or African American
Geographical mobility - Moved from different county within same state (%) - Asian
Geographical mobility - Moved from different county within same state (%) - Hispanic or Latino
Geographical mobility - Moved from different county within same state (%) - American Indian and Alaska Native
Geographical mobility - Moved from different county within same state (%) - Multirace
Geographical mobility - Moved from different county within same state (%) - Other Race
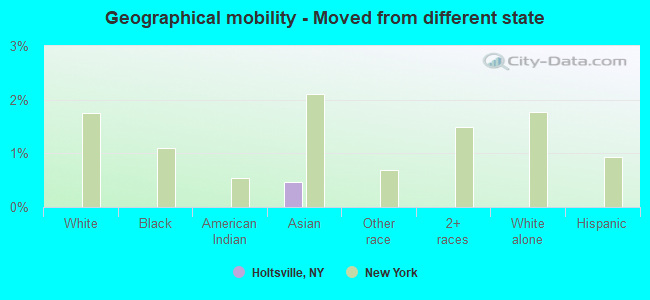
Geographical mobility - Moved from different state (%)
Geographical mobility - Moved from different state (%) - White
Geographical mobility - Moved from different state (%) - Black or African American
Geographical mobility - Moved from different state (%) - Asian
Geographical mobility - Moved from different state (%) - Hispanic or Latino
Geographical mobility - Moved from different state (%) - American Indian and Alaska Native
Geographical mobility - Moved from different state (%) - Multirace
Geographical mobility - Moved from different state (%) - Other Race
Geographical mobility - Moved from abroad (%)
Geographical mobility - Moved from abroad (%) - White
Geographical mobility - Moved from abroad (%) - Black or African American
Geographical mobility - Moved from abroad (%) - Asian
Geographical mobility - Moved from abroad (%) - Hispanic or Latino
Geographical mobility - Moved from abroad (%) - American Indian and Alaska Native
Geographical mobility - Moved from abroad (%) - Multirace
Geographical mobility - Moved from abroad (%) - Other Race
Place of birth for the foreign-born population - Ireland (%)
Place of birth for the foreign-born population - Denmark (%)
Place of birth for the foreign-born population - Norway (%)
Place of birth for the foreign-born population - Sweden (%)
Place of birth for the foreign-born population - United Kingdom (%)
Place of birth for the foreign-born population - England (%)
Place of birth for the foreign-born population - Scotland (%)
Place of birth for the foreign-born population - Other Northern Europe (%)
Place of birth for the foreign-born population - Austria (%)
Place of birth for the foreign-born population - Belgium (%)
Place of birth for the foreign-born population - France (%)
Place of birth for the foreign-born population - Germany (%)
Place of birth for the foreign-born population - Netherlands (%)
Place of birth for the foreign-born population - Switzerland (%)
Place of birth for the foreign-born population - Other Western Europe (%)
Place of birth for the foreign-born population - Greece (%)
Place of birth for the foreign-born population - Italy (%)
Place of birth for the foreign-born population - Portugal (%)
Place of birth for the foreign-born population - Spain (%)
Place of birth for the foreign-born population - Other Southern Europe (%)
Place of birth for the foreign-born population - Albania (%)
Place of birth for the foreign-born population - Belarus (%)
Place of birth for the foreign-born population - Bosnia and Herzegovina (%)
Place of birth for the foreign-born population - Bulgaria (%)
Place of birth for the foreign-born population - Croatia (%)
Place of birth for the foreign-born population - Czechoslovakia (%)
Place of birth for the foreign-born population - Hungary (%)
Place of birth for the foreign-born population - Latvia (%)
Place of birth for the foreign-born population - Lithuania (%)
Place of birth for the foreign-born population - North Macedonia (Macedonia) (%)
Place of birth for the foreign-born population - Moldova (%)
Place of birth for the foreign-born population - Poland (%)
Place of birth for the foreign-born population - Romania (%)
Place of birth for the foreign-born population - Russia (%)
Place of birth for the foreign-born population - Serbia (%)
Place of birth for the foreign-born population - Ukraine (%)
Place of birth for the foreign-born population - Other Eastern Europe (%)
Place of birth for the foreign-born population - China (%)
Place of birth for the foreign-born population - Hong Kong (%)
Place of birth for the foreign-born population - Taiwan (%)
Place of birth for the foreign-born population - Japan (%)
Place of birth for the foreign-born population - Korea (%)
Place of birth for the foreign-born population - Other Eastern Asia (%)
Place of birth for the foreign-born population - Afghanistan (%)
Place of birth for the foreign-born population - Bangladesh (%)
Place of birth for the foreign-born population - India (%)
Place of birth for the foreign-born population - Iran (%)
Place of birth for the foreign-born population - Kazakhstan (%)
Place of birth for the foreign-born population - Nepal (%)
Place of birth for the foreign-born population - Pakistan (%)
Place of birth for the foreign-born population - Sri Lanka (%)
Place of birth for the foreign-born population - Uzbekistan (%)
Place of birth for the foreign-born population - Other South Central Asia (%)
Place of birth for the foreign-born population - Burma (%)
Place of birth for the foreign-born population - Cambodia (%)
Place of birth for the foreign-born population - Indonesia (%)
Place of birth for the foreign-born population - Laos (%)
Place of birth for the foreign-born population - Malaysia (%)
Place of birth for the foreign-born population - Philippines (%)
Place of birth for the foreign-born population - Singapore (%)
Place of birth for the foreign-born population - Thailand (%)
Place of birth for the foreign-born population - Vietnam (%)
Place of birth for the foreign-born population - Other South Eastern Asia (%)
Place of birth for the foreign-born population - Armenia (%)
Place of birth for the foreign-born population - Iraq (%)
Place of birth for the foreign-born population - Israel (%)
Place of birth for the foreign-born population - Jordan (%)
Place of birth for the foreign-born population - Kuwait (%)
Place of birth for the foreign-born population - Lebanon (%)
Place of birth for the foreign-born population - Saudi Arabia (%)
Place of birth for the foreign-born population - Syria (%)
Place of birth for the foreign-born population - Turkey (%)
Place of birth for the foreign-born population - Yemen (%)
Place of birth for the foreign-born population - Other Western Asia (%)
Place of birth for the foreign-born population - Eritrea (%)
Place of birth for the foreign-born population - Ethiopia (%)
Place of birth for the foreign-born population - Kenya (%)
Place of birth for the foreign-born population - Somalia (%)
Place of birth for the foreign-born population - Uganda (%)
Place of birth for the foreign-born population - Zimbabwe (%)
Place of birth for the foreign-born population - Other Eastern Africa (%)
Place of birth for the foreign-born population - Cameroon (%)
Place of birth for the foreign-born population - Congo (%)
Place of birth for the foreign-born population - Democratic Republic of Congo (Zaire) (%)
Place of birth for the foreign-born population - Other Middle Africa (%)
Place of birth for the foreign-born population - Egypt (%)
Place of birth for the foreign-born population - Morocco (%)
Place of birth for the foreign-born population - Sudan (%)
Place of birth for the foreign-born population - Other Northern Africa (%)
Place of birth for the foreign-born population - South Africa (%)
Place of birth for the foreign-born population - Other Southern Africa (%)
Place of birth for the foreign-born population - Cabo Verde (%)
Place of birth for the foreign-born population - Ghana (%)
Place of birth for the foreign-born population - Liberia (%)
Place of birth for the foreign-born population - Nigeria (%)
Place of birth for the foreign-born population - Senegal (%)
Place of birth for the foreign-born population - Sierra Leone (%)
Place of birth for the foreign-born population - Other Western Africa (%)
Place of birth for the foreign-born population - Australia (%)
Place of birth for the foreign-born population - New Zealand (%)
Place of birth for the foreign-born population - Fiji (%)
Place of birth for the foreign-born population - Micronesia (%)
Place of birth for the foreign-born population - Bahamas (%)
Place of birth for the foreign-born population - Barbados (%)
Place of birth for the foreign-born population - Cuba (%)
Place of birth for the foreign-born population - Dominica (%)
Place of birth for the foreign-born population - Dominican Republic (%)
Place of birth for the foreign-born population - Grenada (%)
Place of birth for the foreign-born population - Haiti (%)
Place of birth for the foreign-born population - Jamaica (%)
Place of birth for the foreign-born population - St. Vincent and the Grenadines (%)
Place of birth for the foreign-born population - Trinidad and Tobago (%)
Place of birth for the foreign-born population - West Indies (%)
Place of birth for the foreign-born population - Other Caribbean (%)
Place of birth for the foreign-born population - Belize (%)
Place of birth for the foreign-born population - Costa Rica (%)
Place of birth for the foreign-born population - El Salvador (%)
Place of birth for the foreign-born population - Guatemala (%)
Place of birth for the foreign-born population - Honduras (%)
Place of birth for the foreign-born population - Mexico (%)
Place of birth for the foreign-born population - Nicaragua (%)
Place of birth for the foreign-born population - Panama (%)
Place of birth for the foreign-born population - Other Central America (%)
Place of birth for the foreign-born population - Argentina (%)
Place of birth for the foreign-born population - Bolivia (%)
Place of birth for the foreign-born population - Brazil (%)
Place of birth for the foreign-born population - Chile (%)
Place of birth for the foreign-born population - Colombia (%)
Place of birth for the foreign-born population - Ecuador (%)
Place of birth for the foreign-born population - Guyana (%)
Place of birth for the foreign-born population - Peru (%)
Place of birth for the foreign-born population - Uruguay (%)
Place of birth for the foreign-born population - Venezuela (%)
Place of birth for the foreign-born population - Other South America (%)
Place of birth for the foreign-born population - Canada (%)
Place of birth for the foreign-born population - Other Northern America (%)
Place of birth for the foreign-born population - Other (%)
Latest news about races in Holtsville, NY collected exclusively by city-data.com from local newspapers, TV, and radio stations
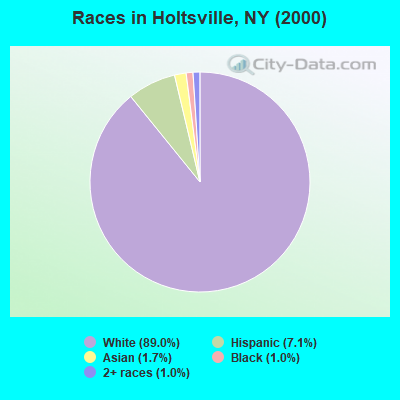
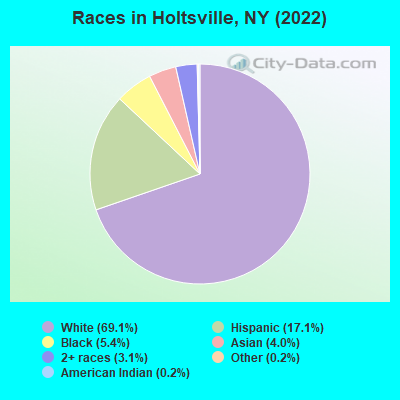
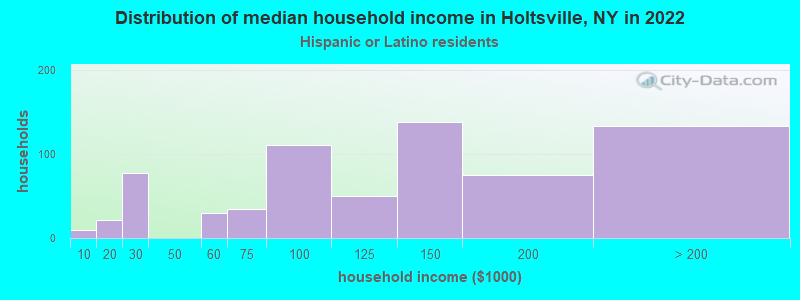
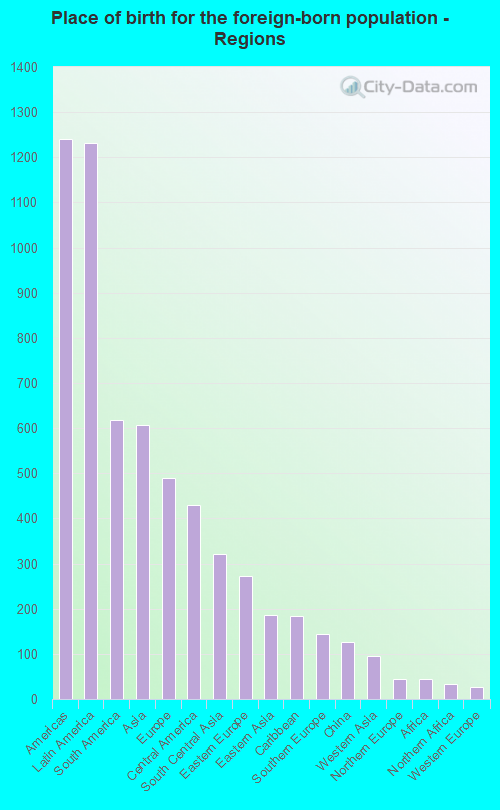
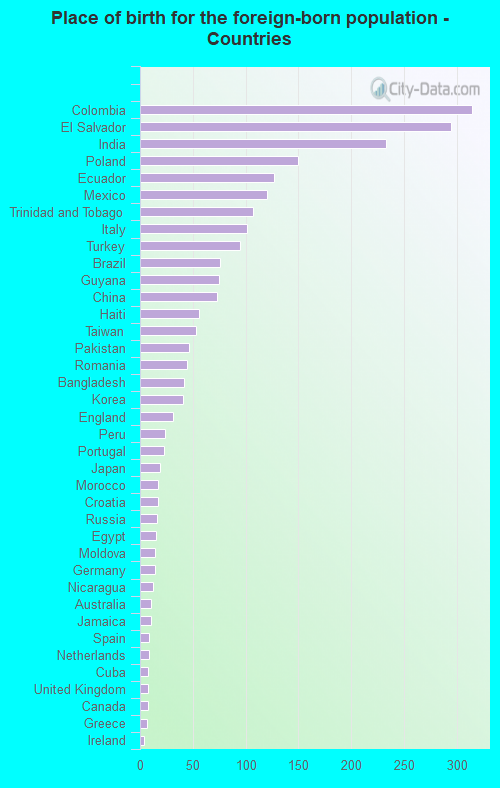
According to 2022 data, the most numerous races in Holtsville, NY are White alone (13,553 residents), Hispanic (3,347 residents), and Black alone (1,068 residents). 80.0% of Holtsville residents speak English at home. 12.2% of Holtsville, NY residents are foreign-born (6.4% born in Latin America, 3.1% born in Asia, 2.5% born in Europe), which is 80.3% less than the foreign-born rate of 22.0% across the entire state of New York.
Race distribution in Holtsville
2000 2022
11,760,981 62.0% White alone 2,867,583 15.1% Hispanic 2,812,623 14.8% Black alone 1,035,926 5.5% Asian alone 366,116 1.9% Two or more races 75,499 0.4% Other race alone 52,499 0.3% American Indian alone 5,230 0.03% Native Hawaiian and Other
10,408,933 52.9% White alone 3,867,299 19.7% Hispanic 2,633,840 13.4% Black alone 1,776,286 9.0% Asian alone 732,670 3.7% Two or more races 216,110 1.1% Other race alone 35,082 0.2% American Indian alone 6,931 0.04% Native Hawaiian and Other
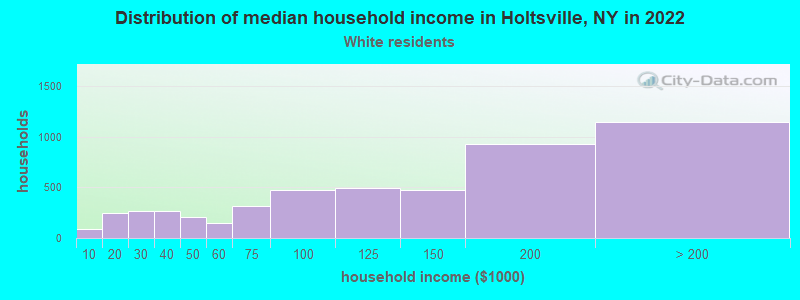
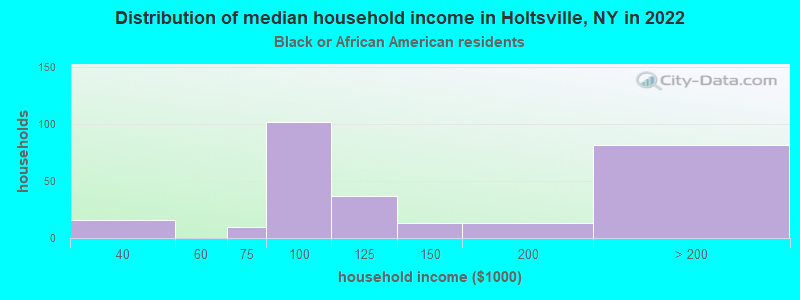
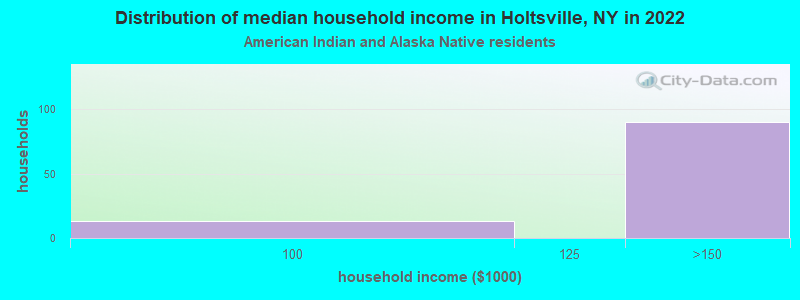
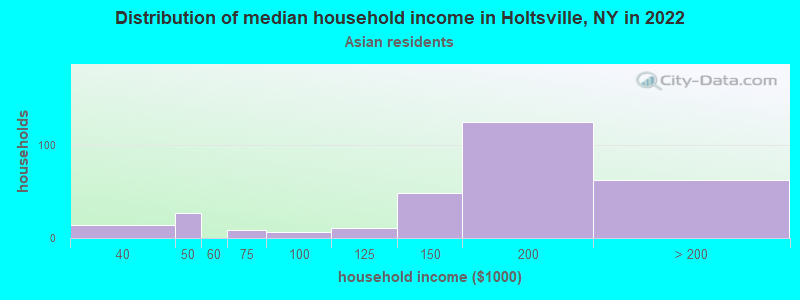
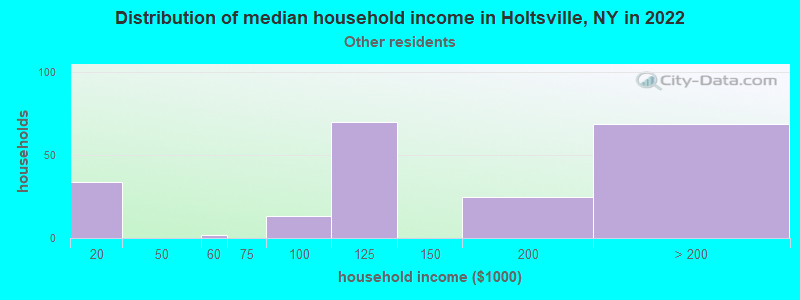
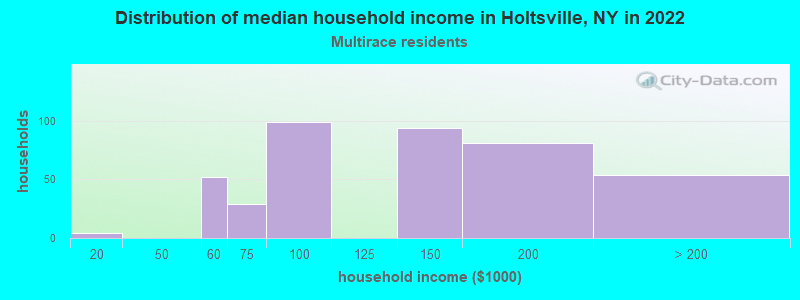
Income and house value in Holtsville Median household income in 2022 $125,218 White non-Hispanic householders$107,771 Black householders$148,191 Asian householders$138,830 Two or more races householders$113,134 Hispanic or Latino race householdersMedian 2022 house value $512,495 White Non-Hispanic householders$496,938 Black or African American householders $516,684 Asian householders$545,704 Some other race householders$574,426 Two or more races householders$508,008 Hispanic or Latino householders
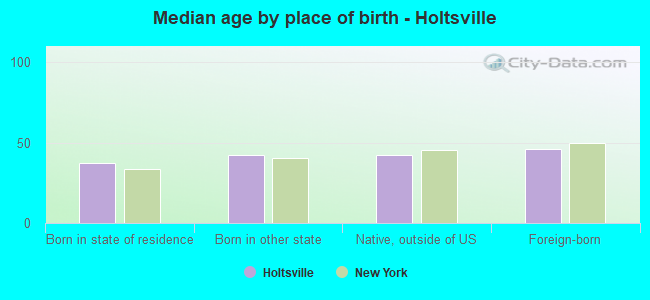
Median age by race in Holtsville
42.1 Median age for White residents41.0 44.0 36.9 Median age for Black or African American residents37.8 31.4 51.2 Median age for American Indian / Alaska Native residents-807,017,543.1 -513,692,161.9 40.0 Median age for Asian residents39.2 49.3 -742,816,091.2 Median age for Native Hawaiian / Pacific Islander residents-831,187,409.8 -771,300,447.7 41.6 Median age for Other race residents42.0 36.2 29.6 Median age for Two or more races residents28.9 30.3 40.9 Median age for White alone residents39.6 43.6 40.3 Median age for Hispanic or Latino residents43.6 30.9
Owner/renter occupied households by race in Holtsville
House owners and renters - White residents 4,476 87.8% Owner occupied623 12.2% Renter occupiedHouse owners and renters - Black or African American residents 131 44.4% Owner occupied164 55.6% Renter occupiedHouse owners and renters - American Indian / Alaska Native residents 10 7.0% Owner occupied134 93.0% Renter occupiedHouse owners and renters - Asian residents 195 70.7% Owner occupied81 29.3% Renter occupiedHouse owners and renters - Other race residents 166 83.8% Owner occupied32 16.2% Renter occupiedHouse owners and renters - Two or more races residents 376 89.0% Owner occupied46 11.0% Renter occupiedHouse owners and renters - White alone residents 4,336 88.2% Owner occupied580 11.8% Renter occupiedHouse owners and renters - Hispanic or Latino residents 542 71.0% Owner occupied221 29.0% Renter occupied
Language usage in Holtsville
English speakers - Total 80.0% of residents of Holtsville speak English at home.
9.6% of residents speak Spanish at home 987 55.9% Speak English very well779 44.1% Speak English less than very well10.0% of residents speak other language at home 1,209 65.4% Speak English very well639 34.6% Speak English less than very well
English speakers - Born in the United States 83.5% of residents of Holtsville speak English at home.
4.0% of residents speak Spanish at home 31 100.0% Speak English very well15.6% of residents speak other language at home 42 34.4% Speak English very well80 65.6% Speak English less than very well
English speakers - Native, born elsewhere 0.7% of residents of Holtsville speak English at home.
84.3% of residents speak Spanish at home 85 65.9% Speak English very well44 34.1% Speak English less than very well
English speakers - Foreign-born 20.0% of residents of Holtsville speak English at home.
37.2% of residents speak Spanish at home 287 29.7% Speak English very well680 70.3% Speak English less than very well42.2% of residents speak other language at home 577 52.6% Speak English very well519 47.4% Speak English less than very well
White (Caucasian) - Speak only English Native:
96.6% (12,445)Foreign-born:
26.8% (128)
White (Caucasian) - Speak another language Native:
3.8% (494)Foreign-born:
72.3% (347)
Black or African American - Speak only English Native:
92.5% (753)Foreign-born:
99.3% (284)
Black or African American - Speak another language Native:
6.0% (49)Foreign-born:
9.6% (27)
American Indian / Alaska Native - Speak another language Native:
100.0% (81)Foreign-born:
100.0% (252)
Asian - Speak only English Native:
11.4% (29)Foreign-born:
7.0% (34)
Asian - Speak another language Native:
94.8% (239)Foreign-born:
96.2% (470)
Other race - Speak only English Native:
58.0% (228)Foreign-born:
9.8% (81)
Other race - Speak another language Native:
44.1% (173)Foreign-born:
89.7% (739)
Two or more races - Speak only English Native:
52.9% (549)Foreign-born:
5.7% (24)
Two or more races - Speak another language Native:
46.6% (485)Foreign-born:
95.1% (394)
White alone - Speak only English Native:
97.6% (11,854)Foreign-born:
22.8% (140)
White alone - Speak another language Native:
2.3% (282)Foreign-born:
77.2% (474)
Hispanic or Latino - Speak only English Native:
62.7% (1,299)Foreign-born:
6.7% (67)
Hispanic or Latino - Speak another language Native:
38.2% (790)Foreign-born:
93.4% (941)
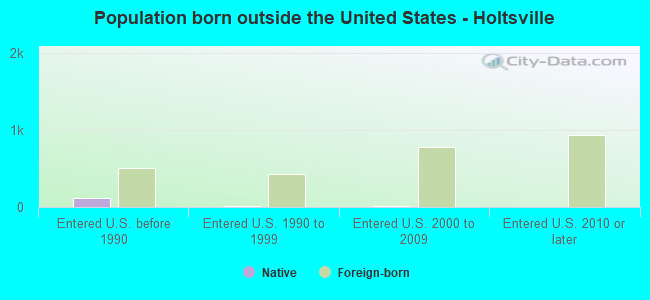
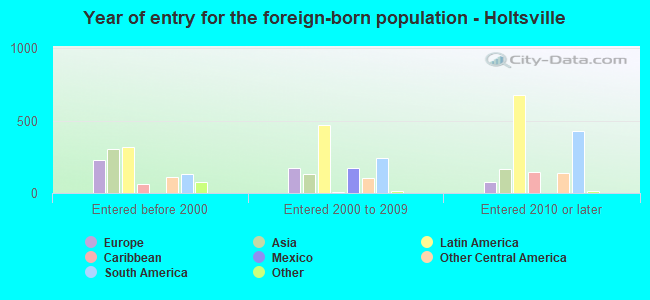
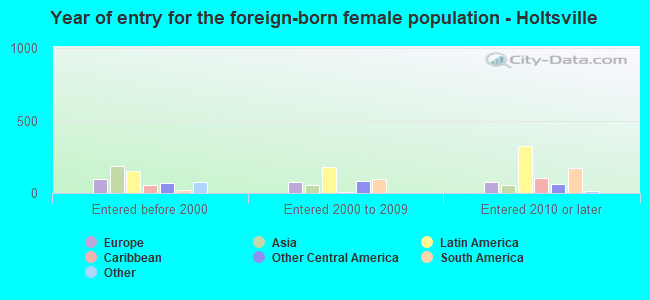
Foreign-born residents in Holtsville 2,393 residents are foreign born (6.4% Latin America , 3.1% Asia , 2.5% Europe ).
This city:
12.2%New York:
22.6%
Marital status for residents in Holtsville Marital status - White (Caucasian) population 15 years and over
Males 33.5% Never married54.7% Now married0.3% Separated3.7% Widowed7.8% DivorcedFemales 30.6% Never married50.8% Now married0.4% Separated7.4% Widowed10.8% DivorcedWomen who gave birth in the past 12 months Now married:
54.9% (121)Unmarried:
45.1% (100)
Women who did not give birth in the past 12 months Now married:
41.0% (1,198)Unmarried:
59.0% (1,727)
Marital status - Black or African American population 15 years and over
Males 45.5% Never married54.5% Now married0.0% Separated0.0% Widowed0.0% DivorcedFemales 44.2% Never married50.0% Now married5.8% Separated0.0% Widowed0.0% DivorcedWomen who did not give birth in the past 12 months Now married:
49.5% (158)Unmarried:
50.5% (161)
Marital status - American Indian / Alaska Native population 15 years and over
Males 100.0% Never married0.0% Now married0.0% Separated0.0% Widowed0.0% DivorcedFemales 15.3% Never married84.7% Now married0.0% Separated0.0% Widowed0.0% DivorcedWomen who did not give birth in the past 12 months Now married:
84.7% (72)Unmarried:
15.3% (13)
Marital status - Asian population 15 years and over
Males 35.4% Never married57.8% Now married0.0% Separated1.9% Widowed5.0% DivorcedFemales 14.5% Never married60.5% Now married17.8% Separated4.3% Widowed3.0% DivorcedWomen who gave birth in the past 12 months Now married:
100.0% (33)Unmarried:
0.0% (0)
Women who did not give birth in the past 12 months Now married:
70.9% (86)Unmarried:
29.1% (35)
Marital status - Other race population 15 years and over
Males 54.8% Never married34.6% Now married0.0% Separated0.0% Widowed10.6% DivorcedFemales 56.7% Never married42.7% Now married0.6% Separated0.0% Widowed0.0% DivorcedWomen who did not give birth in the past 12 months Now married:
34.7% (127)Unmarried:
65.3% (239)
Marital status - Two or more races population 15 years and over
Males 41.9% Never married52.5% Now married0.0% Separated0.0% Widowed5.7% DivorcedFemales 27.5% Never married45.8% Now married1.3% Separated7.4% Widowed18.1% DivorcedWomen who gave birth in the past 12 months Now married:
100.0% (20)Unmarried:
0.0% (0)
Women who did not give birth in the past 12 months Now married:
44.6% (127)Unmarried:
55.4% (158)
Marital status - White alone, not Hispanic / Latino population 15 years and over
Males 32.7% Never married56.6% Now married0.4% Separated2.6% Widowed7.7% DivorcedFemales 31.1% Never married50.6% Now married0.4% Separated7.3% Widowed10.7% DivorcedWomen who gave birth in the past 12 months Now married:
52.5% (119)Unmarried:
47.5% (108)
Women who did not give birth in the past 12 months Now married:
41.3% (1,243)Unmarried:
58.7% (1,765)
Marital status - Hispanic or Latino population 15 years and over
Males 51.4% Never married35.1% Now married0.0% Separated5.5% Widowed8.0% DivorcedFemales 39.2% Never married43.9% Now married0.8% Separated7.4% Widowed8.8% DivorcedWomen who gave birth in the past 12 months Now married:
100.0% (28)Unmarried:
0.0% (0)
Women who did not give birth in the past 12 months Now married:
30.0% (165)Unmarried:
70.0% (386)
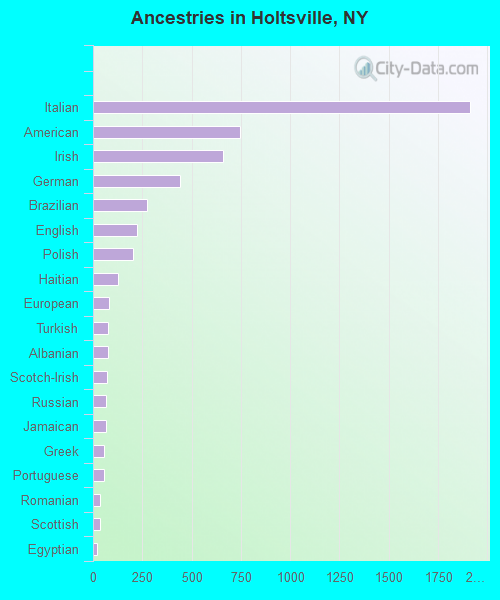
Ancestries in Holtsville
1,913 23.7% Italian747 9.2% American659 8.2% Irish441 5.5% German276 3.4% Brazilian223 2.8% English201 2.5% Polish129 1.6% Haitian82 1.0% European76 0.9% Turkish74 0.9% Albanian70 0.9% Scotch-Irish68 0.8% Russian65 0.8% Jamaican55 0.7% Greek54 0.7% Portuguese36 0.4% Romanian36 0.4% Scottish19 0.2% Egyptian16 0.2% Croatian16 0.2% Ukrainian13 0.2% French Canadian12 0.1% Afghan12 0.1% Nigerian11 0.1% Guyanese10 0.1% Moroccan8 0.10% Dutch8 0.10% Eastern European6 0.07% British4 0.05% West Indian
Children Nativity (place of birth) in Holtsville
Children under 6 years - Living with two parents Both parents native 980 100.0% NativeBoth parents foreign-born 94 100.0% NativeOne native, one foreign-born parent 64 100.0% NativeChildren under 6 years - Living with one parent Native parent 200 100.0% NativeForeign-born parent 36 100.0% NativeChildren 6 to 17 years - Living with two parents Both parents native 1,352 98.3% Native24 1.7% Foreign-bornBoth parents foreign-born 212 87.9% Native29 12.1% Foreign-bornOne native, one foreign-born parent 117 100.0% NativeChildren 6 to 17 years - Living with one parent Native parent 629 88.2% Native84 11.8% Foreign-bornForeign-born parent 88 92.7% Native7 7.3% Foreign-born
Grandparents responsible for own grandchildren in Holtsville
Grandparents (30 to 59 years) White / Caucasian 16 19.5% Responsible for grandchildren65 80.5% Not responsible for grandchildrenBlack or African American 20 100.0% Not responsible for grandchildrenOther race 39 100.0% Not responsible for grandchildrenTwo or more races 81 100.0% Not responsible for grandchildrenWhite alone, not Hispanic / Latino 15 17.1% Responsible for grandchildren75 82.9% Not responsible for grandchildrenHispanic or Latino 74 100.0% Not responsible for grandchildrenGrandparents (60 years and over) White / Caucasian 19 7.2% Responsible for grandchildren238 92.8% Not responsible for grandchildrenOther race 3 100.0% Responsible for grandchildrenTwo or more races 10 100.0% Not responsible for grandchildrenWhite alone, not Hispanic / Latino 22 8.3% Responsible for grandchildren247 91.7% Not responsible for grandchildrenHispanic or Latino 1 4.5% Responsible for grandchildren27 95.5% Not responsible for grandchildren