Races in Homewood, Illinois (IL) Detailed Stats
Data:
Races - White alone (%)
Races - White alone (% change since 2000)
Races - Black alone (%)
Races - Black alone (% change since 2000)
Races - American Indian alone (%)
Races - American Indian alone (% change since 2000)
Races - Asian alone (%)
Races - Asian alone (% change since 2000)
Races - Hispanic (%)
Races - Hispanic (% change since 2000)
Races - Native Hawaiian and Other Pacific Islander alone (%)
Races - Native Hawaiian and Other Pacific Islander alone (% change since 2000)
Races - Two or more races(%)
Races - Two or more races(% change since 2000)
Races - Other race alone (%)
Races - Other race alone (% change since 2000)
Racial diversity
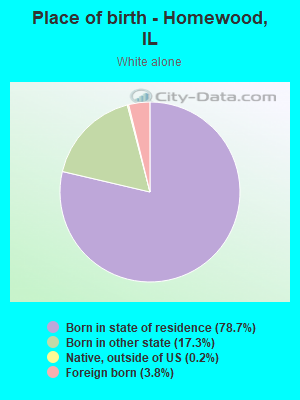
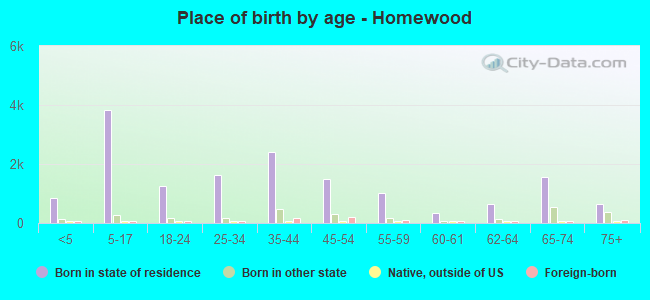
Place of birth - Born in state of residence (%)
Place of birth - Born in state of residence (%) - White
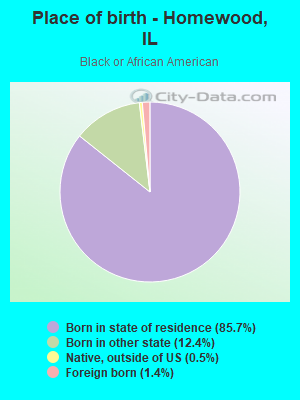
Place of birth - Born in state of residence (%) - Black or African American
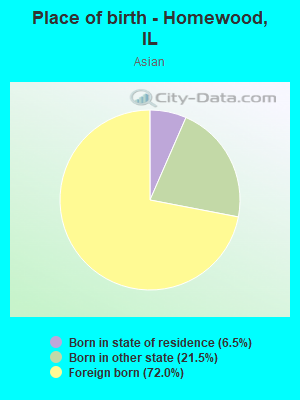
Place of birth - Born in state of residence (%) - Asian
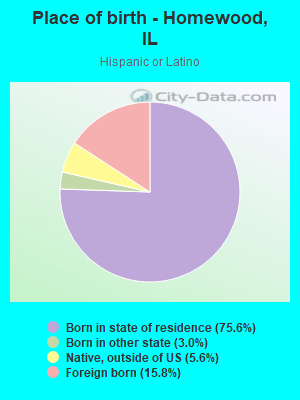
Place of birth - Born in state of residence (%) - Hispanic or Latino
Place of birth - Born in state of residence (%) - American Indian and Alaska Native
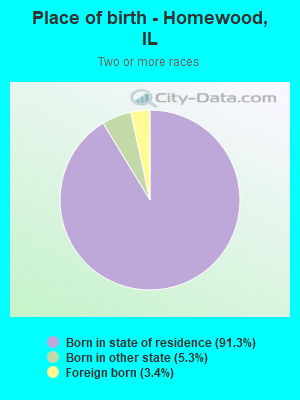
Place of birth - Born in state of residence (%) - Multirace
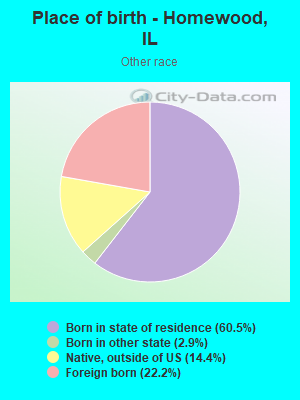
Place of birth - Born in state of residence (%) - Other Race
Place of birth - Born in other state (%)
Place of birth - Born in other state (%) - White
Place of birth - Born in other state (%) - Black or African American
Place of birth - Born in other state (%) - Asian
Place of birth - Born in other state (%) - Hispanic or Latino
Place of birth - Born in other state (%) - American Indian and Alaska Native
Place of birth - Born in other state (%) - Multirace
Place of birth - Born in other state (%) - Other Race
Place of birth - Native, outside of US (%)
Place of birth - Native, outside of US (%) - White
Place of birth - Native, outside of US (%) - Black or African American
Place of birth - Native, outside of US (%) - Asian
Place of birth - Native, outside of US (%) - Hispanic or Latino
Place of birth - Native, outside of US (%) - American Indian and Alaska Native
Place of birth - Native, outside of US (%) - Multirace
Place of birth - Native, outside of US (%) - Other Race
Place of birth - Foreign born (%)
Place of birth - Foreign born (%) - White
Place of birth - Foreign born (%) - Black or African American
Place of birth - Foreign born (%) - Asian
Place of birth - Foreign born (%) - Hispanic or Latino
Place of birth - Foreign born (%) - American Indian and Alaska Native
Place of birth - Foreign born (%) - Multirace
Place of birth - Foreign born (%) - Other Race
Residents speaking English at home (%)
Residents speaking English at home - Born in the United States (%)
Residents speaking English at home - Native, born elsewhere (%)
Residents speaking English at home - Foreign born (%)
Residents speaking Spanish at home (%)
Residents speaking Spanish at home - Born in the United States (%)
Residents speaking Spanish at home - Native, born elsewhere (%)
Residents speaking Spanish at home - Foreign born (%)
Residents speaking other language at home (%)
Residents speaking other language at home - Born in the United States (%)
Residents speaking other language at home - Native, born elsewhere (%)
Residents speaking other language at home - Foreign born (%)
Marital status - Never married (%)
Marital status - Now married (%)
Marital status - Separated (%)
Marital status - Widowed (%)
Marital status - Divorced (%)
Ancestries Reported - Arab (%)
Ancestries Reported - Czech (%)
Ancestries Reported - Danish (%)
Ancestries Reported - Dutch (%)
Ancestries Reported - English (%)
Ancestries Reported - French (%)
Ancestries Reported - French Canadian (%)
Ancestries Reported - German (%)
Ancestries Reported - Greek (%)
Ancestries Reported - Hungarian (%)
Ancestries Reported - Irish (%)
Ancestries Reported - Italian (%)
Ancestries Reported - Lithuanian (%)
Ancestries Reported - Norwegian (%)
Ancestries Reported - Polish (%)
Ancestries Reported - Portuguese (%)
Ancestries Reported - Russian (%)
Ancestries Reported - Scotch-Irish (%)
Ancestries Reported - Scottish (%)
Ancestries Reported - Slovak (%)
Ancestries Reported - Subsaharan African (%)
Ancestries Reported - Swedish (%)
Ancestries Reported - Swiss (%)
Ancestries Reported - Ukrainian (%)
Ancestries Reported - United States (%)
Ancestries Reported - Welsh (%)
Ancestries Reported - West Indian (%)
Ancestries Reported - Other (%)
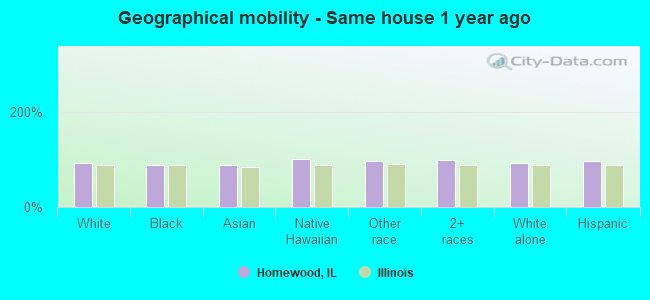
Geographical mobility - Same house 1 year ago (%)
Geographical mobility - Same house 1 year ago (%) - White
Geographical mobility - Same house 1 year ago (%) - Black or African American
Geographical mobility - Same house 1 year ago (%) - Asian
Geographical mobility - Same house 1 year ago (%) - Hispanic or Latino
Geographical mobility - Same house 1 year ago (%) - American Indian and Alaska Native
Geographical mobility - Same house 1 year ago (%) - Multirace
Geographical mobility - Same house 1 year ago (%) - Other Race
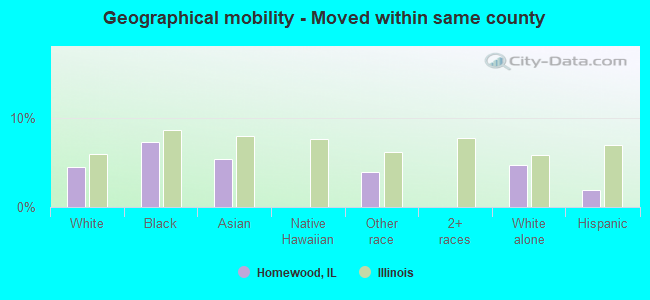
Geographical mobility - Moved within same county (%)
Geographical mobility - Moved within same county (%) - White
Geographical mobility - Moved within same county (%) - Black or African American
Geographical mobility - Moved within same county (%) - Asian
Geographical mobility - Moved within same county (%) - Hispanic or Latino
Geographical mobility - Moved within same county (%) - American Indian and Alaska Native
Geographical mobility - Moved within same county (%) - Multirace
Geographical mobility - Moved within same county (%) - Other Race
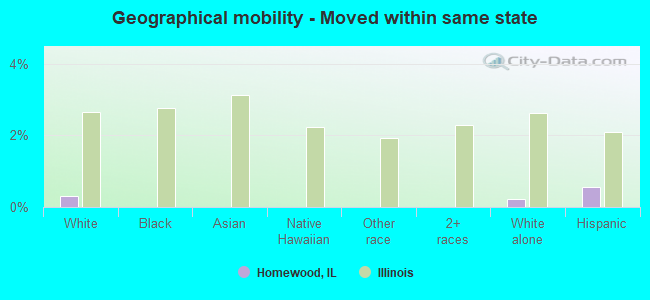
Geographical mobility - Moved from different county within same state (%)
Geographical mobility - Moved from different county within same state (%) - White
Geographical mobility - Moved from different county within same state (%) - Black or African American
Geographical mobility - Moved from different county within same state (%) - Asian
Geographical mobility - Moved from different county within same state (%) - Hispanic or Latino
Geographical mobility - Moved from different county within same state (%) - American Indian and Alaska Native
Geographical mobility - Moved from different county within same state (%) - Multirace
Geographical mobility - Moved from different county within same state (%) - Other Race
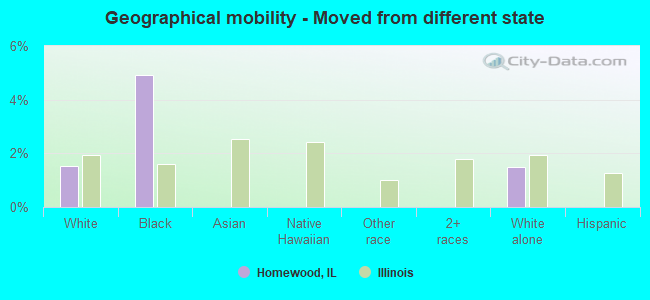
Geographical mobility - Moved from different state (%)
Geographical mobility - Moved from different state (%) - White
Geographical mobility - Moved from different state (%) - Black or African American
Geographical mobility - Moved from different state (%) - Asian
Geographical mobility - Moved from different state (%) - Hispanic or Latino
Geographical mobility - Moved from different state (%) - American Indian and Alaska Native
Geographical mobility - Moved from different state (%) - Multirace
Geographical mobility - Moved from different state (%) - Other Race
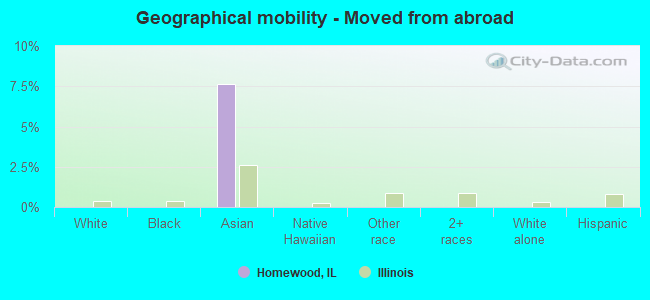
Geographical mobility - Moved from abroad (%)
Geographical mobility - Moved from abroad (%) - White
Geographical mobility - Moved from abroad (%) - Black or African American
Geographical mobility - Moved from abroad (%) - Asian
Geographical mobility - Moved from abroad (%) - Hispanic or Latino
Geographical mobility - Moved from abroad (%) - American Indian and Alaska Native
Geographical mobility - Moved from abroad (%) - Multirace
Geographical mobility - Moved from abroad (%) - Other Race
Place of birth for the foreign-born population - Ireland (%)
Place of birth for the foreign-born population - Denmark (%)
Place of birth for the foreign-born population - Norway (%)
Place of birth for the foreign-born population - Sweden (%)
Place of birth for the foreign-born population - United Kingdom (%)
Place of birth for the foreign-born population - England (%)
Place of birth for the foreign-born population - Scotland (%)
Place of birth for the foreign-born population - Other Northern Europe (%)
Place of birth for the foreign-born population - Austria (%)
Place of birth for the foreign-born population - Belgium (%)
Place of birth for the foreign-born population - France (%)
Place of birth for the foreign-born population - Germany (%)
Place of birth for the foreign-born population - Netherlands (%)
Place of birth for the foreign-born population - Switzerland (%)
Place of birth for the foreign-born population - Other Western Europe (%)
Place of birth for the foreign-born population - Greece (%)
Place of birth for the foreign-born population - Italy (%)
Place of birth for the foreign-born population - Portugal (%)
Place of birth for the foreign-born population - Spain (%)
Place of birth for the foreign-born population - Other Southern Europe (%)
Place of birth for the foreign-born population - Albania (%)
Place of birth for the foreign-born population - Belarus (%)
Place of birth for the foreign-born population - Bosnia and Herzegovina (%)
Place of birth for the foreign-born population - Bulgaria (%)
Place of birth for the foreign-born population - Croatia (%)
Place of birth for the foreign-born population - Czechoslovakia (%)
Place of birth for the foreign-born population - Hungary (%)
Place of birth for the foreign-born population - Latvia (%)
Place of birth for the foreign-born population - Lithuania (%)
Place of birth for the foreign-born population - North Macedonia (Macedonia) (%)
Place of birth for the foreign-born population - Moldova (%)
Place of birth for the foreign-born population - Poland (%)
Place of birth for the foreign-born population - Romania (%)
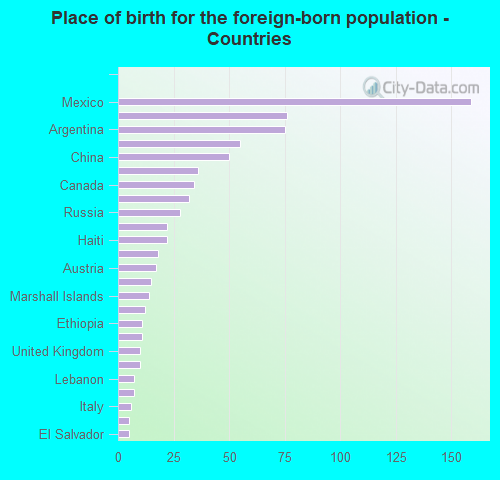
Place of birth for the foreign-born population - Russia (%)
Place of birth for the foreign-born population - Serbia (%)
Place of birth for the foreign-born population - Ukraine (%)
Place of birth for the foreign-born population - Other Eastern Europe (%)
Place of birth for the foreign-born population - China (%)
Place of birth for the foreign-born population - Hong Kong (%)
Place of birth for the foreign-born population - Taiwan (%)
Place of birth for the foreign-born population - Japan (%)
Place of birth for the foreign-born population - Korea (%)
Place of birth for the foreign-born population - Other Eastern Asia (%)
Place of birth for the foreign-born population - Afghanistan (%)
Place of birth for the foreign-born population - Bangladesh (%)
Place of birth for the foreign-born population - India (%)
Place of birth for the foreign-born population - Iran (%)
Place of birth for the foreign-born population - Kazakhstan (%)
Place of birth for the foreign-born population - Nepal (%)
Place of birth for the foreign-born population - Pakistan (%)
Place of birth for the foreign-born population - Sri Lanka (%)
Place of birth for the foreign-born population - Uzbekistan (%)
Place of birth for the foreign-born population - Other South Central Asia (%)
Place of birth for the foreign-born population - Burma (%)
Place of birth for the foreign-born population - Cambodia (%)
Place of birth for the foreign-born population - Indonesia (%)
Place of birth for the foreign-born population - Laos (%)
Place of birth for the foreign-born population - Malaysia (%)
Place of birth for the foreign-born population - Philippines (%)
Place of birth for the foreign-born population - Singapore (%)
Place of birth for the foreign-born population - Thailand (%)
Place of birth for the foreign-born population - Vietnam (%)
Place of birth for the foreign-born population - Other South Eastern Asia (%)
Place of birth for the foreign-born population - Armenia (%)
Place of birth for the foreign-born population - Iraq (%)
Place of birth for the foreign-born population - Israel (%)
Place of birth for the foreign-born population - Jordan (%)
Place of birth for the foreign-born population - Kuwait (%)
Place of birth for the foreign-born population - Lebanon (%)
Place of birth for the foreign-born population - Saudi Arabia (%)
Place of birth for the foreign-born population - Syria (%)
Place of birth for the foreign-born population - Turkey (%)
Place of birth for the foreign-born population - Yemen (%)
Place of birth for the foreign-born population - Other Western Asia (%)
Place of birth for the foreign-born population - Eritrea (%)
Place of birth for the foreign-born population - Ethiopia (%)
Place of birth for the foreign-born population - Kenya (%)
Place of birth for the foreign-born population - Somalia (%)
Place of birth for the foreign-born population - Uganda (%)
Place of birth for the foreign-born population - Zimbabwe (%)
Place of birth for the foreign-born population - Other Eastern Africa (%)
Place of birth for the foreign-born population - Cameroon (%)
Place of birth for the foreign-born population - Congo (%)
Place of birth for the foreign-born population - Democratic Republic of Congo (Zaire) (%)
Place of birth for the foreign-born population - Other Middle Africa (%)
Place of birth for the foreign-born population - Egypt (%)
Place of birth for the foreign-born population - Morocco (%)
Place of birth for the foreign-born population - Sudan (%)
Place of birth for the foreign-born population - Other Northern Africa (%)
Place of birth for the foreign-born population - South Africa (%)
Place of birth for the foreign-born population - Other Southern Africa (%)
Place of birth for the foreign-born population - Cabo Verde (%)
Place of birth for the foreign-born population - Ghana (%)
Place of birth for the foreign-born population - Liberia (%)
Place of birth for the foreign-born population - Nigeria (%)
Place of birth for the foreign-born population - Senegal (%)
Place of birth for the foreign-born population - Sierra Leone (%)
Place of birth for the foreign-born population - Other Western Africa (%)
Place of birth for the foreign-born population - Australia (%)
Place of birth for the foreign-born population - New Zealand (%)
Place of birth for the foreign-born population - Fiji (%)
Place of birth for the foreign-born population - Micronesia (%)
Place of birth for the foreign-born population - Bahamas (%)
Place of birth for the foreign-born population - Barbados (%)
Place of birth for the foreign-born population - Cuba (%)
Place of birth for the foreign-born population - Dominica (%)
Place of birth for the foreign-born population - Dominican Republic (%)
Place of birth for the foreign-born population - Grenada (%)
Place of birth for the foreign-born population - Haiti (%)
Place of birth for the foreign-born population - Jamaica (%)
Place of birth for the foreign-born population - St. Vincent and the Grenadines (%)
Place of birth for the foreign-born population - Trinidad and Tobago (%)
Place of birth for the foreign-born population - West Indies (%)
Place of birth for the foreign-born population - Other Caribbean (%)
Place of birth for the foreign-born population - Belize (%)
Place of birth for the foreign-born population - Costa Rica (%)
Place of birth for the foreign-born population - El Salvador (%)
Place of birth for the foreign-born population - Guatemala (%)
Place of birth for the foreign-born population - Honduras (%)
Place of birth for the foreign-born population - Mexico (%)
Place of birth for the foreign-born population - Nicaragua (%)
Place of birth for the foreign-born population - Panama (%)
Place of birth for the foreign-born population - Other Central America (%)
Place of birth for the foreign-born population - Argentina (%)
Place of birth for the foreign-born population - Bolivia (%)
Place of birth for the foreign-born population - Brazil (%)
Place of birth for the foreign-born population - Chile (%)
Place of birth for the foreign-born population - Colombia (%)
Place of birth for the foreign-born population - Ecuador (%)
Place of birth for the foreign-born population - Guyana (%)
Place of birth for the foreign-born population - Peru (%)
Place of birth for the foreign-born population - Uruguay (%)
Place of birth for the foreign-born population - Venezuela (%)
Place of birth for the foreign-born population - Other South America (%)
Place of birth for the foreign-born population - Canada (%)
Place of birth for the foreign-born population - Other Northern America (%)
Place of birth for the foreign-born population - Other (%)
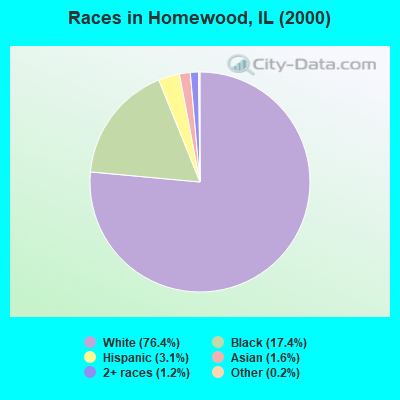
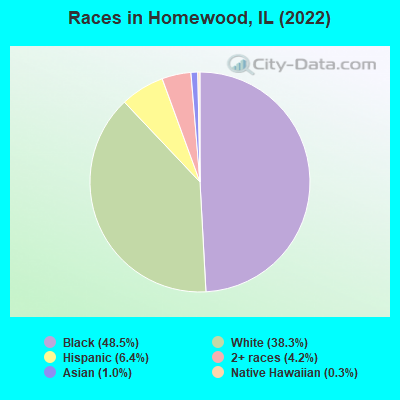
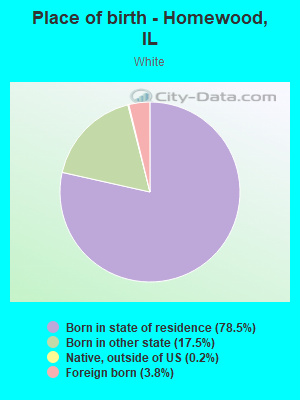
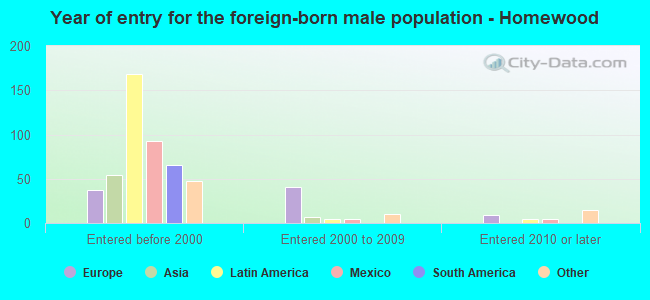
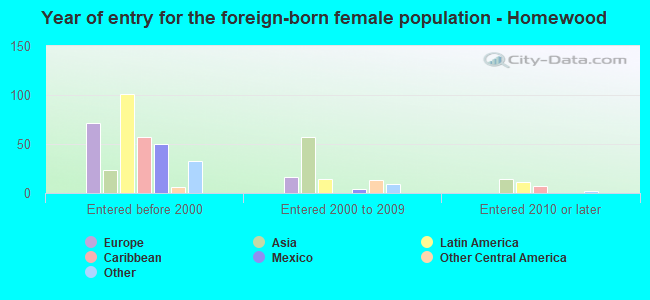
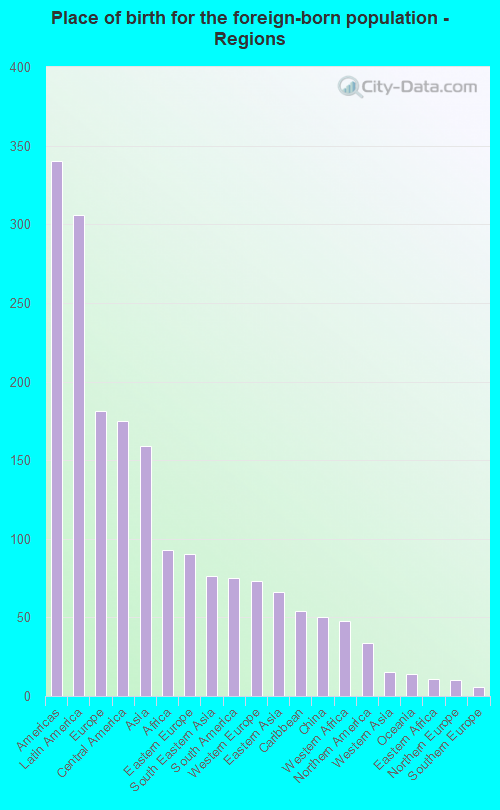
According to 2022 data, the most numerous races in Homewood, IL are White alone (7,441 residents), Hispanic (1,249 residents), and Black alone (9,425 residents). 91.7% of Homewood residents speak English at home. 4.1% of Homewood, IL residents are foreign-born (1.5% born in Latin America, 0.9% born in Europe, 0.8% born in Asia, 0.5% born in Africa), which is 244.3% less than the foreign-born rate of 14.0% across the entire state of Illinois.
Race distribution in Homewood
2000 2022
8,424,140 67.8% White alone 1,856,152 14.9% Black alone 1,530,262 12.3% Hispanic 419,916 3.4% Asian alone 153,996 1.2% Two or more races 13,479 0.1% Other race alone 18,232 0.1% American Indian alone 3,116 0.03% Native Hawaiian and Other
7,356,301 58.5% White alone 2,299,726 18.3% Hispanic 1,660,423 13.2% Black alone 747,296 5.9% Asian alone 458,599 3.6% Two or more races 45,386 0.4% Other race alone 10,405 0.08% American Indian alone 3,896 0.03% Native Hawaiian and Other
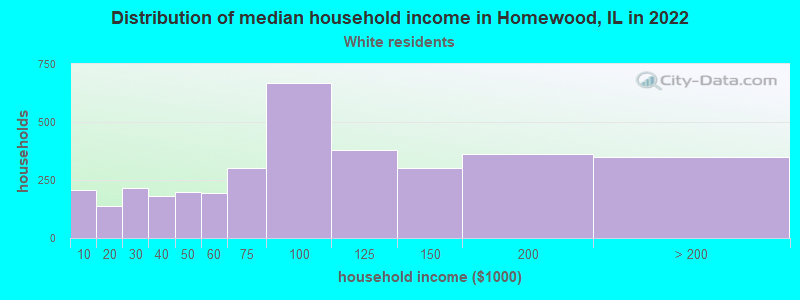
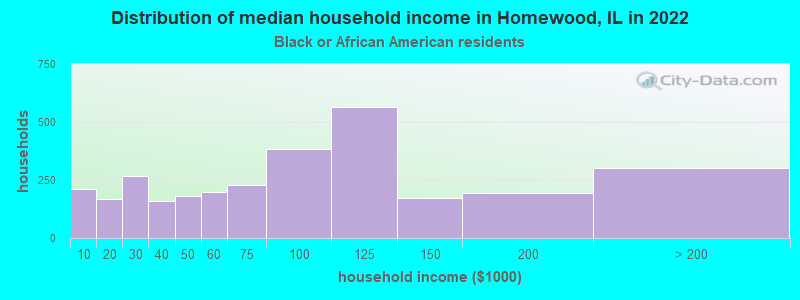
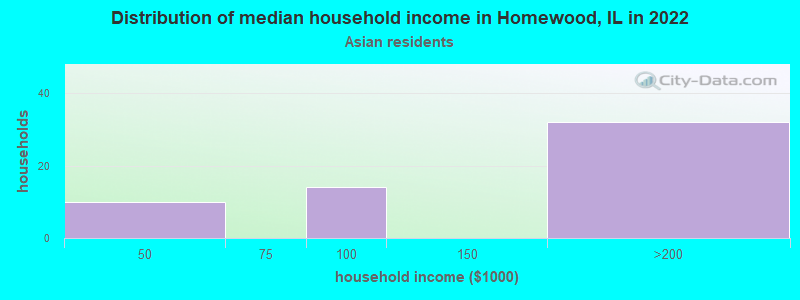
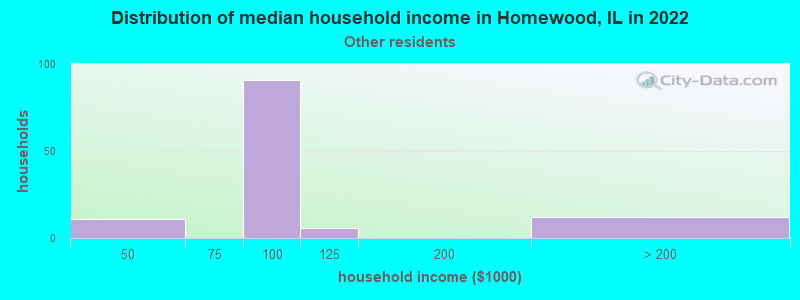
Income and house value in Homewood Median household income in 2022 $86,309 White non-Hispanic householders$78,917 Black householders$147,988 Asian householders$90,690 Some other race householders$68,335 Two or more races householders$93,719 Hispanic or Latino race householdersMedian 2022 house value $200,500 White Non-Hispanic householders$242,221 Black or African American householders$281,391 American Indian or Alaska Native householders $236,368 Asian householders$183,242 Some other race householders$181,291 Two or more races householders$200,350 Hispanic or Latino householders
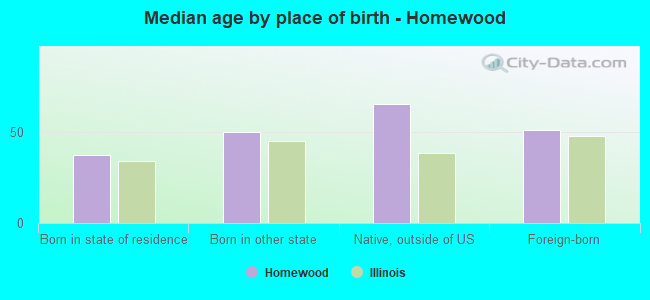
Median age by race in Homewood
52.5 Median age for White residents50.7 55.6 32.1 Median age for Black or African American residents31.8 37.1 -680,473,372.1 Median age for American Indian / Alaska Native residents-736,736,736.0 -641,399,416.3 50.4 Median age for Asian residents51.2 46.2 -687,999,999.3 Median age for Native Hawaiian / Pacific Islander residents-918,721,460.3 -610,229,276.3 31.8 Median age for Other race residents36.4 31.7 19.4 Median age for Two or more races residents16.1 30.3 53.1 Median age for White alone residents50.7 55.1 25.9 Median age for Hispanic or Latino residents22.9 33.8
Owner/renter occupied households by race in Homewood
House owners and renters - White residents 2,980 85.1% Owner occupied523 14.9% Renter occupiedHouse owners and renters - Black or African American residents 2,054 67.0% Owner occupied1,012 33.0% Renter occupiedHouse owners and renters - Asian residents 57 100.0% Owner occupiedHouse owners and renters - Other race residents 112 94.2% Owner occupied7 5.8% Renter occupiedHouse owners and renters - Two or more races residents 262 100.0% Owner occupiedHouse owners and renters - White alone residents 3,065 84.5% Owner occupied563 15.5% Renter occupiedHouse owners and renters - Hispanic or Latino residents 258 93.0% Owner occupied19 7.0% Renter occupied
Language usage in Homewood
English speakers - Total 91.7% of residents of Homewood speak English at home.
4.3% of residents speak Spanish at home 512 65.1% Speak English very well275 34.9% Speak English less than very well3.3% of residents speak other language at home 503 83.7% Speak English very well98 16.3% Speak English less than very well
English speakers - Born in the United States 98.7% of residents of Homewood speak English at home.
0.8% of residents speak Spanish at home 21 100.0% Speak English very well
English speakers - Native, born elsewhere 80.6% of residents of Homewood speak English at home.
20.8% of residents speak Spanish at home 20 66.7% Speak English very well10 33.3% Speak English less than very well
English speakers - Foreign-born 23.8% of residents of Homewood speak English at home.
27.1% of residents speak Spanish at home 52 24.3% Speak English very well162 75.7% Speak English less than very well47.8% of residents speak other language at home 303 80.2% Speak English very well75 19.8% Speak English less than very well
White (Caucasian) - Speak only English Native:
100.0% (6,687)Foreign-born:
32.6% (88)
White (Caucasian) - Speak another language Native:
2.0% (132)Foreign-born:
68.8% (186)
Black or African American - Speak only English Native:
97.9% (8,634)Foreign-born:
31.3% (41)
Black or African American - Speak another language Native:
2.1% (188)Foreign-born:
67.3% (88)
Asian - Speak only English Native:
100.0% (56)Foreign-born:
18.6% (27)
Other race - Speak only English Native:
49.6% (207)Foreign-born:
8.2% (11)
Other race - Speak another language Native:
52.5% (220)Foreign-born:
91.3% (127)
Two or more races - Speak only English Native:
71.7% (827)Foreign-born:
48.4% (22)
Two or more races - Speak another language Native:
26.5% (306)Foreign-born:
51.6% (23)
White alone - Speak only English Native:
97.9% (6,734)Foreign-born:
32.6% (92)
White alone - Speak another language Native:
1.4% (99)Foreign-born:
65.4% (185)
Hispanic or Latino - Speak only English Native:
57.9% (559)Foreign-born:
7.8% (15)
Hispanic or Latino - Speak another language Native:
43.7% (422)Foreign-born:
91.8% (181)
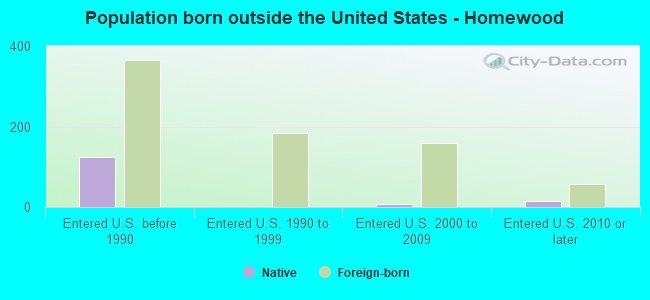
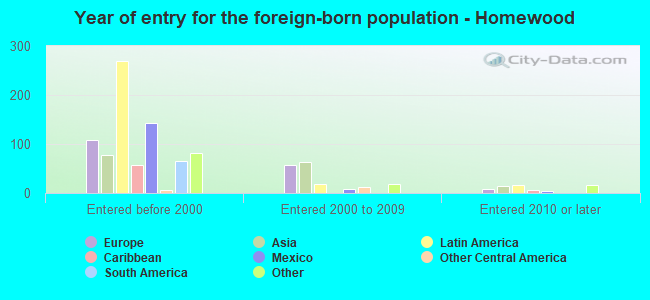
Foreign-born residents in Homewood 790 residents are foreign born (1.5% Latin America , 0.9% Europe , 0.8% Asia , 0.5% Africa ).
This city:
4.1%Illinois:
14.1%
Marital status for residents in Homewood Marital status - White (Caucasian) population 15 years and over
Males 31.9% Never married58.6% Now married1.1% Separated1.5% Widowed6.8% DivorcedFemales 24.5% Never married51.7% Now married1.2% Separated11.0% Widowed11.6% DivorcedWomen who gave birth in the past 12 months Now married:
100.0% (36)Unmarried:
0.0% (0)
Women who did not give birth in the past 12 months Now married:
53.5% (643)Unmarried:
46.5% (559)
Marital status - Black or African American population 15 years and over
Males 43.1% Never married43.1% Now married4.8% Separated3.2% Widowed5.8% DivorcedFemales 43.2% Never married32.5% Now married3.6% Separated10.3% Widowed10.4% DivorcedWomen who gave birth in the past 12 months Now married:
100.0% (167)Unmarried:
0.0% (0)
Women who did not give birth in the past 12 months Now married:
31.5% (779)Unmarried:
68.5% (1,698)
Marital status - Asian population 15 years and over
Males 48.9% Never married51.1% Now married0.0% Separated0.0% Widowed0.0% DivorcedFemales 32.2% Never married55.0% Now married7.4% Separated5.4% Widowed0.0% DivorcedWomen who gave birth in the past 12 months Now married:
100.0% (11)Unmarried:
0.0% (0)
Women who did not give birth in the past 12 months Now married:
51.5% (52)Unmarried:
48.5% (48)
Marital status - Other race population 15 years and over
Males 27.0% Never married51.1% Now married10.2% Separated11.7% Widowed0.0% DivorcedFemales 32.1% Never married67.0% Now married0.0% Separated0.0% Widowed0.9% DivorcedWomen who gave birth in the past 12 months Now married:
100.0% (10)Unmarried:
0.0% (0)
Women who did not give birth in the past 12 months Now married:
49.3% (77)Unmarried:
50.7% (79)
Marital status - Two or more races population 15 years and over
Males 59.0% Never married29.9% Now married0.0% Separated1.1% Widowed10.1% DivorcedFemales 50.3% Never married35.0% Now married0.0% Separated0.0% Widowed14.7% DivorcedWomen who gave birth in the past 12 months Now married:
100.0% (14)Unmarried:
0.0% (0)
Women who did not give birth in the past 12 months Now married:
30.5% (108)Unmarried:
69.5% (247)
Marital status - White alone, not Hispanic / Latino population 15 years and over
Males 30.4% Never married59.7% Now married1.2% Separated1.6% Widowed7.1% DivorcedFemales 23.2% Never married52.1% Now married1.1% Separated11.4% Widowed12.2% DivorcedWomen who gave birth in the past 12 months Now married:
100.0% (41)Unmarried:
0.0% (0)
Women who did not give birth in the past 12 months Now married:
53.4% (649)Unmarried:
46.6% (566)
Marital status - Hispanic or Latino population 15 years and over
Males 42.7% Never married40.5% Now married3.8% Separated5.2% Widowed7.7% DivorcedFemales 40.2% Never married53.0% Now married1.7% Separated1.3% Widowed3.8% DivorcedWomen who gave birth in the past 12 months Now married:
100.0% (19)Unmarried:
0.0% (0)
Women who did not give birth in the past 12 months Now married:
47.1% (165)Unmarried:
52.9% (185)
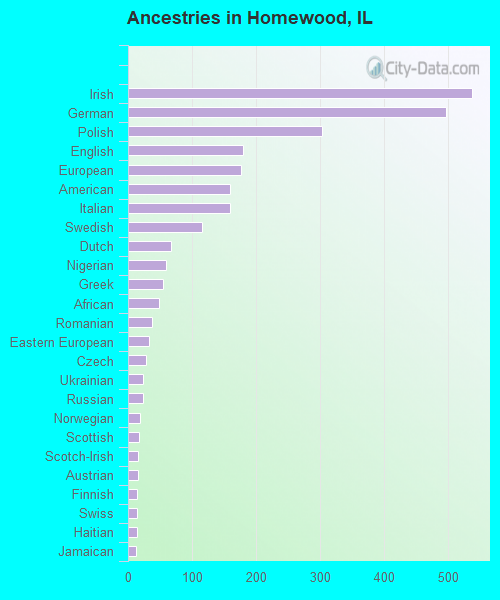
Ancestries in Homewood
537 5.1% Irish497 4.7% German303 2.9% Polish180 1.7% English176 1.7% European160 1.5% American160 1.5% Italian116 1.1% Swedish67 0.6% Dutch59 0.6% Nigerian54 0.5% Greek49 0.5% African37 0.4% Romanian33 0.3% Eastern European28 0.3% Czech23 0.2% Ukrainian23 0.2% Russian18 0.2% Norwegian17 0.2% Scottish16 0.2% Scotch-Irish15 0.1% Austrian14 0.1% Finnish14 0.1% Swiss14 0.1% Haitian13 0.1% Jamaican13 0.1% West Indian12 0.1% Ethiopian12 0.1% Danish11 0.1% Czechoslovakian11 0.1% Croatian9 0.09% Belgian9 0.09% Slovene8 0.08% Lithuanian8 0.08% Ghanaian7 0.07% French Canadian6 0.06% Welsh5 0.05% Slovak4 0.04% Hungarian
Children Nativity (place of birth) in Homewood
Children under 6 years - Living with two parents Both parents native 744 100.0% NativeOne native, one foreign-born parent 57 100.0% NativeChildren under 6 years - Living with one parent Native parent 385 100.0% NativeChildren 6 to 17 years - Living with two parents Both parents native 2,043 98.4% Native34 1.6% Foreign-bornBoth parents foreign-born 114 100.0% NativeOne native, one foreign-born parent 132 100.0% NativeChildren 6 to 17 years - Living with one parent Native parent 1,307 100.0% NativeForeign-born parent 55 50.1% Native55 49.9% Foreign-born
Grandparents responsible for own grandchildren in Homewood
Grandparents (30 to 59 years) White / Caucasian 19 50.9% Responsible for grandchildren19 49.1% Not responsible for grandchildrenBlack or African American 60 53.3% Responsible for grandchildren53 46.7% Not responsible for grandchildrenWhite alone, not Hispanic / Latino 26 61.6% Responsible for grandchildren16 38.4% Not responsible for grandchildrenGrandparents (60 years and over) White / Caucasian 35 100.0% Not responsible for grandchildrenBlack or African American 47 32.0% Responsible for grandchildren100 68.0% Not responsible for grandchildrenWhite alone, not Hispanic / Latino 45 100.0% Not responsible for grandchildren