Races in Hope Mills, North Carolina (NC) Detailed Stats
Data:
Races - White alone (%)
Races - White alone (% change since 2000)
Races - Black alone (%)
Races - Black alone (% change since 2000)
Races - American Indian alone (%)
Races - American Indian alone (% change since 2000)
Races - Asian alone (%)
Races - Asian alone (% change since 2000)
Races - Hispanic (%)
Races - Hispanic (% change since 2000)
Races - Native Hawaiian and Other Pacific Islander alone (%)
Races - Native Hawaiian and Other Pacific Islander alone (% change since 2000)
Races - Two or more races(%)
Races - Two or more races(% change since 2000)
Races - Other race alone (%)
Races - Other race alone (% change since 2000)
Racial diversity
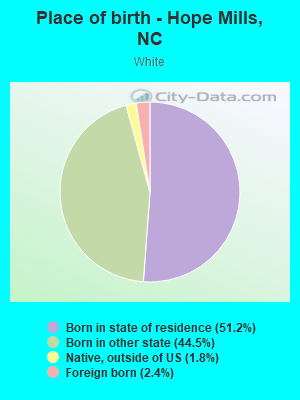
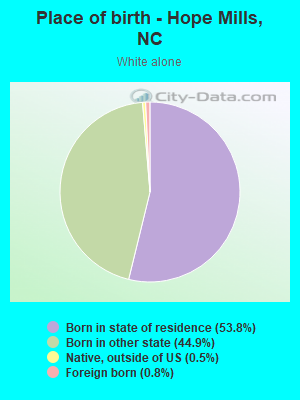
Place of birth - Born in state of residence (%)
Place of birth - Born in state of residence (%) - White
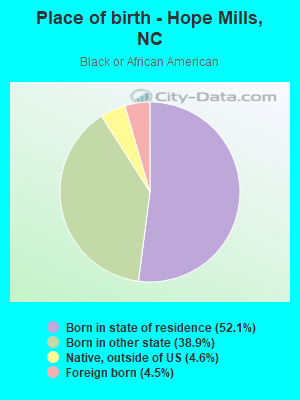
Place of birth - Born in state of residence (%) - Black or African American
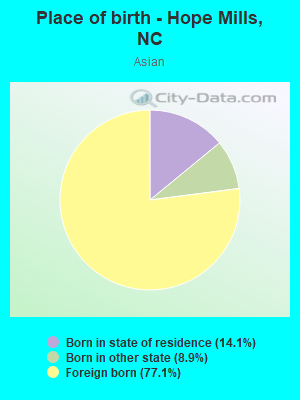
Place of birth - Born in state of residence (%) - Asian
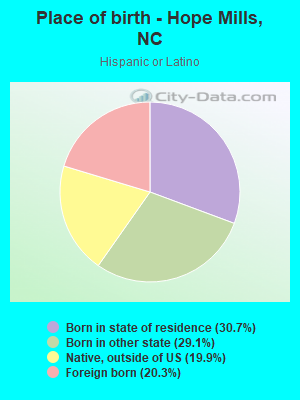
Place of birth - Born in state of residence (%) - Hispanic or Latino
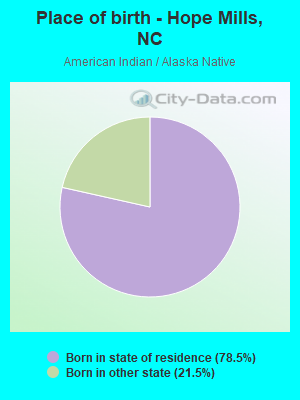
Place of birth - Born in state of residence (%) - American Indian and Alaska Native
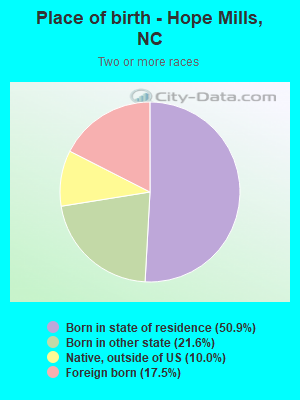
Place of birth - Born in state of residence (%) - Multirace
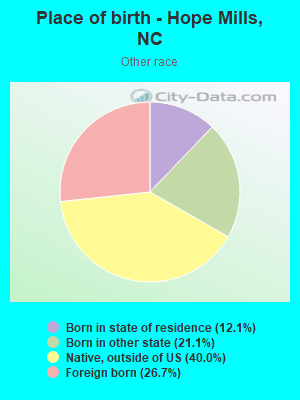
Place of birth - Born in state of residence (%) - Other Race
Place of birth - Born in other state (%)
Place of birth - Born in other state (%) - White
Place of birth - Born in other state (%) - Black or African American
Place of birth - Born in other state (%) - Asian
Place of birth - Born in other state (%) - Hispanic or Latino
Place of birth - Born in other state (%) - American Indian and Alaska Native
Place of birth - Born in other state (%) - Multirace
Place of birth - Born in other state (%) - Other Race
Place of birth - Native, outside of US (%)
Place of birth - Native, outside of US (%) - White
Place of birth - Native, outside of US (%) - Black or African American
Place of birth - Native, outside of US (%) - Asian
Place of birth - Native, outside of US (%) - Hispanic or Latino
Place of birth - Native, outside of US (%) - American Indian and Alaska Native
Place of birth - Native, outside of US (%) - Multirace
Place of birth - Native, outside of US (%) - Other Race
Place of birth - Foreign born (%)
Place of birth - Foreign born (%) - White
Place of birth - Foreign born (%) - Black or African American
Place of birth - Foreign born (%) - Asian
Place of birth - Foreign born (%) - Hispanic or Latino
Place of birth - Foreign born (%) - American Indian and Alaska Native
Place of birth - Foreign born (%) - Multirace
Place of birth - Foreign born (%) - Other Race
Residents speaking English at home (%)
Residents speaking English at home - Born in the United States (%)
Residents speaking English at home - Native, born elsewhere (%)
Residents speaking English at home - Foreign born (%)
Residents speaking Spanish at home (%)
Residents speaking Spanish at home - Born in the United States (%)
Residents speaking Spanish at home - Native, born elsewhere (%)
Residents speaking Spanish at home - Foreign born (%)
Residents speaking other language at home (%)
Residents speaking other language at home - Born in the United States (%)
Residents speaking other language at home - Native, born elsewhere (%)
Residents speaking other language at home - Foreign born (%)
Marital status - Never married (%)
Marital status - Now married (%)
Marital status - Separated (%)
Marital status - Widowed (%)
Marital status - Divorced (%)
Ancestries Reported - Arab (%)
Ancestries Reported - Czech (%)
Ancestries Reported - Danish (%)
Ancestries Reported - Dutch (%)
Ancestries Reported - English (%)
Ancestries Reported - French (%)
Ancestries Reported - French Canadian (%)
Ancestries Reported - German (%)
Ancestries Reported - Greek (%)
Ancestries Reported - Hungarian (%)
Ancestries Reported - Irish (%)
Ancestries Reported - Italian (%)
Ancestries Reported - Lithuanian (%)
Ancestries Reported - Norwegian (%)
Ancestries Reported - Polish (%)
Ancestries Reported - Portuguese (%)
Ancestries Reported - Russian (%)
Ancestries Reported - Scotch-Irish (%)
Ancestries Reported - Scottish (%)
Ancestries Reported - Slovak (%)
Ancestries Reported - Subsaharan African (%)
Ancestries Reported - Swedish (%)
Ancestries Reported - Swiss (%)
Ancestries Reported - Ukrainian (%)
Ancestries Reported - United States (%)
Ancestries Reported - Welsh (%)
Ancestries Reported - West Indian (%)
Ancestries Reported - Other (%)
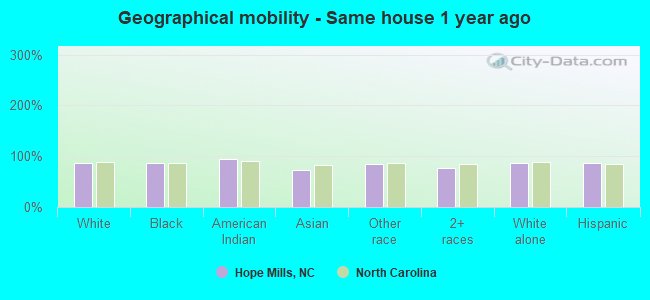
Geographical mobility - Same house 1 year ago (%)
Geographical mobility - Same house 1 year ago (%) - White
Geographical mobility - Same house 1 year ago (%) - Black or African American
Geographical mobility - Same house 1 year ago (%) - Asian
Geographical mobility - Same house 1 year ago (%) - Hispanic or Latino
Geographical mobility - Same house 1 year ago (%) - American Indian and Alaska Native
Geographical mobility - Same house 1 year ago (%) - Multirace
Geographical mobility - Same house 1 year ago (%) - Other Race
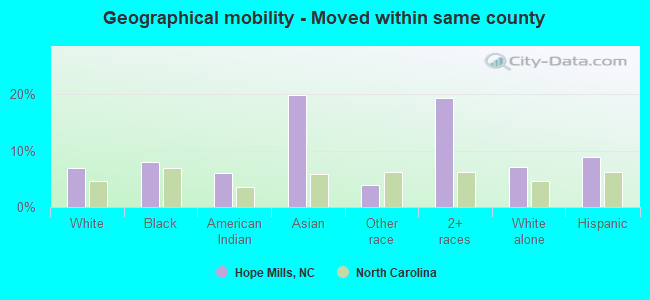
Geographical mobility - Moved within same county (%)
Geographical mobility - Moved within same county (%) - White
Geographical mobility - Moved within same county (%) - Black or African American
Geographical mobility - Moved within same county (%) - Asian
Geographical mobility - Moved within same county (%) - Hispanic or Latino
Geographical mobility - Moved within same county (%) - American Indian and Alaska Native
Geographical mobility - Moved within same county (%) - Multirace
Geographical mobility - Moved within same county (%) - Other Race
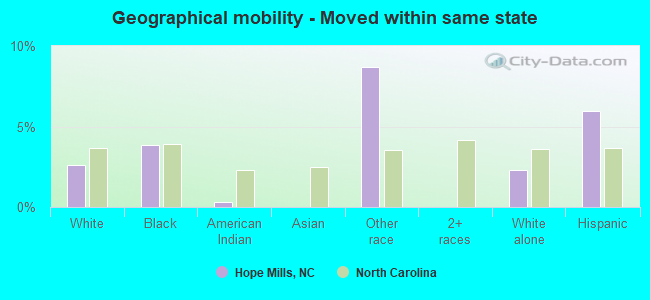
Geographical mobility - Moved from different county within same state (%)
Geographical mobility - Moved from different county within same state (%) - White
Geographical mobility - Moved from different county within same state (%) - Black or African American
Geographical mobility - Moved from different county within same state (%) - Asian
Geographical mobility - Moved from different county within same state (%) - Hispanic or Latino
Geographical mobility - Moved from different county within same state (%) - American Indian and Alaska Native
Geographical mobility - Moved from different county within same state (%) - Multirace
Geographical mobility - Moved from different county within same state (%) - Other Race
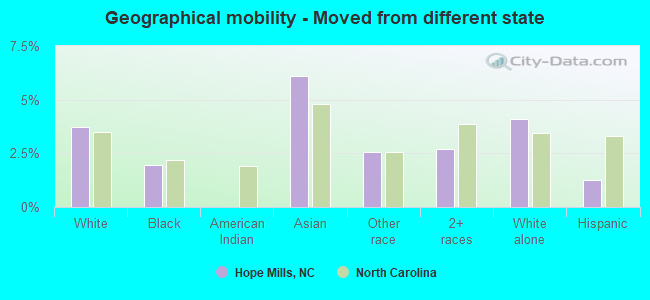
Geographical mobility - Moved from different state (%)
Geographical mobility - Moved from different state (%) - White
Geographical mobility - Moved from different state (%) - Black or African American
Geographical mobility - Moved from different state (%) - Asian
Geographical mobility - Moved from different state (%) - Hispanic or Latino
Geographical mobility - Moved from different state (%) - American Indian and Alaska Native
Geographical mobility - Moved from different state (%) - Multirace
Geographical mobility - Moved from different state (%) - Other Race
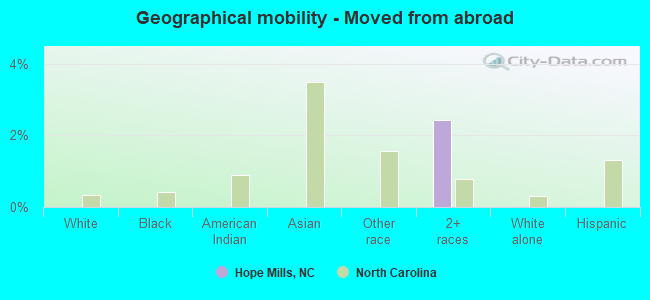
Geographical mobility - Moved from abroad (%)
Geographical mobility - Moved from abroad (%) - White
Geographical mobility - Moved from abroad (%) - Black or African American
Geographical mobility - Moved from abroad (%) - Asian
Geographical mobility - Moved from abroad (%) - Hispanic or Latino
Geographical mobility - Moved from abroad (%) - American Indian and Alaska Native
Geographical mobility - Moved from abroad (%) - Multirace
Geographical mobility - Moved from abroad (%) - Other Race
Place of birth for the foreign-born population - Ireland (%)
Place of birth for the foreign-born population - Denmark (%)
Place of birth for the foreign-born population - Norway (%)
Place of birth for the foreign-born population - Sweden (%)
Place of birth for the foreign-born population - United Kingdom (%)
Place of birth for the foreign-born population - England (%)
Place of birth for the foreign-born population - Scotland (%)
Place of birth for the foreign-born population - Other Northern Europe (%)
Place of birth for the foreign-born population - Austria (%)
Place of birth for the foreign-born population - Belgium (%)
Place of birth for the foreign-born population - France (%)
Place of birth for the foreign-born population - Germany (%)
Place of birth for the foreign-born population - Netherlands (%)
Place of birth for the foreign-born population - Switzerland (%)
Place of birth for the foreign-born population - Other Western Europe (%)
Place of birth for the foreign-born population - Greece (%)
Place of birth for the foreign-born population - Italy (%)
Place of birth for the foreign-born population - Portugal (%)
Place of birth for the foreign-born population - Spain (%)
Place of birth for the foreign-born population - Other Southern Europe (%)
Place of birth for the foreign-born population - Albania (%)
Place of birth for the foreign-born population - Belarus (%)
Place of birth for the foreign-born population - Bosnia and Herzegovina (%)
Place of birth for the foreign-born population - Bulgaria (%)
Place of birth for the foreign-born population - Croatia (%)
Place of birth for the foreign-born population - Czechoslovakia (%)
Place of birth for the foreign-born population - Hungary (%)
Place of birth for the foreign-born population - Latvia (%)
Place of birth for the foreign-born population - Lithuania (%)
Place of birth for the foreign-born population - North Macedonia (Macedonia) (%)
Place of birth for the foreign-born population - Moldova (%)
Place of birth for the foreign-born population - Poland (%)
Place of birth for the foreign-born population - Romania (%)
Place of birth for the foreign-born population - Russia (%)
Place of birth for the foreign-born population - Serbia (%)
Place of birth for the foreign-born population - Ukraine (%)
Place of birth for the foreign-born population - Other Eastern Europe (%)
Place of birth for the foreign-born population - China (%)
Place of birth for the foreign-born population - Hong Kong (%)
Place of birth for the foreign-born population - Taiwan (%)
Place of birth for the foreign-born population - Japan (%)
Place of birth for the foreign-born population - Korea (%)
Place of birth for the foreign-born population - Other Eastern Asia (%)
Place of birth for the foreign-born population - Afghanistan (%)
Place of birth for the foreign-born population - Bangladesh (%)
Place of birth for the foreign-born population - India (%)
Place of birth for the foreign-born population - Iran (%)
Place of birth for the foreign-born population - Kazakhstan (%)
Place of birth for the foreign-born population - Nepal (%)
Place of birth for the foreign-born population - Pakistan (%)
Place of birth for the foreign-born population - Sri Lanka (%)
Place of birth for the foreign-born population - Uzbekistan (%)
Place of birth for the foreign-born population - Other South Central Asia (%)
Place of birth for the foreign-born population - Burma (%)
Place of birth for the foreign-born population - Cambodia (%)
Place of birth for the foreign-born population - Indonesia (%)
Place of birth for the foreign-born population - Laos (%)
Place of birth for the foreign-born population - Malaysia (%)
Place of birth for the foreign-born population - Philippines (%)
Place of birth for the foreign-born population - Singapore (%)
Place of birth for the foreign-born population - Thailand (%)
Place of birth for the foreign-born population - Vietnam (%)
Place of birth for the foreign-born population - Other South Eastern Asia (%)
Place of birth for the foreign-born population - Armenia (%)
Place of birth for the foreign-born population - Iraq (%)
Place of birth for the foreign-born population - Israel (%)
Place of birth for the foreign-born population - Jordan (%)
Place of birth for the foreign-born population - Kuwait (%)
Place of birth for the foreign-born population - Lebanon (%)
Place of birth for the foreign-born population - Saudi Arabia (%)
Place of birth for the foreign-born population - Syria (%)
Place of birth for the foreign-born population - Turkey (%)
Place of birth for the foreign-born population - Yemen (%)
Place of birth for the foreign-born population - Other Western Asia (%)
Place of birth for the foreign-born population - Eritrea (%)
Place of birth for the foreign-born population - Ethiopia (%)
Place of birth for the foreign-born population - Kenya (%)
Place of birth for the foreign-born population - Somalia (%)
Place of birth for the foreign-born population - Uganda (%)
Place of birth for the foreign-born population - Zimbabwe (%)
Place of birth for the foreign-born population - Other Eastern Africa (%)
Place of birth for the foreign-born population - Cameroon (%)
Place of birth for the foreign-born population - Congo (%)
Place of birth for the foreign-born population - Democratic Republic of Congo (Zaire) (%)
Place of birth for the foreign-born population - Other Middle Africa (%)
Place of birth for the foreign-born population - Egypt (%)
Place of birth for the foreign-born population - Morocco (%)
Place of birth for the foreign-born population - Sudan (%)
Place of birth for the foreign-born population - Other Northern Africa (%)
Place of birth for the foreign-born population - South Africa (%)
Place of birth for the foreign-born population - Other Southern Africa (%)
Place of birth for the foreign-born population - Cabo Verde (%)
Place of birth for the foreign-born population - Ghana (%)
Place of birth for the foreign-born population - Liberia (%)
Place of birth for the foreign-born population - Nigeria (%)
Place of birth for the foreign-born population - Senegal (%)
Place of birth for the foreign-born population - Sierra Leone (%)
Place of birth for the foreign-born population - Other Western Africa (%)
Place of birth for the foreign-born population - Australia (%)
Place of birth for the foreign-born population - New Zealand (%)
Place of birth for the foreign-born population - Fiji (%)
Place of birth for the foreign-born population - Micronesia (%)
Place of birth for the foreign-born population - Bahamas (%)
Place of birth for the foreign-born population - Barbados (%)
Place of birth for the foreign-born population - Cuba (%)
Place of birth for the foreign-born population - Dominica (%)
Place of birth for the foreign-born population - Dominican Republic (%)
Place of birth for the foreign-born population - Grenada (%)
Place of birth for the foreign-born population - Haiti (%)
Place of birth for the foreign-born population - Jamaica (%)
Place of birth for the foreign-born population - St. Vincent and the Grenadines (%)
Place of birth for the foreign-born population - Trinidad and Tobago (%)
Place of birth for the foreign-born population - West Indies (%)
Place of birth for the foreign-born population - Other Caribbean (%)
Place of birth for the foreign-born population - Belize (%)
Place of birth for the foreign-born population - Costa Rica (%)
Place of birth for the foreign-born population - El Salvador (%)
Place of birth for the foreign-born population - Guatemala (%)
Place of birth for the foreign-born population - Honduras (%)
Place of birth for the foreign-born population - Mexico (%)
Place of birth for the foreign-born population - Nicaragua (%)
Place of birth for the foreign-born population - Panama (%)
Place of birth for the foreign-born population - Other Central America (%)
Place of birth for the foreign-born population - Argentina (%)
Place of birth for the foreign-born population - Bolivia (%)
Place of birth for the foreign-born population - Brazil (%)
Place of birth for the foreign-born population - Chile (%)
Place of birth for the foreign-born population - Colombia (%)
Place of birth for the foreign-born population - Ecuador (%)
Place of birth for the foreign-born population - Guyana (%)
Place of birth for the foreign-born population - Peru (%)
Place of birth for the foreign-born population - Uruguay (%)
Place of birth for the foreign-born population - Venezuela (%)
Place of birth for the foreign-born population - Other South America (%)
Place of birth for the foreign-born population - Canada (%)
Place of birth for the foreign-born population - Other Northern America (%)
Place of birth for the foreign-born population - Other (%)
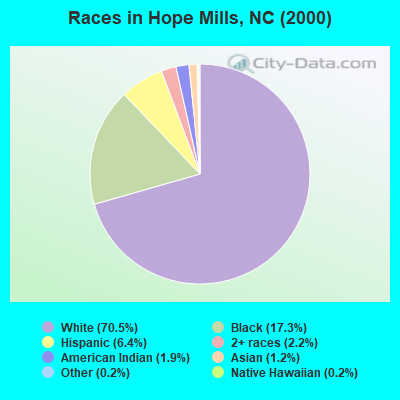
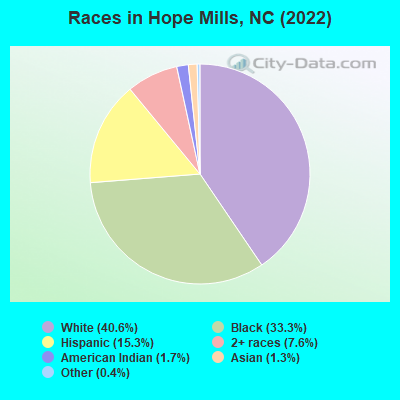
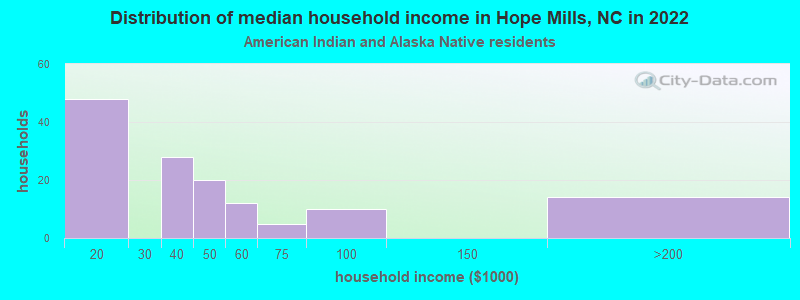
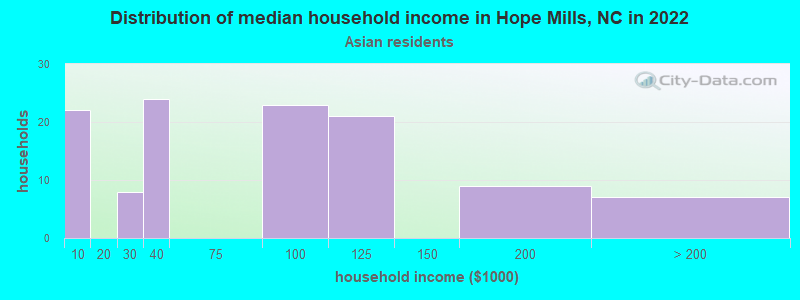
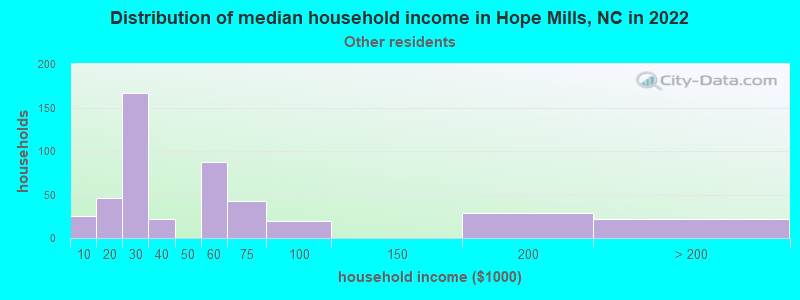
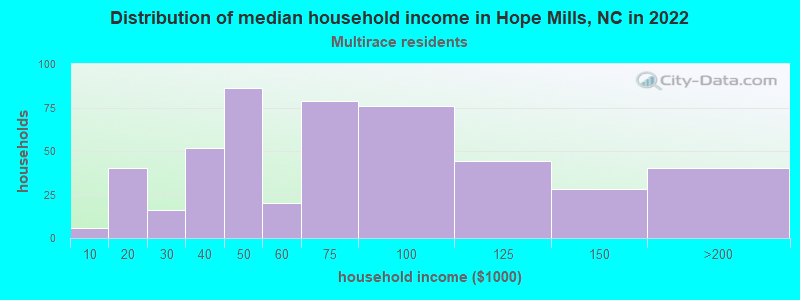
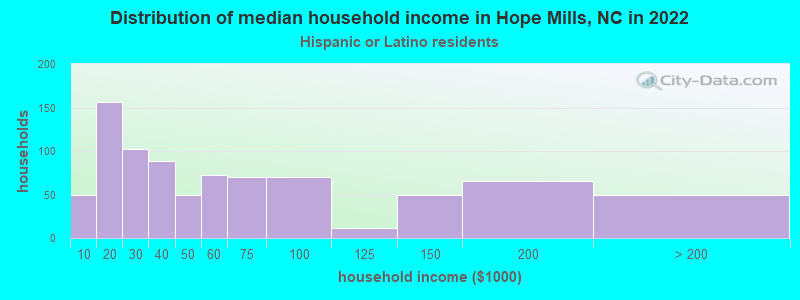
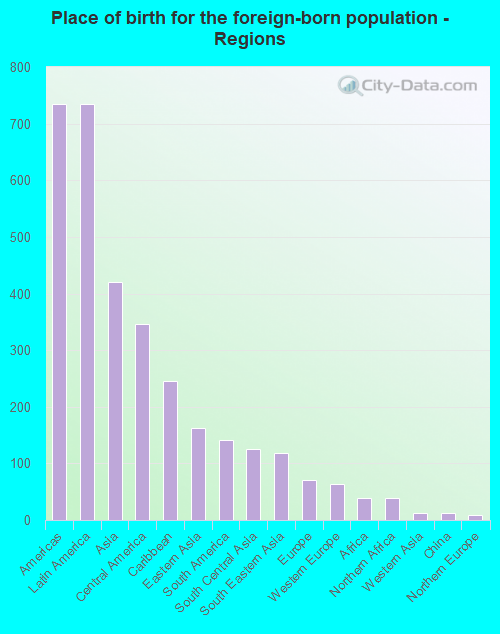
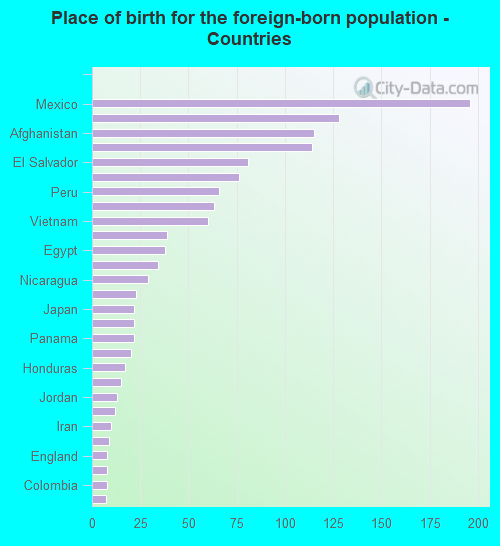
According to 2022 data, the most numerous races in Hope Mills, NC are White alone (7,201 residents), Black alone (5,914 residents), and Hispanic (2,723 residents). 88.7% of Hope Mills residents speak English at home. 7.1% of Hope Mills, NC residents are foreign-born (3.9% born in Latin America, 2.3% born in Asia), which is 12.2% less than the foreign-born rate of 8.0% across the entire state of North Carolina.
Race distribution in Hope Mills
2000 2022
5,647,155 70.2% White alone 1,723,301 21.4% Black alone 378,963 4.7% Hispanic 112,416 1.4% Asian alone 95,333 1.2% American Indian alone 79,965 1.0% Two or more races 9,015 0.1% Other race alone 3,165 0.04% Native Hawaiian and Other
6,497,519 60.7% White alone 2,155,650 20.1% Black alone 1,114,799 10.4% Hispanic 438,061 4.1% Two or more races 341,052 3.2% Asian alone 91,758 0.9% American Indian alone 50,180 0.5% Other race alone 9,954 0.09% Native Hawaiian and Other
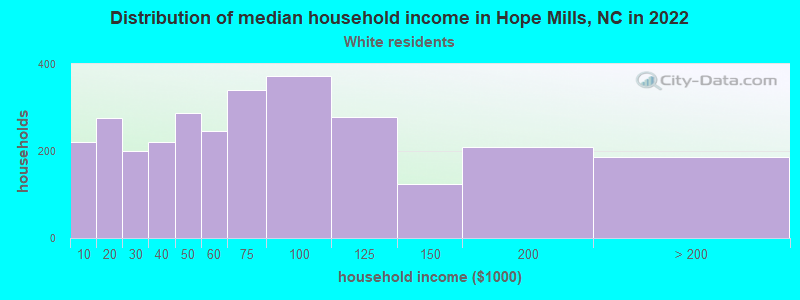
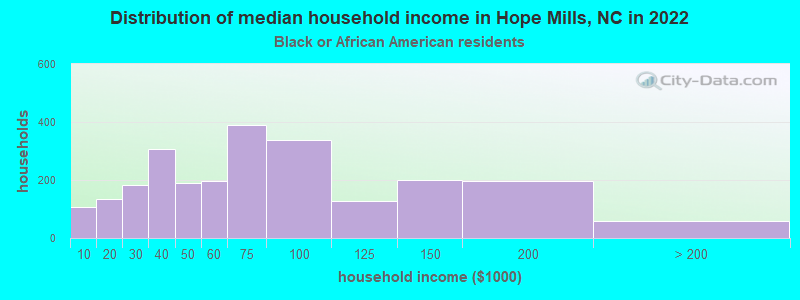
Income and house value in Hope Mills Median household income in 2022 $60,046 White non-Hispanic householders$67,393 Black householders$35,161 American Indian and Alaska Native householders$36,132 Some other race householders$60,421 Two or more races householders$49,824 Hispanic or Latino race householdersMedian 2022 house value $178,787 White Non-Hispanic householders$210,596 Black or African American householders$203,576 American Indian or Alaska Native householders $195,679 Asian householders$205,331 Some other race householders$192,607 Two or more races householders$201,821 Hispanic or Latino householders
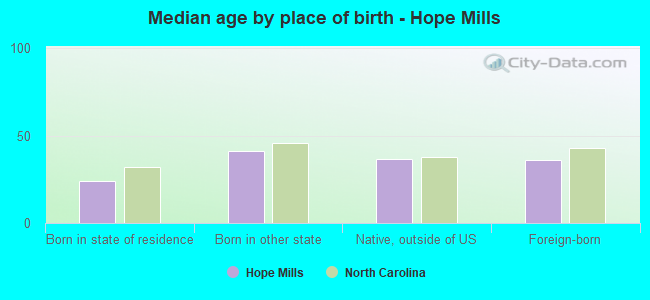
Median age by race in Hope Mills
36.0 Median age for White residents33.2 37.1 33.2 Median age for Black or African American residents32.8 33.7 36.9 Median age for American Indian / Alaska Native residents45.8 34.4 32.7 Median age for Asian residents49.4 31.6 -712,788,259.2 Median age for Native Hawaiian / Pacific Islander residents-883,780,331.2 -619,329,387.9 38.2 Median age for Other race residents38.2 31.1 15.9 Median age for Two or more races residents12.8 20.2 36.2 Median age for White alone residents32.8 39.3 26.8 Median age for Hispanic or Latino residents27.1 26.9
Owner/renter occupied households by race in Hope Mills
House owners and renters - White residents 2,232 73.3% Owner occupied811 26.7% Renter occupiedHouse owners and renters - Black or African American residents 1,395 59.8% Owner occupied940 40.2% Renter occupiedHouse owners and renters - American Indian / Alaska Native residents 72 61.4% Owner occupied45 38.6% Renter occupiedHouse owners and renters - Asian residents 106 86.0% Owner occupied17 14.0% Renter occupiedHouse owners and renters - Other race residents 235 59.2% Owner occupied162 40.8% Renter occupiedHouse owners and renters - Two or more races residents 286 48.5% Owner occupied304 51.5% Renter occupiedHouse owners and renters - White alone residents 2,150 72.7% Owner occupied807 27.3% Renter occupiedHouse owners and renters - Hispanic or Latino residents 458 55.2% Owner occupied372 44.8% Renter occupied
Language usage in Hope Mills
English speakers - Total 88.7% of residents of Hope Mills speak English at home.
7.9% of residents speak Spanish at home 835 64.8% Speak English very well454 35.2% Speak English less than very well3.4% of residents speak other language at home 329 59.2% Speak English very well227 40.8% Speak English less than very well
English speakers - Born in the United States 96.5% of residents of Hope Mills speak English at home.
3.0% of residents speak Spanish at home 137 70.3% Speak English very well58 29.7% Speak English less than very well0.9% of residents speak other language at home 38 63.3% Speak English very well22 36.7% Speak English less than very well
English speakers - Native, born elsewhere 42.8% of residents of Hope Mills speak English at home.
51.0% of residents speak Spanish at home 282 63.5% Speak English very well162 36.5% Speak English less than very well
English speakers - Foreign-born 31.4% of residents of Hope Mills speak English at home.
34.9% of residents speak Spanish at home 235 52.8% Speak English very well210 47.2% Speak English less than very well31.6% of residents speak other language at home 216 53.6% Speak English very well187 46.4% Speak English less than very well
White (Caucasian) - Speak only English Native:
98.1% (6,973)Foreign-born:
18.1% (34)
White (Caucasian) - Speak another language Native:
2.5% (181)Foreign-born:
81.4% (151)
Black or African American - Speak only English Native:
99.6% (5,392)Foreign-born:
75.3% (211)
Black or African American - Speak another language Native:
0.5% (28)Foreign-born:
19.6% (55)
Asian - Speak only English Native:
94.8% (30)Foreign-born:
29.0% (52)
Asian - Speak another language Native:
10.2% (3)Foreign-born:
64.6% (116)
Other race - Speak only English Native:
34.6% (169)Foreign-born:
21.6% (42)
Other race - Speak another language Native:
67.5% (330)Foreign-born:
77.7% (150)
Two or more races - Speak only English Native:
69.9% (1,243)Foreign-born:
24.9% (120)
Two or more races - Speak another language Native:
30.7% (546)Foreign-born:
76.3% (370)
White alone - Speak only English Native:
99.1% (6,704)Foreign-born:
26.5% (14)
White alone - Speak another language Native:
1.0% (65)Foreign-born:
75.8% (41)
Hispanic or Latino - Speak only English Native:
56.4% (1,049)Foreign-born:
15.3% (86)
Hispanic or Latino - Speak another language Native:
43.9% (816)Foreign-born:
81.6% (455)
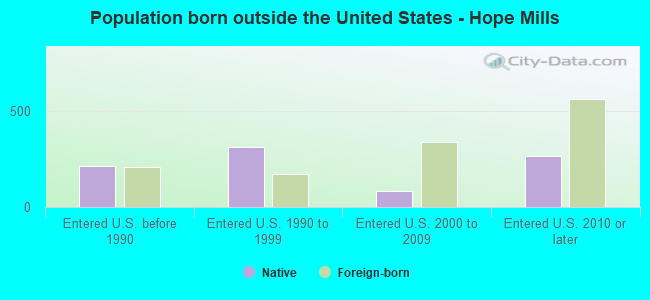
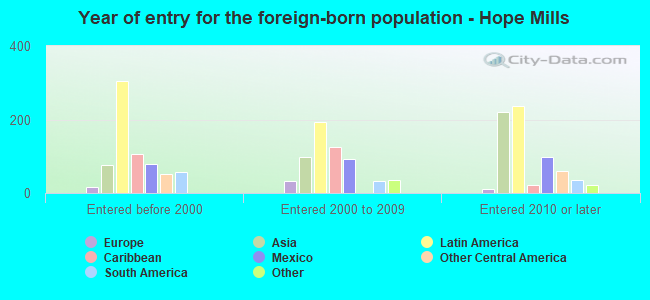
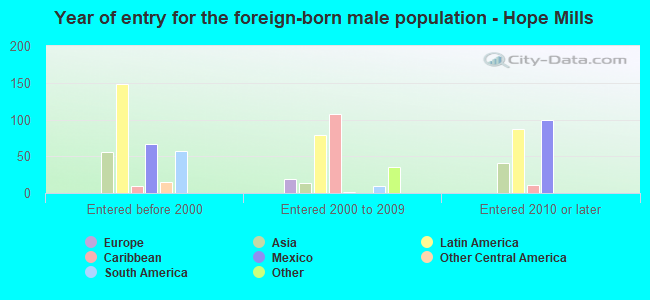
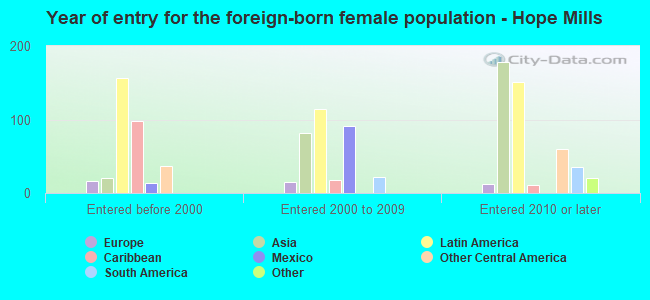
Foreign-born residents in Hope Mills 1,266 residents are foreign born (3.9% Latin America , 2.3% Asia ).
This city:
7.1%North Carolina:
8.3%
Marital status for residents in Hope Mills Marital status - White (Caucasian) population 15 years and over
Males 36.8% Never married51.8% Now married0.9% Separated1.0% Widowed9.5% DivorcedFemales 21.2% Never married46.6% Now married2.1% Separated9.0% Widowed21.2% DivorcedWomen who gave birth in the past 12 months Now married:
100.0% (68)Unmarried:
0.0% (0)
Women who did not give birth in the past 12 months Now married:
48.2% (899)Unmarried:
51.8% (964)
Marital status - Black or African American population 15 years and over
Males 36.3% Never married47.5% Now married6.2% Separated2.8% Widowed7.1% DivorcedFemales 39.2% Never married34.6% Now married5.0% Separated7.7% Widowed13.6% DivorcedWomen who gave birth in the past 12 months Now married:
69.5% (58)Unmarried:
30.5% (25)
Women who did not give birth in the past 12 months Now married:
36.9% (631)Unmarried:
63.1% (1,079)
Marital status - American Indian / Alaska Native population 15 years and over
Males 16.2% Never married66.9% Now married0.0% Separated0.0% Widowed16.9% DivorcedFemales 40.4% Never married17.4% Now married0.0% Separated3.7% Widowed38.5% DivorcedWomen who did not give birth in the past 12 months Now married:
12.7% (8)Unmarried:
87.3% (58)
Marital status - Asian population 15 years and over
Males 0.0% Never married100.0% Now married0.0% Separated0.0% Widowed0.0% DivorcedFemales 14.2% Never married61.9% Now married0.0% Separated7.1% Widowed16.8% DivorcedWomen who did not give birth in the past 12 months Now married:
70.6% (90)Unmarried:
29.4% (37)
Marital status - Other race population 15 years and over
Males 46.4% Never married45.8% Now married7.8% Separated0.0% Widowed0.0% DivorcedFemales 30.4% Never married51.8% Now married5.4% Separated10.7% Widowed1.8% DivorcedWomen who gave birth in the past 12 months Now married:
100.0% (12)Unmarried:
0.0% (0)
Women who did not give birth in the past 12 months Now married:
50.7% (84)Unmarried:
49.3% (82)
Marital status - Two or more races population 15 years and over
Males 57.3% Never married41.6% Now married1.1% Separated0.0% Widowed0.0% DivorcedFemales 41.6% Never married28.5% Now married10.0% Separated3.5% Widowed16.5% DivorcedWomen who gave birth in the past 12 months Now married:
100.0% (28)Unmarried:
0.0% (0)
Women who did not give birth in the past 12 months Now married:
39.5% (207)Unmarried:
60.5% (316)
Marital status - White alone, not Hispanic / Latino population 15 years and over
Males 36.0% Never married51.6% Now married1.0% Separated1.1% Widowed10.3% DivorcedFemales 19.0% Never married45.8% Now married2.4% Separated10.3% Widowed22.5% DivorcedWomen who gave birth in the past 12 months Now married:
100.0% (48)Unmarried:
0.0% (0)
Women who did not give birth in the past 12 months Now married:
48.8% (780)Unmarried:
51.2% (819)
Marital status - Hispanic or Latino population 15 years and over
Males 52.0% Never married42.2% Now married3.3% Separated2.4% Widowed0.0% DivorcedFemales 34.7% Never married45.0% Now married5.5% Separated2.3% Widowed12.5% DivorcedWomen who gave birth in the past 12 months Now married:
100.0% (26)Unmarried:
0.0% (0)
Women who did not give birth in the past 12 months Now married:
49.4% (413)Unmarried:
50.6% (423)
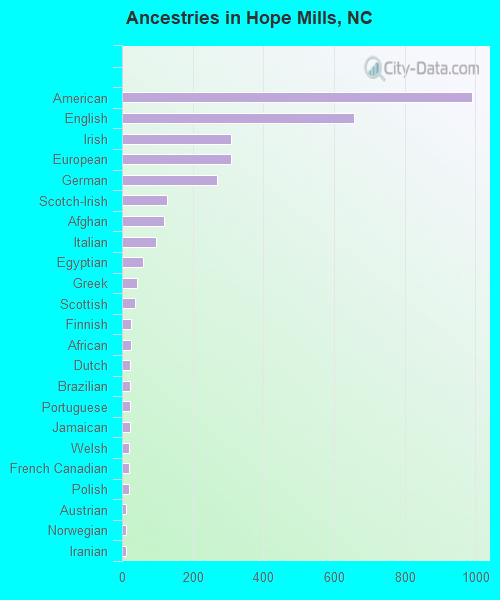
Ancestries in Hope Mills
989 10.2% American657 6.8% English309 3.2% Irish308 3.2% European269 2.8% German126 1.3% Scotch-Irish118 1.2% Afghan96 1.0% Italian60 0.6% Egyptian42 0.4% Greek37 0.4% Scottish25 0.3% Finnish25 0.3% African24 0.2% Dutch22 0.2% Brazilian22 0.2% Portuguese22 0.2% Jamaican21 0.2% Welsh19 0.2% French Canadian19 0.2% Polish12 0.1% Austrian12 0.1% Norwegian11 0.1% Iranian7 0.07% Jordanian6 0.06% French
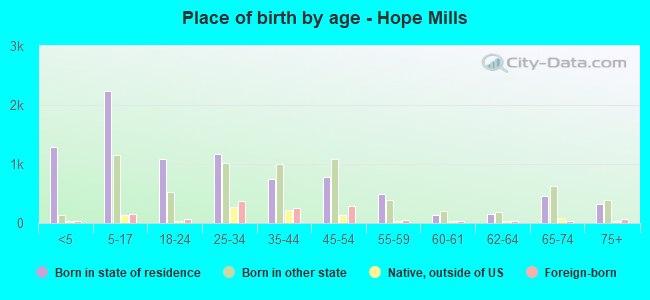
Children Nativity (place of birth) in Hope Mills
Children under 6 years - Living with two parents Both parents native 807 100.0% NativeBoth parents foreign-born 50 100.0% NativeOne native, one foreign-born parent 35 100.0% NativeChildren under 6 years - Living with one parent Native parent 509 100.0% NativeForeign-born parent 38 100.0% Foreign-bornChildren 6 to 17 years - Living with two parents Both parents native 1,558 100.0% NativeBoth parents foreign-born 30 100.0% NativeOne native, one foreign-born parent 240 100.0% NativeChildren 6 to 17 years - Living with one parent Native parent 963 93.3% Native70 6.7% Foreign-bornForeign-born parent 157 73.3% Native57 26.7% Foreign-born
Grandparents responsible for own grandchildren in Hope Mills
Grandparents (30 to 59 years) White / Caucasian 48 47.8% Responsible for grandchildren53 52.2% Not responsible for grandchildrenBlack or African American 130 56.8% Responsible for grandchildren99 43.2% Not responsible for grandchildrenAmerican Indian / Alaska Native 31 100.0% Responsible for grandchildrenAsian 23 100.0% Not responsible for grandchildrenTwo or more races 24 100.0% Not responsible for grandchildrenWhite alone, not Hispanic / Latino 50 47.4% Responsible for grandchildren56 52.6% Not responsible for grandchildrenGrandparents (60 years and over) White / Caucasian 126 62.1% Responsible for grandchildren77 37.9% Not responsible for grandchildrenBlack or African American 41 100.0% Not responsible for grandchildrenWhite alone, not Hispanic / Latino 126 77.8% Responsible for grandchildren36 22.2% Not responsible for grandchildren