Races in Horn Lake, Mississippi (MS) Detailed Stats
Data:
Races - White alone (%)
Races - White alone (% change since 2000)
Races - Black alone (%)
Races - Black alone (% change since 2000)
Races - American Indian alone (%)
Races - American Indian alone (% change since 2000)
Races - Asian alone (%)
Races - Asian alone (% change since 2000)
Races - Hispanic (%)
Races - Hispanic (% change since 2000)
Races - Native Hawaiian and Other Pacific Islander alone (%)
Races - Native Hawaiian and Other Pacific Islander alone (% change since 2000)
Races - Two or more races(%)
Races - Two or more races(% change since 2000)
Races - Other race alone (%)
Races - Other race alone (% change since 2000)
Racial diversity
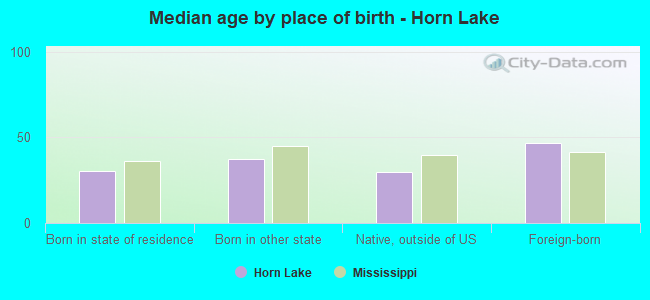
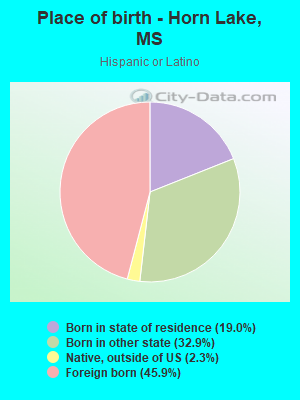
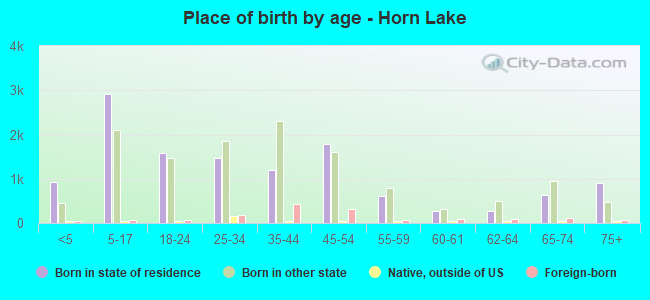
Place of birth - Born in state of residence (%)
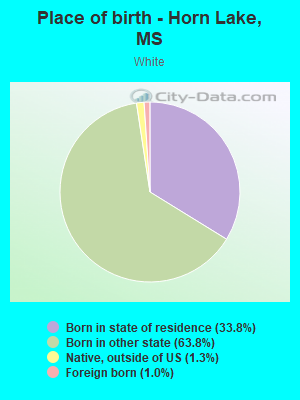
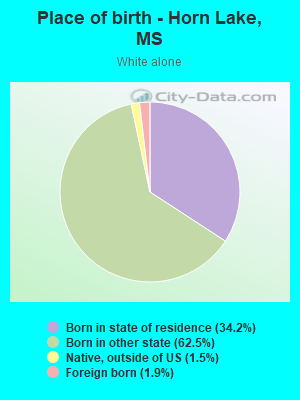
Place of birth - Born in state of residence (%) - White
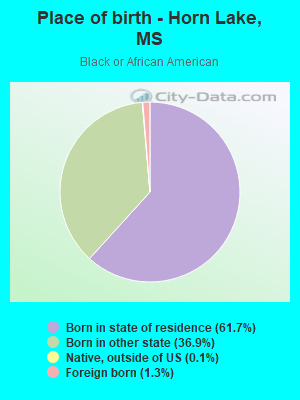
Place of birth - Born in state of residence (%) - Black or African American
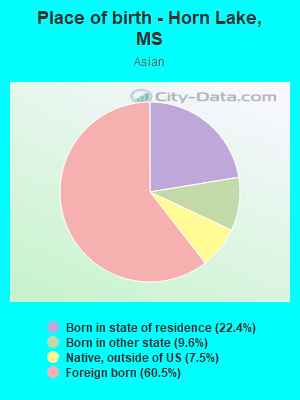
Place of birth - Born in state of residence (%) - Asian
Place of birth - Born in state of residence (%) - Hispanic or Latino
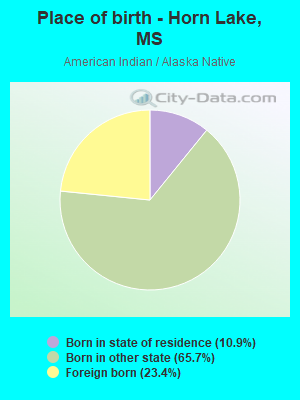
Place of birth - Born in state of residence (%) - American Indian and Alaska Native
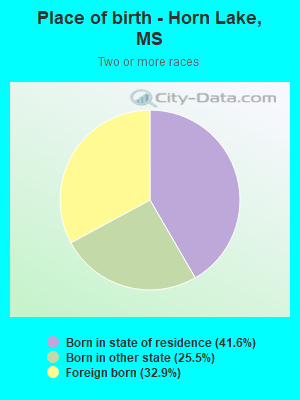
Place of birth - Born in state of residence (%) - Multirace
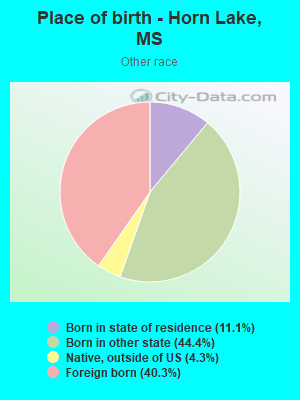
Place of birth - Born in state of residence (%) - Other Race
Place of birth - Born in other state (%)
Place of birth - Born in other state (%) - White
Place of birth - Born in other state (%) - Black or African American
Place of birth - Born in other state (%) - Asian
Place of birth - Born in other state (%) - Hispanic or Latino
Place of birth - Born in other state (%) - American Indian and Alaska Native
Place of birth - Born in other state (%) - Multirace
Place of birth - Born in other state (%) - Other Race
Place of birth - Native, outside of US (%)
Place of birth - Native, outside of US (%) - White
Place of birth - Native, outside of US (%) - Black or African American
Place of birth - Native, outside of US (%) - Asian
Place of birth - Native, outside of US (%) - Hispanic or Latino
Place of birth - Native, outside of US (%) - American Indian and Alaska Native
Place of birth - Native, outside of US (%) - Multirace
Place of birth - Native, outside of US (%) - Other Race
Place of birth - Foreign born (%)
Place of birth - Foreign born (%) - White
Place of birth - Foreign born (%) - Black or African American
Place of birth - Foreign born (%) - Asian
Place of birth - Foreign born (%) - Hispanic or Latino
Place of birth - Foreign born (%) - American Indian and Alaska Native
Place of birth - Foreign born (%) - Multirace
Place of birth - Foreign born (%) - Other Race
Residents speaking English at home (%)
Residents speaking English at home - Born in the United States (%)
Residents speaking English at home - Native, born elsewhere (%)
Residents speaking English at home - Foreign born (%)
Residents speaking Spanish at home (%)
Residents speaking Spanish at home - Born in the United States (%)
Residents speaking Spanish at home - Native, born elsewhere (%)
Residents speaking Spanish at home - Foreign born (%)
Residents speaking other language at home (%)
Residents speaking other language at home - Born in the United States (%)
Residents speaking other language at home - Native, born elsewhere (%)
Residents speaking other language at home - Foreign born (%)
Marital status - Never married (%)
Marital status - Now married (%)
Marital status - Separated (%)
Marital status - Widowed (%)
Marital status - Divorced (%)
Ancestries Reported - Arab (%)
Ancestries Reported - Czech (%)
Ancestries Reported - Danish (%)
Ancestries Reported - Dutch (%)
Ancestries Reported - English (%)
Ancestries Reported - French (%)
Ancestries Reported - French Canadian (%)
Ancestries Reported - German (%)
Ancestries Reported - Greek (%)
Ancestries Reported - Hungarian (%)
Ancestries Reported - Irish (%)
Ancestries Reported - Italian (%)
Ancestries Reported - Lithuanian (%)
Ancestries Reported - Norwegian (%)
Ancestries Reported - Polish (%)
Ancestries Reported - Portuguese (%)
Ancestries Reported - Russian (%)
Ancestries Reported - Scotch-Irish (%)
Ancestries Reported - Scottish (%)
Ancestries Reported - Slovak (%)
Ancestries Reported - Subsaharan African (%)
Ancestries Reported - Swedish (%)
Ancestries Reported - Swiss (%)
Ancestries Reported - Ukrainian (%)
Ancestries Reported - United States (%)
Ancestries Reported - Welsh (%)
Ancestries Reported - West Indian (%)
Ancestries Reported - Other (%)
Geographical mobility - Same house 1 year ago (%)
Geographical mobility - Same house 1 year ago (%) - White
Geographical mobility - Same house 1 year ago (%) - Black or African American
Geographical mobility - Same house 1 year ago (%) - Asian
Geographical mobility - Same house 1 year ago (%) - Hispanic or Latino
Geographical mobility - Same house 1 year ago (%) - American Indian and Alaska Native
Geographical mobility - Same house 1 year ago (%) - Multirace
Geographical mobility - Same house 1 year ago (%) - Other Race
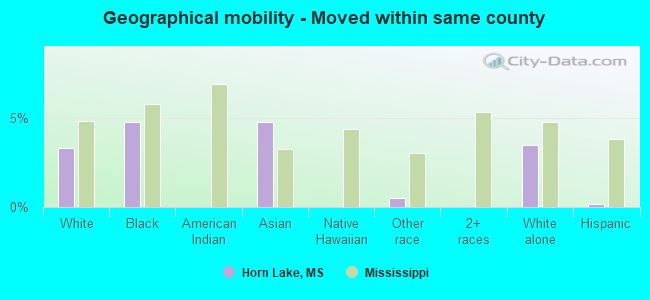
Geographical mobility - Moved within same county (%)
Geographical mobility - Moved within same county (%) - White
Geographical mobility - Moved within same county (%) - Black or African American
Geographical mobility - Moved within same county (%) - Asian
Geographical mobility - Moved within same county (%) - Hispanic or Latino
Geographical mobility - Moved within same county (%) - American Indian and Alaska Native
Geographical mobility - Moved within same county (%) - Multirace
Geographical mobility - Moved within same county (%) - Other Race
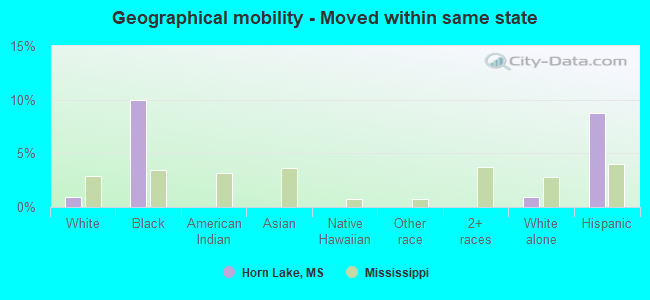
Geographical mobility - Moved from different county within same state (%)
Geographical mobility - Moved from different county within same state (%) - White
Geographical mobility - Moved from different county within same state (%) - Black or African American
Geographical mobility - Moved from different county within same state (%) - Asian
Geographical mobility - Moved from different county within same state (%) - Hispanic or Latino
Geographical mobility - Moved from different county within same state (%) - American Indian and Alaska Native
Geographical mobility - Moved from different county within same state (%) - Multirace
Geographical mobility - Moved from different county within same state (%) - Other Race
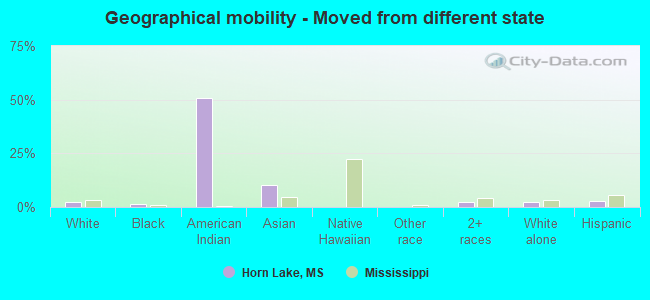
Geographical mobility - Moved from different state (%)
Geographical mobility - Moved from different state (%) - White
Geographical mobility - Moved from different state (%) - Black or African American
Geographical mobility - Moved from different state (%) - Asian
Geographical mobility - Moved from different state (%) - Hispanic or Latino
Geographical mobility - Moved from different state (%) - American Indian and Alaska Native
Geographical mobility - Moved from different state (%) - Multirace
Geographical mobility - Moved from different state (%) - Other Race
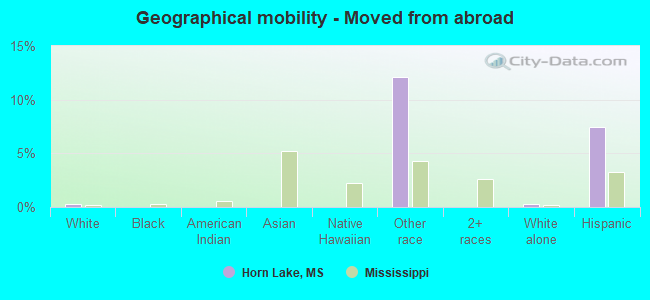
Geographical mobility - Moved from abroad (%)
Geographical mobility - Moved from abroad (%) - White
Geographical mobility - Moved from abroad (%) - Black or African American
Geographical mobility - Moved from abroad (%) - Asian
Geographical mobility - Moved from abroad (%) - Hispanic or Latino
Geographical mobility - Moved from abroad (%) - American Indian and Alaska Native
Geographical mobility - Moved from abroad (%) - Multirace
Geographical mobility - Moved from abroad (%) - Other Race
Place of birth for the foreign-born population - Ireland (%)
Place of birth for the foreign-born population - Denmark (%)
Place of birth for the foreign-born population - Norway (%)
Place of birth for the foreign-born population - Sweden (%)
Place of birth for the foreign-born population - United Kingdom (%)
Place of birth for the foreign-born population - England (%)
Place of birth for the foreign-born population - Scotland (%)
Place of birth for the foreign-born population - Other Northern Europe (%)
Place of birth for the foreign-born population - Austria (%)
Place of birth for the foreign-born population - Belgium (%)
Place of birth for the foreign-born population - France (%)
Place of birth for the foreign-born population - Germany (%)
Place of birth for the foreign-born population - Netherlands (%)
Place of birth for the foreign-born population - Switzerland (%)
Place of birth for the foreign-born population - Other Western Europe (%)
Place of birth for the foreign-born population - Greece (%)
Place of birth for the foreign-born population - Italy (%)
Place of birth for the foreign-born population - Portugal (%)
Place of birth for the foreign-born population - Spain (%)
Place of birth for the foreign-born population - Other Southern Europe (%)
Place of birth for the foreign-born population - Albania (%)
Place of birth for the foreign-born population - Belarus (%)
Place of birth for the foreign-born population - Bosnia and Herzegovina (%)
Place of birth for the foreign-born population - Bulgaria (%)
Place of birth for the foreign-born population - Croatia (%)
Place of birth for the foreign-born population - Czechoslovakia (%)
Place of birth for the foreign-born population - Hungary (%)
Place of birth for the foreign-born population - Latvia (%)
Place of birth for the foreign-born population - Lithuania (%)
Place of birth for the foreign-born population - North Macedonia (Macedonia) (%)
Place of birth for the foreign-born population - Moldova (%)
Place of birth for the foreign-born population - Poland (%)
Place of birth for the foreign-born population - Romania (%)
Place of birth for the foreign-born population - Russia (%)
Place of birth for the foreign-born population - Serbia (%)
Place of birth for the foreign-born population - Ukraine (%)
Place of birth for the foreign-born population - Other Eastern Europe (%)
Place of birth for the foreign-born population - China (%)
Place of birth for the foreign-born population - Hong Kong (%)
Place of birth for the foreign-born population - Taiwan (%)
Place of birth for the foreign-born population - Japan (%)
Place of birth for the foreign-born population - Korea (%)
Place of birth for the foreign-born population - Other Eastern Asia (%)
Place of birth for the foreign-born population - Afghanistan (%)
Place of birth for the foreign-born population - Bangladesh (%)
Place of birth for the foreign-born population - India (%)
Place of birth for the foreign-born population - Iran (%)
Place of birth for the foreign-born population - Kazakhstan (%)
Place of birth for the foreign-born population - Nepal (%)
Place of birth for the foreign-born population - Pakistan (%)
Place of birth for the foreign-born population - Sri Lanka (%)
Place of birth for the foreign-born population - Uzbekistan (%)
Place of birth for the foreign-born population - Other South Central Asia (%)
Place of birth for the foreign-born population - Burma (%)
Place of birth for the foreign-born population - Cambodia (%)
Place of birth for the foreign-born population - Indonesia (%)
Place of birth for the foreign-born population - Laos (%)
Place of birth for the foreign-born population - Malaysia (%)
Place of birth for the foreign-born population - Philippines (%)
Place of birth for the foreign-born population - Singapore (%)
Place of birth for the foreign-born population - Thailand (%)
Place of birth for the foreign-born population - Vietnam (%)
Place of birth for the foreign-born population - Other South Eastern Asia (%)
Place of birth for the foreign-born population - Armenia (%)
Place of birth for the foreign-born population - Iraq (%)
Place of birth for the foreign-born population - Israel (%)
Place of birth for the foreign-born population - Jordan (%)
Place of birth for the foreign-born population - Kuwait (%)
Place of birth for the foreign-born population - Lebanon (%)
Place of birth for the foreign-born population - Saudi Arabia (%)
Place of birth for the foreign-born population - Syria (%)
Place of birth for the foreign-born population - Turkey (%)
Place of birth for the foreign-born population - Yemen (%)
Place of birth for the foreign-born population - Other Western Asia (%)
Place of birth for the foreign-born population - Eritrea (%)
Place of birth for the foreign-born population - Ethiopia (%)
Place of birth for the foreign-born population - Kenya (%)
Place of birth for the foreign-born population - Somalia (%)
Place of birth for the foreign-born population - Uganda (%)
Place of birth for the foreign-born population - Zimbabwe (%)
Place of birth for the foreign-born population - Other Eastern Africa (%)
Place of birth for the foreign-born population - Cameroon (%)
Place of birth for the foreign-born population - Congo (%)
Place of birth for the foreign-born population - Democratic Republic of Congo (Zaire) (%)
Place of birth for the foreign-born population - Other Middle Africa (%)
Place of birth for the foreign-born population - Egypt (%)
Place of birth for the foreign-born population - Morocco (%)
Place of birth for the foreign-born population - Sudan (%)
Place of birth for the foreign-born population - Other Northern Africa (%)
Place of birth for the foreign-born population - South Africa (%)
Place of birth for the foreign-born population - Other Southern Africa (%)
Place of birth for the foreign-born population - Cabo Verde (%)
Place of birth for the foreign-born population - Ghana (%)
Place of birth for the foreign-born population - Liberia (%)
Place of birth for the foreign-born population - Nigeria (%)
Place of birth for the foreign-born population - Senegal (%)
Place of birth for the foreign-born population - Sierra Leone (%)
Place of birth for the foreign-born population - Other Western Africa (%)
Place of birth for the foreign-born population - Australia (%)
Place of birth for the foreign-born population - New Zealand (%)
Place of birth for the foreign-born population - Fiji (%)
Place of birth for the foreign-born population - Micronesia (%)
Place of birth for the foreign-born population - Bahamas (%)
Place of birth for the foreign-born population - Barbados (%)
Place of birth for the foreign-born population - Cuba (%)
Place of birth for the foreign-born population - Dominica (%)
Place of birth for the foreign-born population - Dominican Republic (%)
Place of birth for the foreign-born population - Grenada (%)
Place of birth for the foreign-born population - Haiti (%)
Place of birth for the foreign-born population - Jamaica (%)
Place of birth for the foreign-born population - St. Vincent and the Grenadines (%)
Place of birth for the foreign-born population - Trinidad and Tobago (%)
Place of birth for the foreign-born population - West Indies (%)
Place of birth for the foreign-born population - Other Caribbean (%)
Place of birth for the foreign-born population - Belize (%)
Place of birth for the foreign-born population - Costa Rica (%)
Place of birth for the foreign-born population - El Salvador (%)
Place of birth for the foreign-born population - Guatemala (%)
Place of birth for the foreign-born population - Honduras (%)
Place of birth for the foreign-born population - Mexico (%)
Place of birth for the foreign-born population - Nicaragua (%)
Place of birth for the foreign-born population - Panama (%)
Place of birth for the foreign-born population - Other Central America (%)
Place of birth for the foreign-born population - Argentina (%)
Place of birth for the foreign-born population - Bolivia (%)
Place of birth for the foreign-born population - Brazil (%)
Place of birth for the foreign-born population - Chile (%)
Place of birth for the foreign-born population - Colombia (%)
Place of birth for the foreign-born population - Ecuador (%)
Place of birth for the foreign-born population - Guyana (%)
Place of birth for the foreign-born population - Peru (%)
Place of birth for the foreign-born population - Uruguay (%)
Place of birth for the foreign-born population - Venezuela (%)
Place of birth for the foreign-born population - Other South America (%)
Place of birth for the foreign-born population - Canada (%)
Place of birth for the foreign-born population - Other Northern America (%)
Place of birth for the foreign-born population - Other (%)
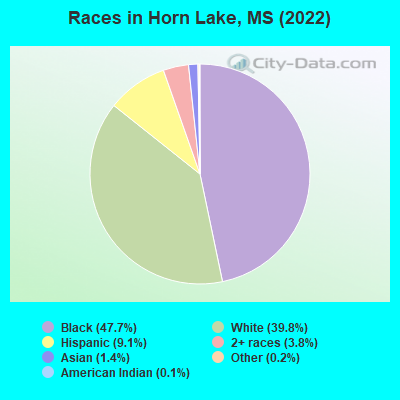
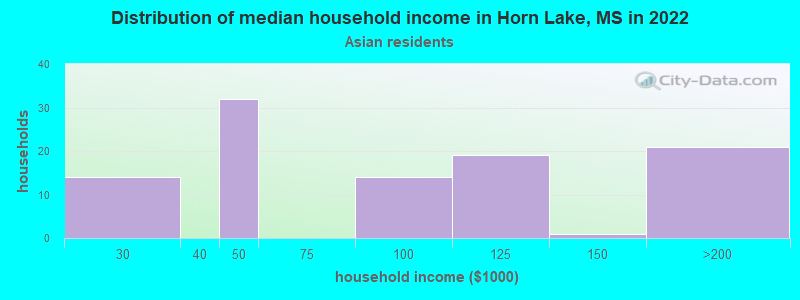
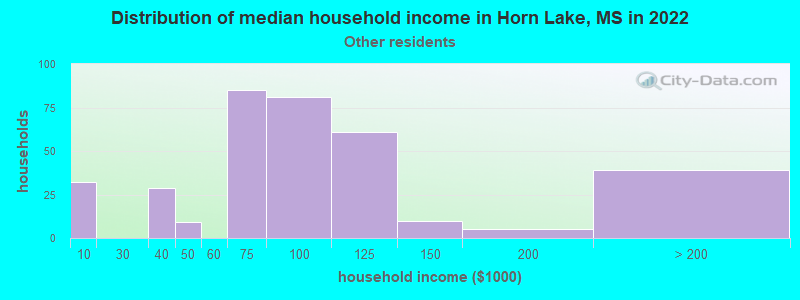
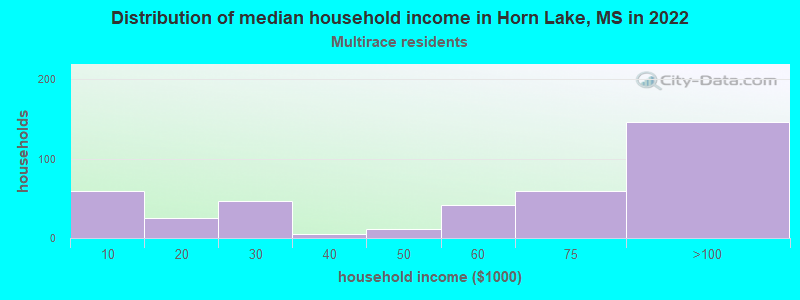
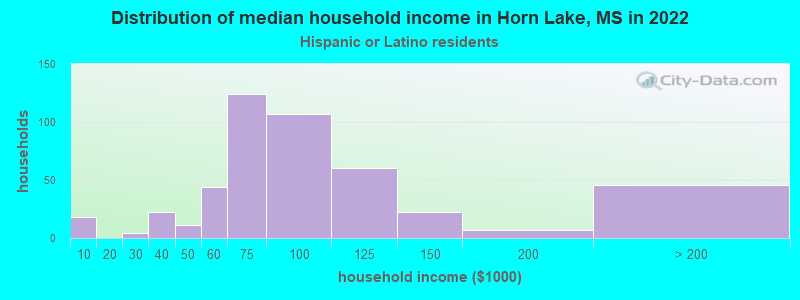
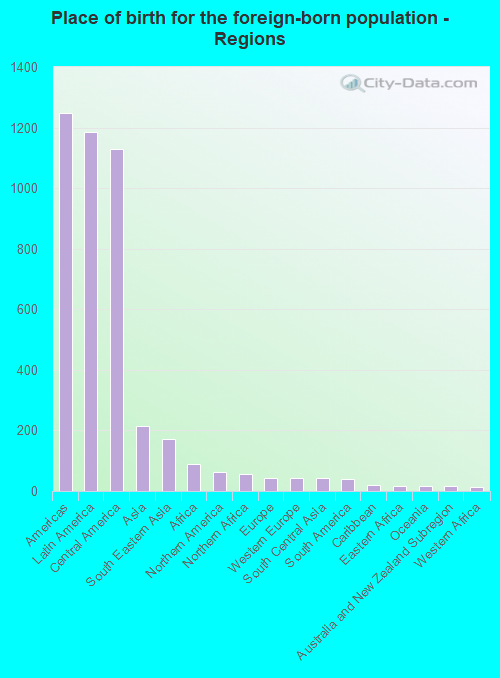
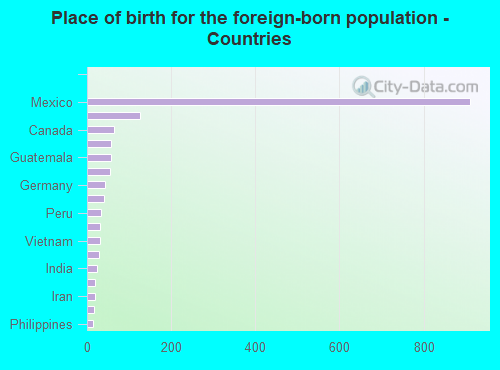
According to 2022 data, the most numerous races in Horn Lake, MS are White alone (10,910 residents), Black alone (13,096 residents), and Hispanic (2,498 residents). 90.5% of Horn Lake residents speak English at home. 5.9% of Horn Lake, MS residents are foreign-born (4.4% born in Latin America, 0.8% born in Asia), which is 66.0% greater than the foreign-born rate of 2.0% across the entire state of Mississippi.
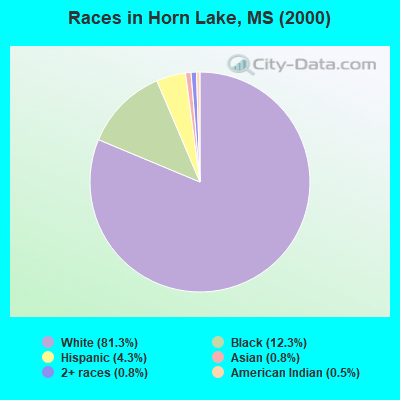
Race distribution in Horn Lake
2000 2022
1,727,908 60.7% White alone 1,028,473 36.2% Black alone 39,569 1.4% Hispanic 17,272 0.6% Two or more races 18,349 0.6% Asian alone 11,224 0.4% American Indian alone 1,294 0.05% Other race alone 569 0.02% Native Hawaiian and Other
1,625,979 55.3% White alone 1,072,962 36.5% Black alone 97,177 3.3% Hispanic 96,367 3.3% Two or more races 25,217 0.9% Asian alone 12,457 0.4% American Indian alone 9,501 0.3% Other race alone 397 0.01% Native Hawaiian and Other
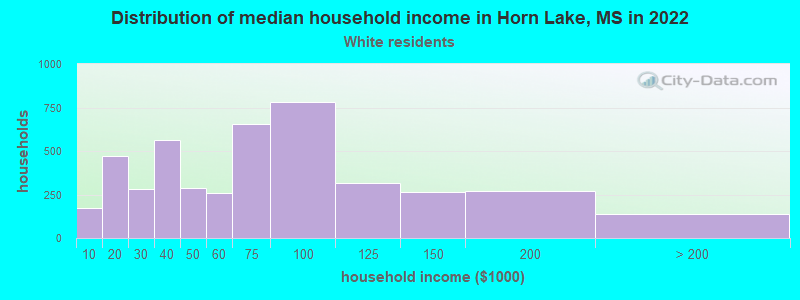
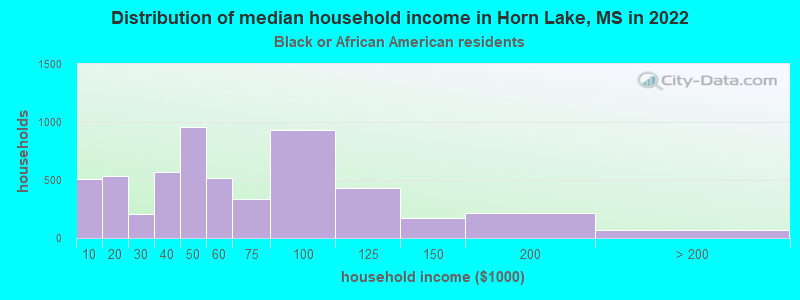
Income and house value in Horn Lake Median household income in 2022 $62,485 White non-Hispanic householders$55,406 Black householders$64,575 Asian householders$75,572 Some other race householders$54,901 Two or more races householders$63,366 Hispanic or Latino race householdersMedian 2022 house value $167,742 White Non-Hispanic householders$162,672 Black or African American householders $109,109 Asian householders$82,658 Some other race householders$173,252 Two or more races householders$181,849 Hispanic or Latino householders
Median age by race in Horn Lake
42.5 Median age for White residents39.4 46.5 32.9 Median age for Black or African American residents28.9 34.9 28.1 Median age for American Indian / Alaska Native residents35.6 38.8 62.5 Median age for Asian residents35.4 69.8 -666,666,666.0 Median age for Native Hawaiian / Pacific Islander residents-666,666,666.0 -666,666,666.0 26.2 Median age for Other race residents28.1 29.9 19.1 Median age for Two or more races residents24.6 15.9 43.4 Median age for White alone residents39.5 46.2 36.4 Median age for Hispanic or Latino residents35.3 29.2
Owner/renter occupied households by race in Horn Lake
House owners and renters - White residents 3,116 70.3% Owner occupied1,316 29.7% Renter occupiedHouse owners and renters - Black or African American residents 2,889 60.0% Owner occupied1,924 40.0% Renter occupiedHouse owners and renters - American Indian / Alaska Native residents 13 100.0% Owner occupiedHouse owners and renters - Asian residents 117 69.7% Owner occupied51 30.3% Renter occupiedHouse owners and renters - Other race residents 182 66.5% Owner occupied91 33.5% Renter occupiedHouse owners and renters - Two or more races residents 247 66.2% Owner occupied126 33.8% Renter occupiedHouse owners and renters - White alone residents 3,126 70.6% Owner occupied1,303 29.4% Renter occupiedHouse owners and renters - Hispanic or Latino residents 344 62.7% Owner occupied204 37.3% Renter occupied
Language usage in Horn Lake
English speakers - Total 90.5% of residents of Horn Lake speak English at home.
8.1% of residents speak Spanish at home 1,158 55.2% Speak English very well941 44.8% Speak English less than very well1.5% of residents speak other language at home 207 53.4% Speak English very well181 46.6% Speak English less than very well
English speakers - Born in the United States 95.6% of residents of Horn Lake speak English at home.
4.5% of residents speak Spanish at home 427 76.5% Speak English very well131 23.5% Speak English less than very well0.5% of residents speak other language at home 57 100.0% Speak English very well
English speakers - Native, born elsewhere 77.9% of residents of Horn Lake speak English at home.
37.6% of residents speak Spanish at home 78 97.5% Speak English very well2 2.5% Speak English less than very well13.6% of residents speak other language at home 29 100.0% Speak English less than very well
English speakers - Foreign-born 12.5% of residents of Horn Lake speak English at home.
68.0% of residents speak Spanish at home 363 32.4% Speak English very well756 67.6% Speak English less than very well15.1% of residents speak other language at home 114 46.0% Speak English very well134 54.0% Speak English less than very well
White (Caucasian) - Speak only English Native:
98.5% (10,420)Foreign-born:
30.3% (35)
White (Caucasian) - Speak another language Native:
1.0% (105)Foreign-born:
100.0% (116)
Black or African American - Speak only English Native:
99.0% (10,889)Foreign-born:
39.0% (71)
Black or African American - Speak another language Native:
1.1% (116)Foreign-born:
61.1% (111)
Asian - Speak only English Native:
36.7% (46)Foreign-born:
11.9% (28)
Asian - Speak another language Native:
61.4% (77)Foreign-born:
100.0% (238)
Other race - Speak only English Native:
40.8% (355)Foreign-born:
9.6% (59)
Other race - Speak another language Native:
57.3% (498)Foreign-born:
96.8% (596)
Two or more races - Speak only English Native:
79.6% (613)Foreign-born:
4.2% (24)
Two or more races - Speak another language Native:
20.9% (161)Foreign-born:
97.5% (568)
White alone - Speak only English Native:
98.5% (10,224)Foreign-born:
20.8% (42)
White alone - Speak another language Native:
1.3% (137)Foreign-born:
73.0% (147)
Hispanic or Latino - Speak only English Native:
41.9% (521)Foreign-born:
6.3% (72)
Hispanic or Latino - Speak another language Native:
57.9% (721)Foreign-born:
94.3% (1,090)
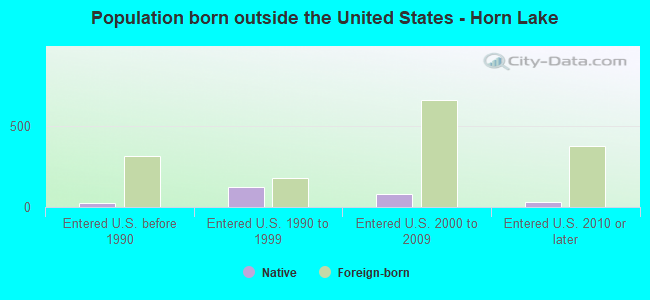
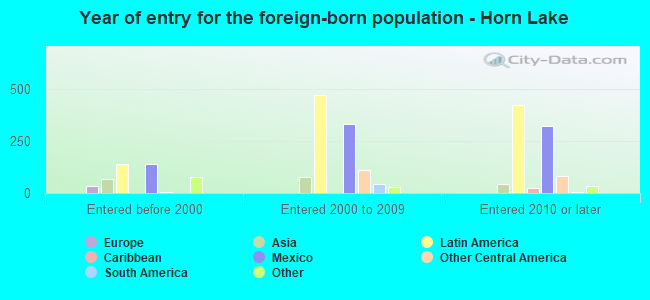
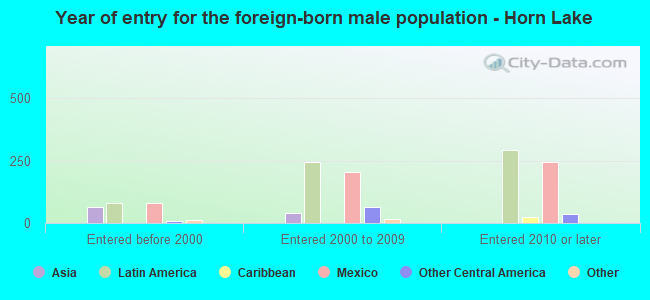
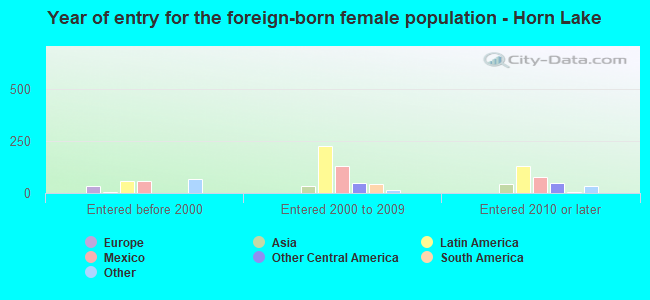
Foreign-born residents in Horn Lake 1,616 residents are foreign born (4.4% Latin America , 0.8% Asia ).
This city:
5.9%Mississippi:
2.3%
Marital status for residents in Horn Lake Marital status - White (Caucasian) population 15 years and over
Males 32.9% Never married44.9% Now married1.6% Separated4.6% Widowed15.9% DivorcedFemales 22.6% Never married45.7% Now married1.7% Separated10.6% Widowed19.4% DivorcedWomen who gave birth in the past 12 months Now married:
56.9% (39)Unmarried:
43.1% (30)
Women who did not give birth in the past 12 months Now married:
45.5% (1,007)Unmarried:
54.5% (1,208)
Marital status - Black or African American population 15 years and over
Males 53.7% Never married36.4% Now married1.8% Separated1.4% Widowed6.7% DivorcedFemales 53.1% Never married22.1% Now married5.4% Separated5.2% Widowed14.3% DivorcedWomen who gave birth in the past 12 months Now married:
17.1% (31)Unmarried:
82.9% (151)
Women who did not give birth in the past 12 months Now married:
25.9% (1,208)Unmarried:
74.1% (3,466)
Marital status - American Indian / Alaska Native population 15 years and over
Males 97.6% Never married2.4% Now married0.0% Separated0.0% Widowed0.0% DivorcedFemales 0.0% Never married100.0% Now married0.0% Separated0.0% Widowed0.0% DivorcedWomen who did not give birth in the past 12 months Now married:
100.0% (75)Unmarried:
0.0% (0)
Marital status - Asian population 15 years and over
Males 13.9% Never married67.7% Now married0.0% Separated0.0% Widowed18.4% DivorcedFemales 16.2% Never married83.1% Now married0.0% Separated0.0% Widowed0.6% DivorcedWomen who gave birth in the past 12 months Now married:
100.0% (8)Unmarried:
0.0% (0)
Women who did not give birth in the past 12 months Now married:
72.1% (26)Unmarried:
27.9% (10)
Marital status - Other race population 15 years and over
Males 48.7% Never married40.4% Now married4.3% Separated1.4% Widowed5.2% DivorcedFemales 52.8% Never married43.4% Now married1.1% Separated1.1% Widowed1.6% DivorcedWomen who gave birth in the past 12 months Now married:
91.8% (70)Unmarried:
8.2% (6)
Women who did not give birth in the past 12 months Now married:
39.7% (204)Unmarried:
60.3% (309)
Marital status - Two or more races population 15 years and over
Males 51.1% Never married43.8% Now married0.0% Separated5.1% Widowed0.0% DivorcedFemales 24.4% Never married64.2% Now married2.2% Separated5.2% Widowed4.0% DivorcedWomen who did not give birth in the past 12 months Now married:
52.2% (148)Unmarried:
47.8% (136)
Marital status - White alone, not Hispanic / Latino population 15 years and over
Males 31.8% Never married45.4% Now married1.6% Separated4.7% Widowed16.5% DivorcedFemales 22.4% Never married45.9% Now married1.7% Separated10.8% Widowed19.2% DivorcedWomen who gave birth in the past 12 months Now married:
56.9% (40)Unmarried:
43.1% (30)
Women who did not give birth in the past 12 months Now married:
46.3% (1,026)Unmarried:
53.7% (1,192)
Marital status - Hispanic or Latino population 15 years and over
Males 48.6% Never married43.4% Now married2.3% Separated0.7% Widowed5.0% DivorcedFemales 38.7% Never married57.0% Now married0.7% Separated0.0% Widowed3.6% DivorcedWomen who gave birth in the past 12 months Now married:
66.2% (51)Unmarried:
33.8% (26)
Women who did not give birth in the past 12 months Now married:
49.7% (267)Unmarried:
50.3% (271)
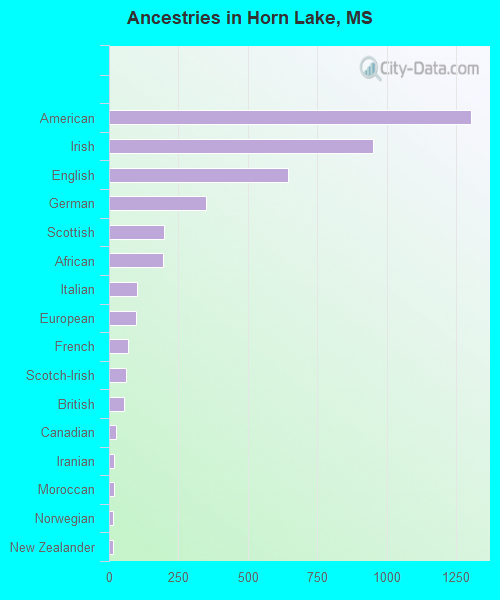
Ancestries in Horn Lake
1,304 8.1% American952 5.9% Irish644 4.0% English349 2.2% German197 1.2% Scottish196 1.2% African102 0.6% Italian96 0.6% European70 0.4% French63 0.4% Scotch-Irish55 0.3% British26 0.2% Canadian19 0.1% Iranian18 0.1% Moroccan15 0.09% Norwegian14 0.09% New Zealander9 0.06% Polish8 0.05% Swedish8 0.05% Jamaican7 0.04% Dutch7 0.04% French Canadian
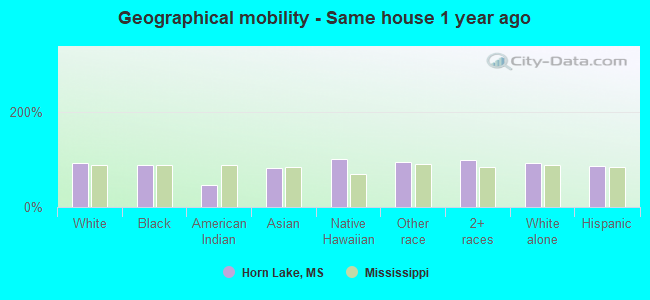
Geographical mobility in Horn Lake Same house 1 year ago 10,276 93.0% White (Caucasian)11,545 87.4% Black or African American59 46.3% American Indian / Alaska Native264 81.3% Asian12 100.0% Native Hawaiian / Pacific Islander1,515 94.6% Other race1,593 97.8% Two or more races10,133 92.9% White alone, not Hispanic / Latino1,995 86.5% Hispanic or LatinoMoved within same county 367 3.3% White / Caucasian630 4.8% Black or African American15 4.8% Asian8 0.5% Other race378 3.5% White alone, not Hispanic / Latino4 0.2% Hispanic or LatinoMoved within same state 107 1.0% White / Caucasian1,322 10.0% Black or African American102 0.9% White alone, not Hispanic / Latino201 8.7% Hispanic or LatinoMoved from different state 266 2.4% White / Caucasian189 1.4% Black or African American64 50.7% American Indian / Alaska Native33 10.1% Asian37 2.3% Two or more races234 2.1% White alone, not Hispanic / Latino69 3.0% Hispanic or LatinoMoved from abroad 31 0.3% White194 12.1% Other race31 0.3% White alone, not Hispanic / Latino172 7.5% Hispanic or Latino
Children Nativity (place of birth) in Horn Lake
Children under 6 years - Living with two parents Both parents native 347 100.0% NativeBoth parents foreign-born 71 100.0% NativeChildren under 6 years - Living with one parent Native parent 966 100.0% NativeForeign-born parent 8 18.1% Native35 81.9% Foreign-bornChildren 6 to 17 years - Living with two parents Both parents native 2,157 100.0% NativeBoth parents foreign-born 182 83.2% Native37 16.8% Foreign-bornOne native, one foreign-born parent 102 100.0% NativeChildren 6 to 17 years - Living with one parent Native parent 1,921 100.0% NativeForeign-born parent 21 61.2% Native13 38.8% Foreign-born
Grandparents responsible for own grandchildren in Horn Lake
Grandparents (30 to 59 years) White / Caucasian 87 63.0% Responsible for grandchildren51 37.0% Not responsible for grandchildrenBlack or African American 10 5.3% Responsible for grandchildren183 94.7% Not responsible for grandchildrenOther race 57 74.9% Responsible for grandchildren19 25.1% Not responsible for grandchildrenWhite alone, not Hispanic / Latino 87 63.0% Responsible for grandchildren51 37.0% Not responsible for grandchildrenHispanic or Latino 43 69.3% Responsible for grandchildren19 30.7% Not responsible for grandchildrenGrandparents (60 years and over) White / Caucasian 43 37.3% Responsible for grandchildren73 62.7% Not responsible for grandchildrenBlack or African American 38 65.9% Responsible for grandchildren20 34.1% Not responsible for grandchildrenWhite alone, not Hispanic / Latino 43 37.3% Responsible for grandchildren73 62.7% Not responsible for grandchildren