Races in Hudson, Florida (FL) Detailed Stats
Ancestries, Foreign-born residents, place of birth
Settings
X


Recent posts about races in Hudson, Florida on our local forum with over 2,400,000 registered users:
 | Sarasota & Manatee Counties news thread (4615 replies) |
| Suburban FLA (6 replies) |
| Florida is turning into an environmental catastrophe (963 replies) |
| commute from Hudson to Brooksville (13 replies) |
| Areas within 1-2 hours of CW for family w/kids? (5 replies) |
| Am I The Only One Who Doesn't Like Florida? (578 replies) |
Latest news about races in Hudson, FL collected exclusively by city-data.com from local newspapers, TV, and radio stations
According to 2022 data, the most numerous races in Hudson, FL are White alone (9,999 residents), Hispanic (573 residents), and Black alone (163 residents). 91.7% of Hudson residents speak English at home. 6.3% of Hudson, FL residents are foreign-born (2.4% born in Latin America, 1.7% born in Europe, 1.6% born in North America, 0.6% born in Asia), which is 233.4% less than the foreign-born rate of 21.0% across the entire state of Florida.
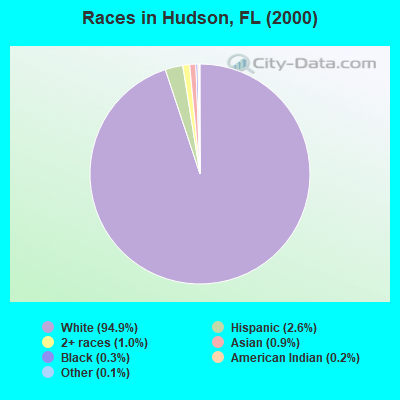
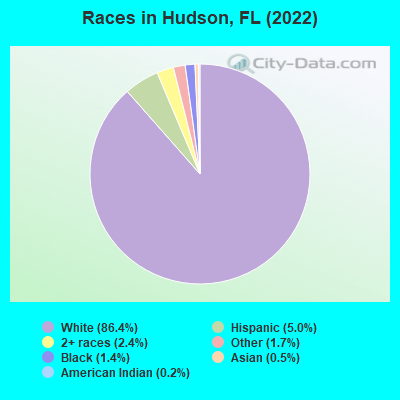
Race distribution in Hudson
2000
2022

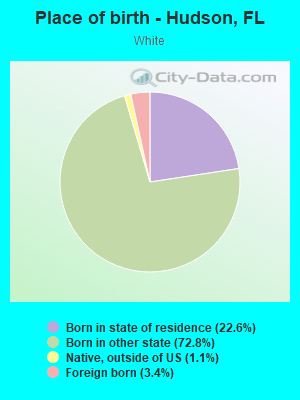
- 12,10994.9%White alone
- 3322.6%Hispanic
- 1281.0%Two or more races
- 1150.9%Asian alone
- 440.3%Black alone
- 200.2%American Indian alone
- 130.1%Other race alone
- 40.03%Native Hawaiian and Other
Pacific Islander alone
-
- 9,99986.4%White alone
- 5735.0%Hispanic
- 2762.4%Two or more races
- 1921.7%Other race alone
- 1631.4%Black alone
- 570.5%Asian alone
- 180.2%American Indian alone
- 50.04%Native Hawaiian and Other
Pacific Islander alone
2000
2022
-
- 10,458,50965.4%White alone
- 2,682,71516.8%Hispanic
- 2,264,26814.2%Black alone
- 261,6931.6%Asian alone
- 236,9541.5%Two or more races
- 42,3580.3%American Indian alone
- 28,9940.2%Other race alone
- 6,8870.04%Native Hawaiian and Other
Pacific Islander alone

-
- 11,309,40350.8%White alone
- 6,025,03927.1%Hispanic
- 3,241,01514.6%Black alone
- 861,6303.9%Two or more races
- 623,6922.8%Asian alone
- 152,0540.7%Other race alone
- 22,5040.1%American Indian alone
- 9,4860.04%Native Hawaiian and Other
Pacific Islander alone

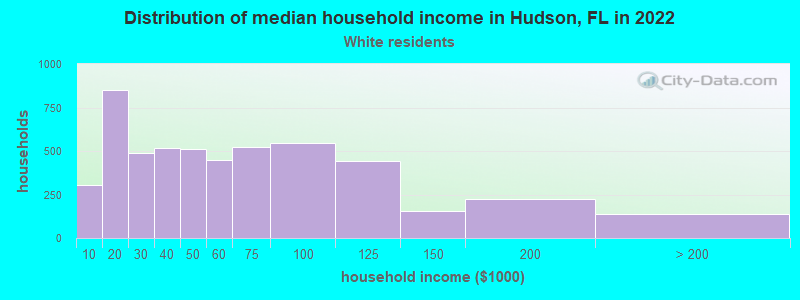
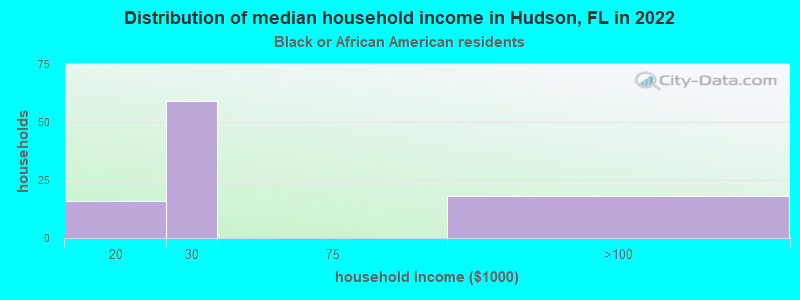
Income and house value in Hudson
- Median household income in 2022
- $48,232White non-Hispanic householders
- $31,093Hispanic or Latino race householders
- Median 2022 house value
- $311,977White Non-Hispanic householders
- $190,906American Indian or Alaska Native householders
- $484,608Asian householders
- $310,019Some other race householders
- $386,381Two or more races householders
- $327,967Hispanic or Latino householders
Household income for White non-Hispanic householders
Household income for Black householders
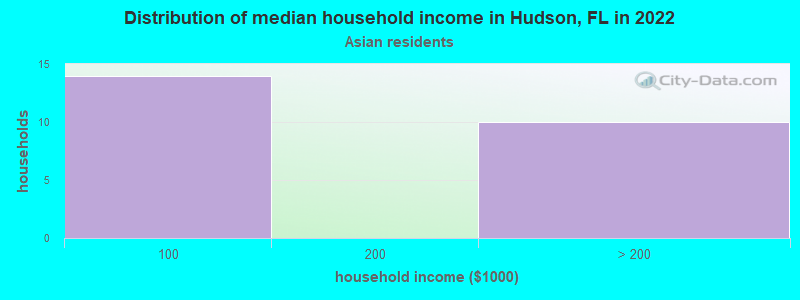
Household income for Asian householders
Household income for Two or more races householders

Household income for Hispanic or Latino race householders

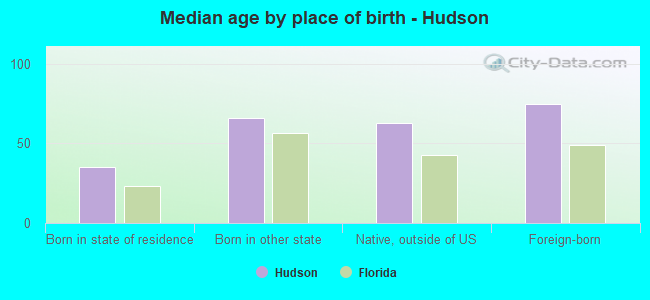
Median age by race in Hudson
- 64.1Median age for White residents
- 64.7Males
- 63.5Females
- 69.6Median age for Black or African American residents
- 62.7Males
- 74.7Females
- 40.6Median age for American Indian / Alaska Native residents
- -769,874,476.2Males
- -501,002,003.5Females
- 75.6Median age for Asian residents
- 75.9Males
- 70.1Females
- 92.1Median age for Native Hawaiian / Pacific Islander residents
- -858,307,848.3Males
- -444,051,825.2Females
- 75.5Median age for Other race residents
- 36.2Males
- 105.1Females
- 63.7Median age for Two or more races residents
- 58.1Males
- 66.5Females
- 63.2Median age for White alone residents
- 63.5Males
- 63.2Females
- 61.1Median age for Hispanic or Latino residents
- 62.1Males
- 61.8Females
Owner/renter occupied households by race in Hudson
- House owners and renters - White residents
- 3,97175.5%Owner occupied
- 1,29124.5%Renter occupied
- House owners and renters - Black or African American residents
- 2021.8%Owner occupied
- 7378.2%Renter occupied
- House owners and renters - American Indian / Alaska Native residents
- 12100.0%Owner occupied
- House owners and renters - Asian residents
- 1361.4%Owner occupied
- 838.6%Renter occupied
- House owners and renters - Native Hawaiian / Pacific Islander residents
- 4100.0%Owner occupied
- House owners and renters - Other race residents
- 8100.0%Renter occupied
- House owners and renters - Two or more races residents
- 25868.1%Owner occupied
- 12131.9%Renter occupied
- House owners and renters - White alone residents
- 4,02575.7%Owner occupied
- 1,29024.3%Renter occupied
- House owners and renters - Hispanic or Latino residents
- 12847.3%Owner occupied
- 14252.7%Renter occupied
Language usage in Hudson
- English speakers - Total
- 91.7% of residents of Hudson speak English at home.
- 3.6% of residents speak Spanish at home
- 22755.9%Speak English very well
- 17944.1%Speak English less than very well
- 3.3% of residents speak other language at home
- 23061.0%Speak English very well
- 14739.0%Speak English less than very well
- English speakers - Born in the United States
- 97.3% of residents of Hudson speak English at home.
- 1.2% of residents speak Spanish at home
- 93100.0%Speak English very well
- 1.0% of residents speak other language at home
- 78100.0%Speak English very well
- English speakers - Native, born elsewhere
- 48.7% of residents of Hudson speak English at home.
- 40.5% of residents speak Spanish at home
- 5053.2%Speak English very well
- 4446.8%Speak English less than very well
- English speakers - Foreign-born
- 37.6% of residents of Hudson speak English at home.
- 23.3% of residents speak Spanish at home
- 7136.8%Speak English very well
- 12263.2%Speak English less than very well
- 35.8% of residents speak other language at home
- 15953.5%Speak English very well
- 13846.5%Speak English less than very well
White (Caucasian) - Speak only English
| Native: | 99.8% (9,256) |
| Foreign-born: | 57.0% (190) |
White (Caucasian) - Speak another language
| Native: | 1.6% (145) |
| Foreign-born: | 43.2% (144) |
Black or African American - Speak only English
| Native: | 99.0% (117) |
| Foreign-born: | 100.0% (47) |
Asian - Speak another language
| Native: | 68.7% (7) |
| Foreign-born: | 83.2% (48) |
Native Hawaiian / Pacific Islander - Speak only English
| Native: | 87.6% (5) |
| Foreign-born: | 100.0% (2) |
Other race - Speak another language
| Native: | 15.2% (12) |
| Foreign-born: | 99.9% (160) |
Two or more races - Speak another language
| Native: | 13.5% (67) |
| Foreign-born: | 100.0% (170) |
White alone - Speak only English
| Native: | 98.7% (9,248) |
| Foreign-born: | 53.9% (210) |
White alone - Speak another language
| Native: | 1.3% (119) |
| Foreign-born: | 43.2% (168) |
Hispanic or Latino - Speak only English
| Native: | 51.8% (189) |
| Foreign-born: | 3.9% (8) |
Hispanic or Latino - Speak another language
| Native: | 47.9% (174) |
| Foreign-born: | 98.3% (198) |
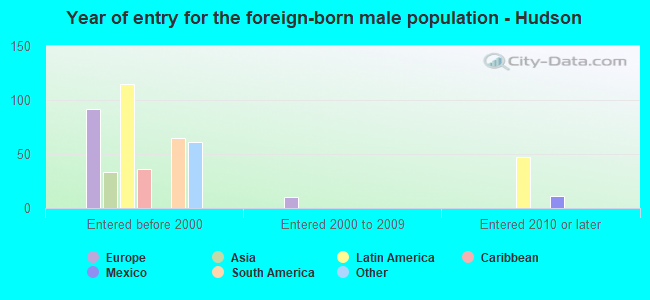
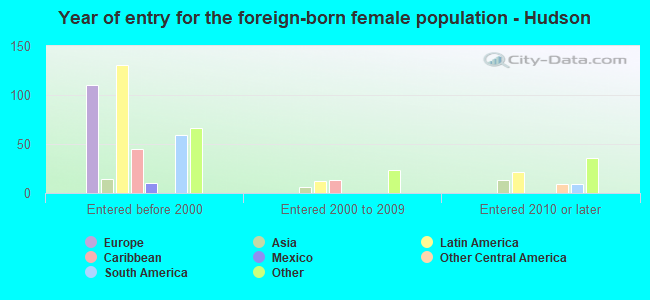
Foreign-born residents in Hudson
729 residents are foreign born (2.4% Latin America, 1.7% Europe, 1.6% North America, 0.6% Asia).
| This city: | 6.3% |
| Florida: | 21.1% |
Marital status for residents in Hudson
Marital status - White (Caucasian) population 15 years and over
- Males
- 24.3%Never married
- 52.7%Now married
- 2.5%Separated
- 5.6%Widowed
- 14.8%Divorced
- Females
- 14.8%Never married
- 49.0%Now married
- 1.8%Separated
- 18.7%Widowed
- 15.7%Divorced
Women who gave birth in the past 12 months
| Now married: | 0.0% (0) |
| Unmarried: | 100.0% (7) |
Women who did not give birth in the past 12 months
| Now married: | 41.4% (436) |
| Unmarried: | 58.6% (618) |
Marital status - Black or African American population 15 years and over
- Males
- 6.8%Never married
- 6.8%Now married
- 0.0%Separated
- 18.6%Widowed
- 67.8%Divorced
- Females
- 0.0%Never married
- 0.0%Now married
- 0.0%Separated
- 63.2%Widowed
- 36.8%Divorced
Marital status - American Indian / Alaska Native population 15 years and over
- Males
- 0.0%Never married
- 63.6%Now married
- 0.0%Separated
- 36.4%Widowed
- 0.0%Divorced
- Females
- 0.0%Never married
- 100.0%Now married
- 0.0%Separated
- 0.0%Widowed
- 0.0%Divorced
Marital status - Asian population 15 years and over
- Males
- 0.0%Never married
- 36.8%Now married
- 63.2%Separated
- 0.0%Widowed
- 0.0%Divorced
- Females
- 0.0%Never married
- 59.5%Now married
- 0.0%Separated
- 26.2%Widowed
- 14.3%Divorced
Women who did not give birth in the past 12 months
| Now married: | 100.0% (6) |
| Unmarried: | 0.0% (0) |
Marital status - Native Hawaiian / Pacific Islander population 15 years and over
- Males
- 0.0%Never married
- 50.0%Now married
- 0.0%Separated
- 0.0%Widowed
- 50.0%Divorced
- Females
- 0.0%Never married
- 100.0%Now married
- 0.0%Separated
- 0.0%Widowed
- 0.0%Divorced
Marital status - Other race population 15 years and over
- Males
- 55.6%Never married
- 44.4%Now married
- 0.0%Separated
- 0.0%Widowed
- 0.0%Divorced
- Females
- 92.6%Never married
- 7.4%Now married
- 0.0%Separated
- 0.0%Widowed
- 0.0%Divorced
Marital status - Two or more races population 15 years and over
- Males
- 26.6%Never married
- 41.3%Now married
- 14.7%Separated
- 4.9%Widowed
- 12.5%Divorced
- Females
- 30.2%Never married
- 45.5%Now married
- 3.6%Separated
- 14.0%Widowed
- 6.8%Divorced
Women who did not give birth in the past 12 months
| Now married: | 17.8% (20) |
| Unmarried: | 82.2% (92) |
Marital status - White alone, not Hispanic / Latino population 15 years and over
- Males
- 24.2%Never married
- 52.7%Now married
- 2.5%Separated
- 5.6%Widowed
- 15.1%Divorced
- Females
- 14.3%Never married
- 49.5%Now married
- 1.8%Separated
- 18.2%Widowed
- 16.1%Divorced
Women who gave birth in the past 12 months
| Now married: | 0.0% (0) |
| Unmarried: | 100.0% (7) |
Women who did not give birth in the past 12 months
| Now married: | 42.6% (462) |
| Unmarried: | 57.4% (622) |
Marital status - Hispanic or Latino population 15 years and over
- Males
- 31.9%Never married
- 45.0%Now married
- 10.8%Separated
- 6.0%Widowed
- 6.4%Divorced
- Females
- 40.6%Never married
- 33.8%Now married
- 0.0%Separated
- 24.8%Widowed
- 0.9%Divorced
Women who did not give birth in the past 12 months
| Now married: | 15.5% (15) |
| Unmarried: | 84.5% (82) |
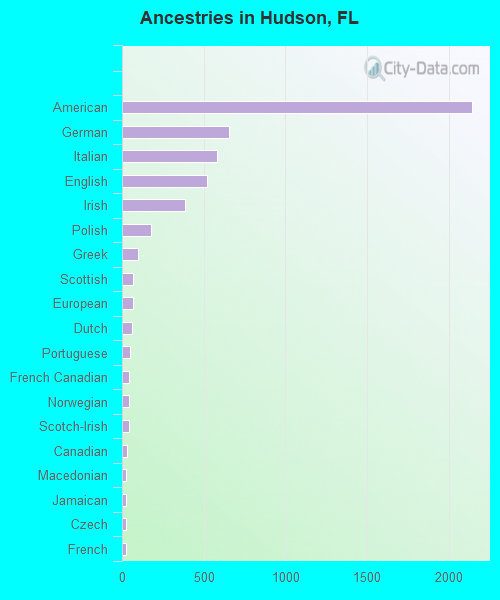
Ancestries in Hudson

- 2,14136.5%American
- 65411.1%German
- 5829.9%Italian
- 5208.9%English
- 3846.5%Irish
- 1803.1%Polish
- 971.7%Greek
- 691.2%Scottish
- 661.1%European
- 591.0%Dutch
- 510.9%Portuguese
- 440.7%French Canadian
- 440.7%Norwegian
- 430.7%Scotch-Irish
- 300.5%Canadian
- 270.5%Macedonian
- 270.5%Jamaican
- 260.4%Czech
- 230.4%French
- 190.3%Swedish
- 180.3%Slovak
- 120.2%Slavic
- 110.2%Russian
- 90.2%Australian
- 90.2%Maltese
- 80.1%Czechoslovakian
- 80.1%Finnish
- 80.1%Lithuanian
- 60.1%Armenian
- 60.1%British
- 60.1%Northern European
- 60.1%Welsh
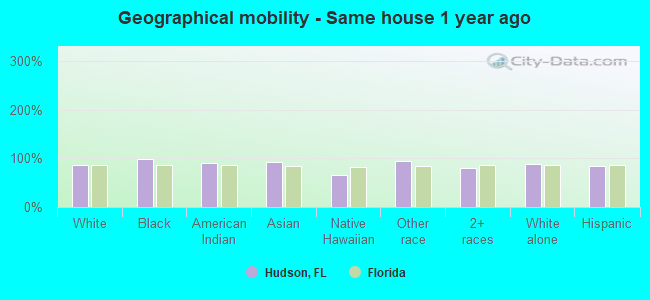
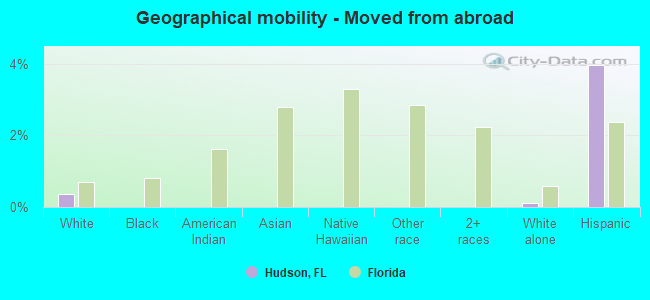
Geographical mobility in Hudson

- Same house 1 year ago
- 8,52887.1%White (Caucasian)
- 16198.6%Black or African American
- 4189.5%American Indian / Alaska Native
- 6392.9%Asian
- 565.1%Native Hawaiian / Pacific Islander
- 23494.7%Other race
- 53780.0%Two or more races
- 8,73387.4%White alone, not Hispanic / Latino
- 47983.5%Hispanic or Latino
-
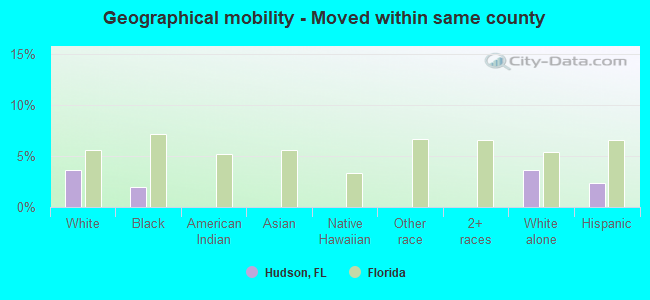
- Moved within same county
- 3543.6%White / Caucasian
- 32.0%Black or African American
- 3653.7%White alone, not Hispanic / Latino
- 142.4%Hispanic or Latino
-
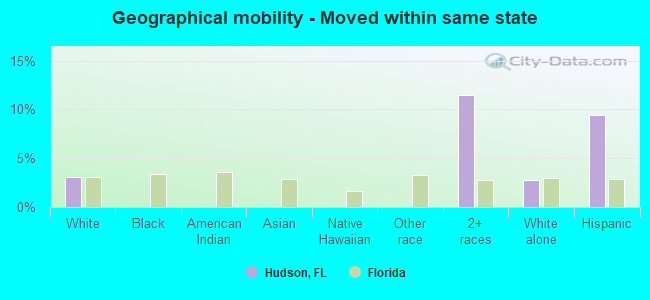
- Moved within same state
- 3043.1%White / Caucasian
- 7711.4%Two or more races
- 2792.8%White alone, not Hispanic / Latino
- 549.4%Hispanic or Latino
-
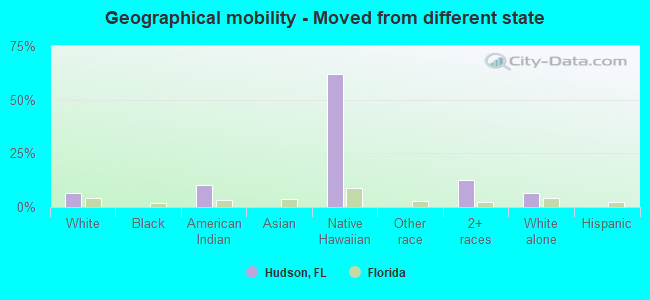
- Moved from different state
- 6206.3%White / Caucasian
- 510.4%American Indian / Alaska Native
- 561.8%Native Hawaiian / Pacific Islander
- 8312.4%Two or more races
- 6446.4%White alone, not Hispanic / Latino
-
- Moved from abroad
- 360.4%White
- 110.1%White alone, not Hispanic / Latino
- 234.0%Hispanic or Latino
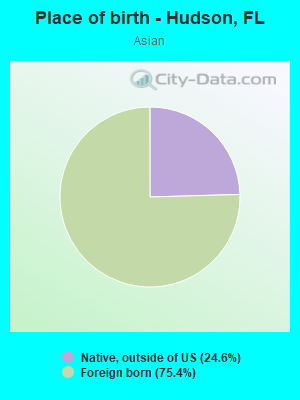
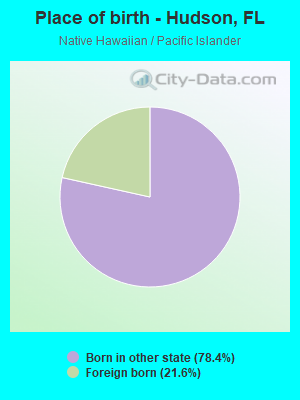
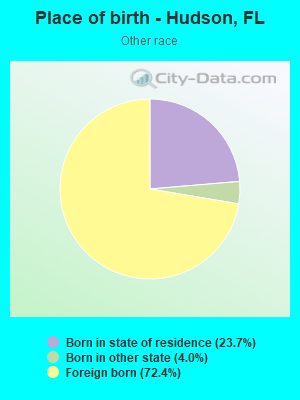
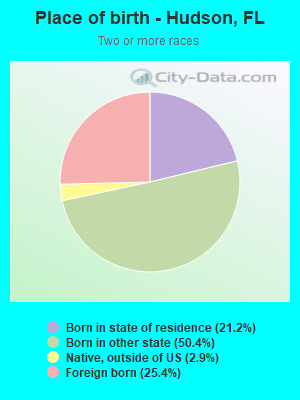
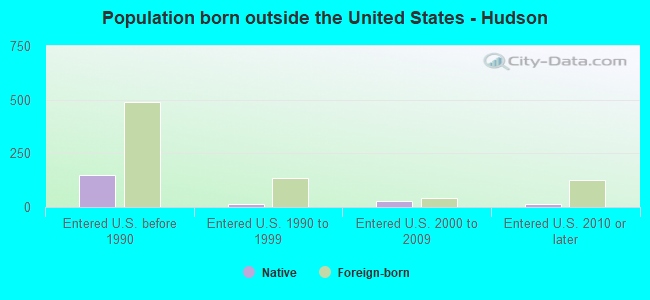
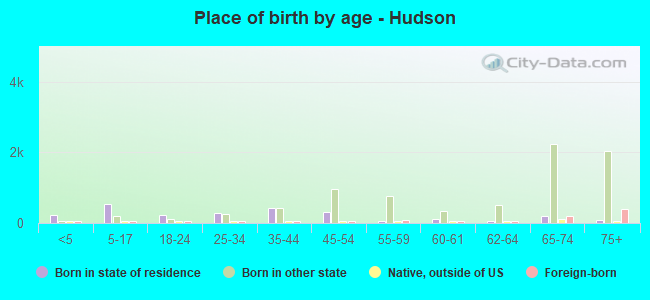
Children Nativity (place of birth) in Hudson
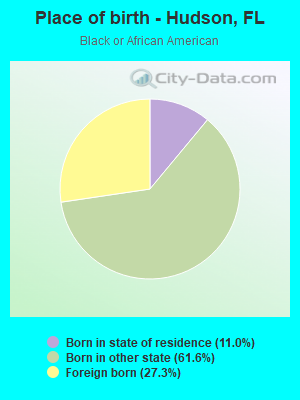
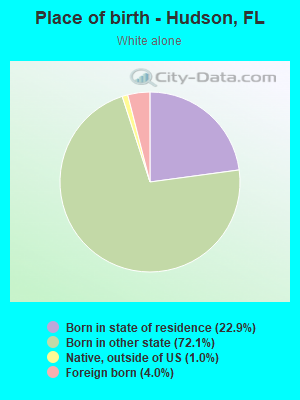
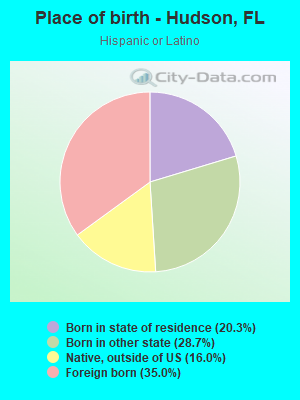
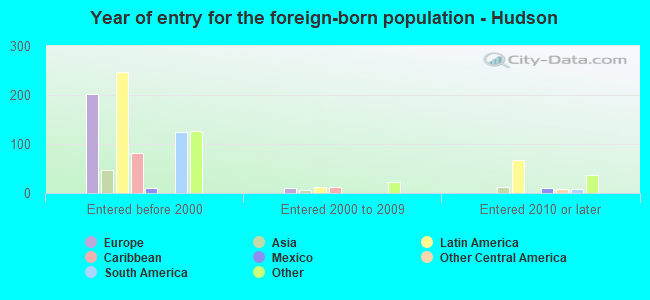
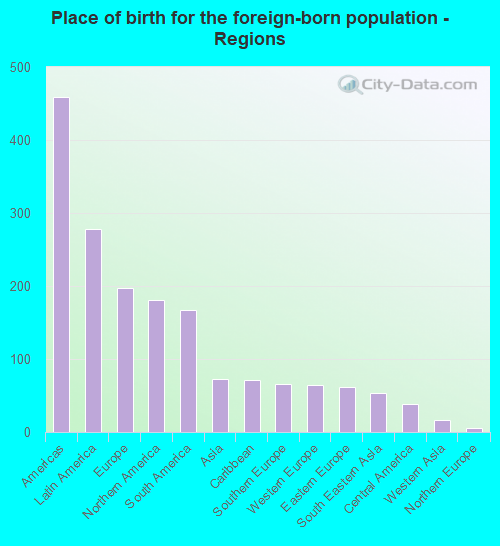
Place of birth for residents in Hudson
![Place of birth for the foreign-born population - Regions]()
- 459Americas
- 278Latin America
- 197Europe
- 181Northern America
- 167South America
- 72Asia
- 71Caribbean
- 66Southern Europe
- 65Western Europe
- 61Eastern Europe
- 54South Eastern Asia
- 38Central America
- 17Western Asia
- 5Northern Europe
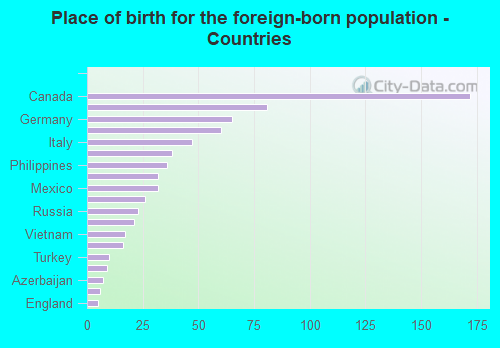
![Place of birth for the foreign-born population - Countries]()
- 172Canada
- 81Brazil
- 65Germany
- 60Ecuador
- 47Italy
- 38Cuba
- 36Philippines
- 32Jamaica
- 32Mexico
- 26Colombia
- 23Russia
- 21North Macedonia (Macedonia)
- 17Vietnam
- 16Poland
- 10Turkey
- 9Spain
- 7Azerbaijan
- 6Panama
- 5England
Grandparents responsible for own grandchildren in Hudson
Zip codes: 34667.