Races in Huntington, Indiana (IN) Detailed Stats
Ancestries, Foreign-born residents, place of birth
Settings
X


Recent posts about races in Huntington, Indiana on our local forum with over 2,400,000 registered users:
 | Is finding a rental impossible? (5 replies) |
| Question about "Tolerance" (35 replies) |
| Fort Wayne Racist??? (57 replies) |
| Need help deciding between Wabash and Huntington, IN. (12 replies) |
| Racism against Asians? (30 replies) |
| Howdy from Huntington (5 replies) |
Latest news about races in Huntington, IN collected exclusively by city-data.com from local newspapers, TV, and radio stations
According to 2022 data, the most numerous races in Huntington, IN are White alone (15,562 residents), Black alone (210 residents), and Hispanic (566 residents). 94.4% of Huntington residents speak English at home. 2.5% of Huntington, IN residents are foreign-born (1.1% born in Asia, 0.8% born in Latin America, 0.3% born in Africa), which is 142.5% less than the foreign-born rate of 6.0% across the entire state of Indiana.
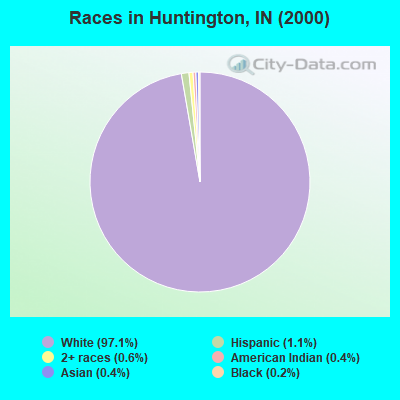
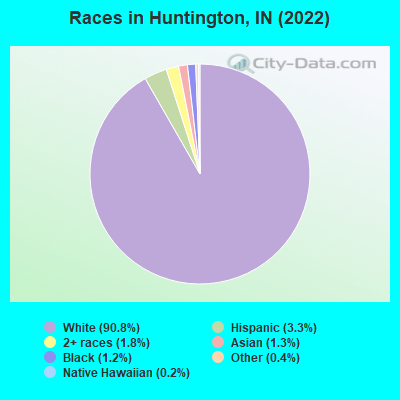
Race distribution in Huntington
2000
2022

- 16,95097.1%White alone
- 1961.1%Hispanic
- 1070.6%Two or more races
- 730.4%Asian alone
- 770.4%American Indian alone
- 340.2%Black alone
- 90.05%Other race alone
- 40.02%Native Hawaiian and Other
Pacific Islander alone
-
- 15,56290.8%White alone
- 5663.3%Hispanic
- 3151.8%Two or more races
- 2271.3%Asian alone
- 2101.2%Black alone
- 660.4%Other race alone
- 380.2%Native Hawaiian and Other
Pacific Islander alone - 170.10%American Indian alone
2000
2022
-
- 5,219,37385.8%White alone
- 505,4628.3%Black alone
- 214,5363.5%Hispanic
- 61,1151.0%Two or more races
- 58,4241.0%Asian alone
- 13,6540.2%American Indian alone
- 6,3480.1%Other race alone
- 1,5730.03%Native Hawaiian and Other
Pacific Islander alone

-
- 5,192,45576.0%White alone
- 628,0549.2%Black alone
- 534,5287.8%Hispanic
- 263,2423.9%Two or more races
- 172,8802.5%Asian alone
- 33,4670.5%Other race alone
- 5,8660.09%American Indian alone
- 2,5450.04%Native Hawaiian and Other
Pacific Islander alone

Income and house value in Huntington
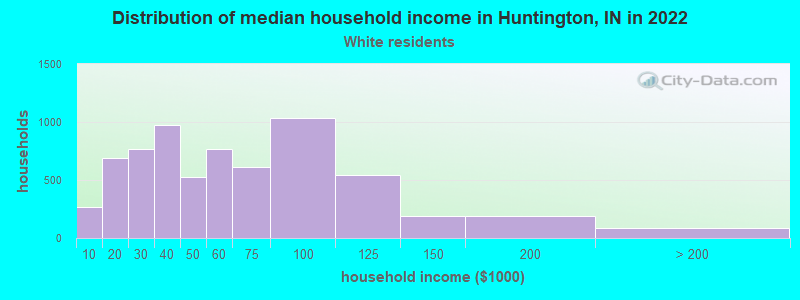
- Median household income in 2022
- $51,479White non-Hispanic householders
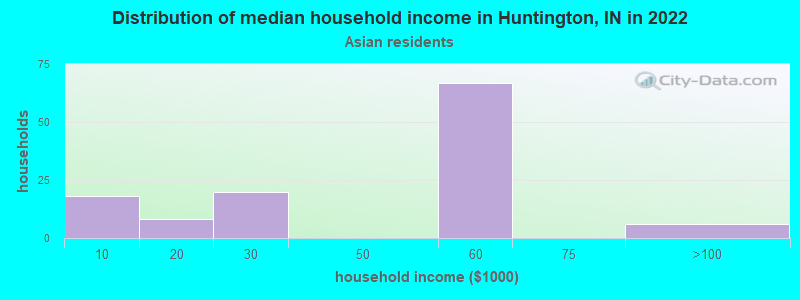
- $53,446Asian householders
- $2,459Some other race householders
- $53,027Two or more races householders
- Median 2022 house value
- $109,686White Non-Hispanic householders
- $173,799Black or African American householders
- $52,680American Indian or Alaska Native householders
- $173,799Asian householders
- $173,799Some other race householders
- $98,254Two or more races householders
- $177,661Hispanic or Latino householders
Household income for White non-Hispanic householders
Household income for Asian householders
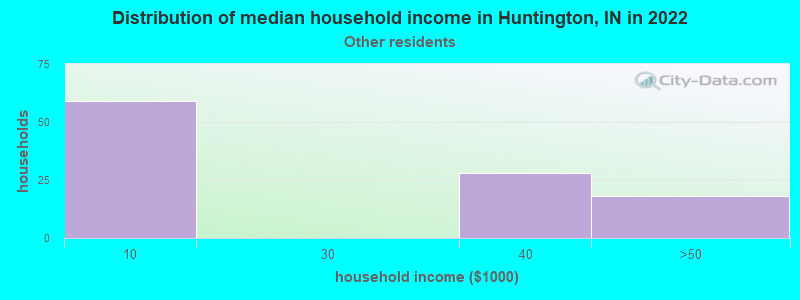
Household income for Some other race householders
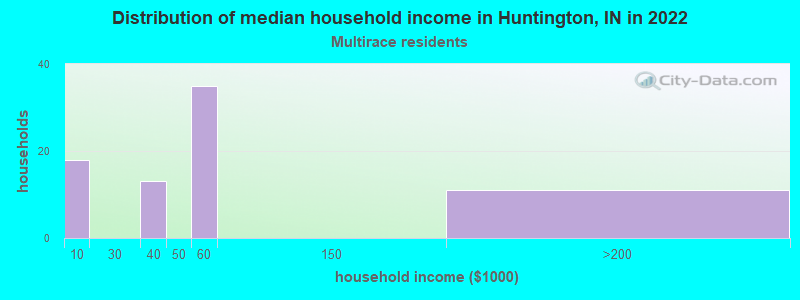
Household income for Two or more races householders
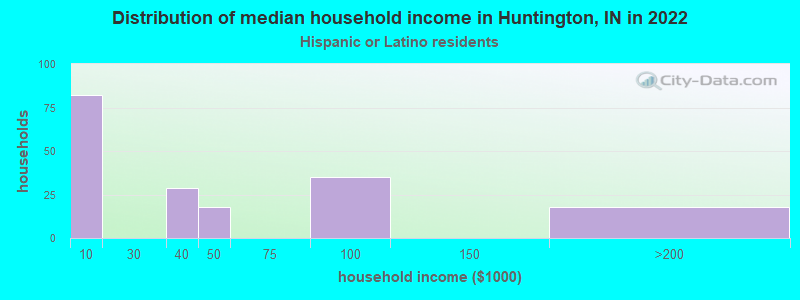
Household income for Hispanic or Latino race householders
Median age by race in Huntington
- 37.4Median age for White residents
- 37.9Males
- 37.1Females
- 25.0Median age for Black or African American residents
- 24.6Males
- 25.5Females
- 15.8Median age for American Indian / Alaska Native residents
- 20.1Males
- -491,600,353.2Females
- 41.5Median age for Asian residents
- 42.1Males
- 35.6Females
- -664,335,663.7Median age for Native Hawaiian / Pacific Islander residents
- -644,025,156.6Males
- -664,437,011.6Females
- 35.4Median age for Other race residents
- 32.8Males
- 48.1Females
- 25.7Median age for Two or more races residents
- 15.9Males
- 46.0Females
- 38.0Median age for White alone residents
- 38.7Males
- 36.9Females
- 31.9Median age for Hispanic or Latino residents
- 30.5Males
- 35.5Females
Owner/renter occupied households by race in Huntington
- House owners and renters - White residents
- 4,31865.0%Owner occupied
- 2,32135.0%Renter occupied
- House owners and renters - Black or African American residents
- 9100.0%Owner occupied
- House owners and renters - American Indian / Alaska Native residents
- 7100.0%Owner occupied
- House owners and renters - Asian residents
- 3633.5%Owner occupied
- 7266.5%Renter occupied
- House owners and renters - Other race residents
- 3527.8%Owner occupied
- 9172.2%Renter occupied
- House owners and renters - Two or more races residents
- 4860.7%Owner occupied
- 3139.3%Renter occupied
- House owners and renters - White alone residents
- 4,28564.7%Owner occupied
- 2,33535.3%Renter occupied
- House owners and renters - Hispanic or Latino residents
- 8040.9%Owner occupied
- 11659.1%Renter occupied
Language usage in Huntington
- English speakers - Total
- 94.4% of residents of Huntington speak English at home.
- 2.4% of residents speak Spanish at home
- 25062.8%Speak English very well
- 14837.2%Speak English less than very well
- 2.8% of residents speak other language at home
- 26358.7%Speak English very well
- 18541.3%Speak English less than very well
- English speakers - Born in the United States
- 96.0% of residents of Huntington speak English at home.
- 3.2% of residents speak Spanish at home
- 9680.7%Speak English very well
- 2319.3%Speak English less than very well
- 0.5% of residents speak other language at home
- 17100.0%Speak English very well
All residents speak only English at home
- English speakers - Foreign-born
- 12.2% of residents of Huntington speak English at home.
- 27.3% of residents speak Spanish at home
- 116100.0%Speak English less than very well
- 62.6% of residents speak other language at home
- 9134.2%Speak English very well
- 17565.8%Speak English less than very well
White (Caucasian) - Speak only English
| Native: | 97.9% (14,543) |
| Foreign-born: | 100.0% (7) |
Black or African American - Speak only English
| Native: | 99.5% (113) |
| Foreign-born: | 29.7% (38) |
Asian - Speak only English
| Native: | 94.8% (31) |
| Foreign-born: | 2.1% (4) |
Other race - Speak another language
| Native: | 35.1% (67) |
| Foreign-born: | 97.7% (113) |
Two or more races - Speak another language
| Native: | 9.4% (35) |
| Foreign-born: | 99.0% (6) |
White alone - Speak only English
| Native: | 97.7% (14,419) |
| Foreign-born: | 93.1% (9) |
Hispanic or Latino - Speak another language
| Native: | 22.7% (91) |
| Foreign-born: | 99.5% (110) |
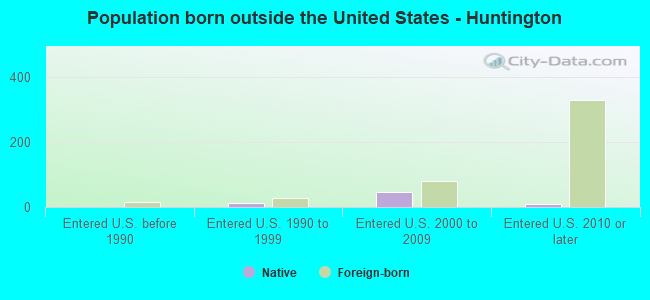
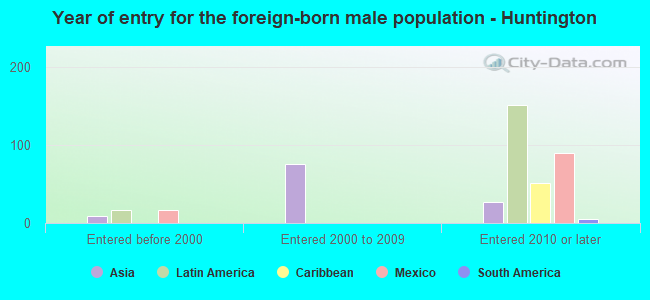
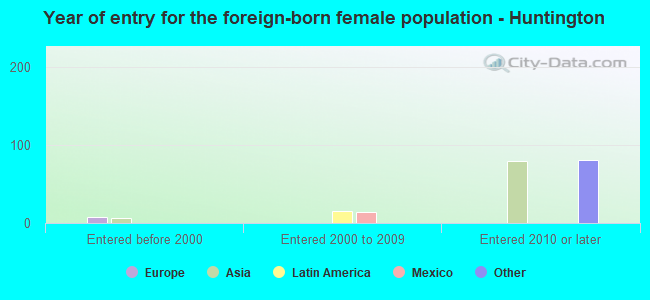
Foreign-born residents in Huntington
424 residents are foreign born (1.1% Asia, 0.8% Latin America, 0.3% Africa).
| This city: | 2.5% |
| Indiana: | 5.6% |

Marital status for residents in Huntington
Marital status - White (Caucasian) population 15 years and over
- Males
- 36.3%Never married
- 45.5%Now married
- 1.8%Separated
- 3.0%Widowed
- 13.5%Divorced
- Females
- 32.0%Never married
- 38.8%Now married
- 2.2%Separated
- 10.8%Widowed
- 16.1%Divorced
Women who gave birth in the past 12 months
| Now married: | 57.6% (128) |
| Unmarried: | 42.4% (95) |
Women who did not give birth in the past 12 months
| Now married: | 38.6% (1,353) |
| Unmarried: | 61.4% (2,148) |
Marital status - Black or African American population 15 years and over
- Males
- 87.3%Never married
- 8.2%Now married
- 0.0%Separated
- 0.0%Widowed
- 4.5%Divorced
- Females
- 45.2%Never married
- 40.3%Now married
- 0.0%Separated
- 0.0%Widowed
- 14.5%Divorced
Women who did not give birth in the past 12 months
| Now married: | 41.7% (25) |
| Unmarried: | 58.3% (35) |
Marital status - American Indian / Alaska Native population 15 years and over
- Males
- 63.6%Never married
- 36.4%Now married
- 0.0%Separated
- 0.0%Widowed
- 0.0%Divorced
- Females
- 100.0%Never married
- 0.0%Now married
- 0.0%Separated
- 0.0%Widowed
- 0.0%Divorced
Women who did not give birth in the past 12 months
| Now married: | 0.0% (0) |
| Unmarried: | 100.0% (9) |
Marital status - Asian population 15 years and over
- Males
- 24.8%Never married
- 69.4%Now married
- 0.0%Separated
- 5.8%Widowed
- 0.0%Divorced
- Females
- 43.0%Never married
- 37.0%Now married
- 0.0%Separated
- 0.0%Widowed
- 20.0%Divorced
Women who gave birth in the past 12 months
| Now married: | 0.0% (0) |
| Unmarried: | 100.0% (21) |
Women who did not give birth in the past 12 months
| Now married: | 27.1% (17) |
| Unmarried: | 72.9% (45) |
Marital status - Other race population 15 years and over
- Males
- 62.3%Never married
- 25.4%Now married
- 0.0%Separated
- 0.0%Widowed
- 12.3%Divorced
- Females
- 30.8%Never married
- 0.0%Now married
- 0.0%Separated
- 0.0%Widowed
- 69.2%Divorced
Women who did not give birth in the past 12 months
| Now married: | 0.0% (0) |
| Unmarried: | 100.0% (146) |
Marital status - Two or more races population 15 years and over
- Males
- 66.7%Never married
- 29.3%Now married
- 0.0%Separated
- 0.0%Widowed
- 4.0%Divorced
- Females
- 18.8%Never married
- 25.7%Now married
- 0.0%Separated
- 44.6%Widowed
- 10.9%Divorced
Women who did not give birth in the past 12 months
| Now married: | 21.4% (21) |
| Unmarried: | 78.6% (75) |
Marital status - White alone, not Hispanic / Latino population 15 years and over
- Males
- 35.8%Never married
- 45.6%Now married
- 1.8%Separated
- 3.1%Widowed
- 13.8%Divorced
- Females
- 31.6%Never married
- 39.2%Now married
- 2.2%Separated
- 10.9%Widowed
- 16.1%Divorced
Women who gave birth in the past 12 months
| Now married: | 57.6% (131) |
| Unmarried: | 42.4% (96) |
Women who did not give birth in the past 12 months
| Now married: | 39.4% (1,375) |
| Unmarried: | 60.6% (2,119) |
Marital status - Hispanic or Latino population 15 years and over
- Males
- 62.5%Never married
- 31.6%Now married
- 0.0%Separated
- 0.0%Widowed
- 5.8%Divorced
- Females
- 52.1%Never married
- 6.7%Now married
- 0.0%Separated
- 0.0%Widowed
- 41.1%Divorced
Women who did not give birth in the past 12 months
| Now married: | 0.0% (0) |
| Unmarried: | 100.0% (153) |
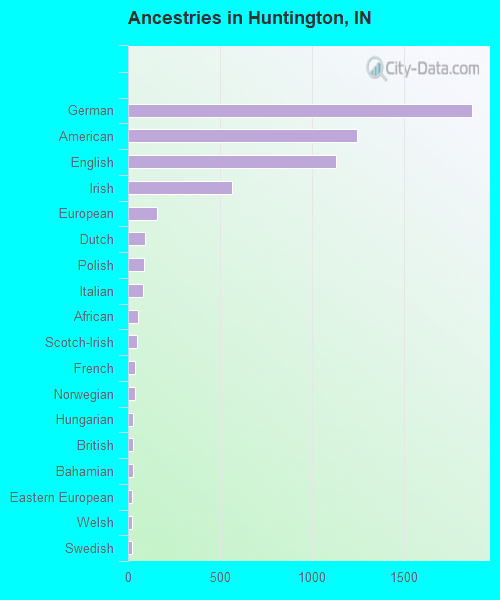
Ancestries in Huntington

- 1,86926.8%German
- 1,24517.9%American
- 1,13016.2%English
- 5688.1%Irish
- 1592.3%European
- 931.3%Dutch
- 891.3%Polish
- 841.2%Italian
- 520.7%African
- 480.7%Scotch-Irish
- 390.6%French
- 360.5%Norwegian
- 290.4%Hungarian
- 270.4%British
- 250.4%Bahamian
- 240.3%Eastern European
- 240.3%Welsh
- 200.3%Swedish
- 150.2%Scottish
- 110.2%Northern European
- 110.2%Swiss
- 100.1%Armenian
- 70.1%Belgian
- 40.06%Danish
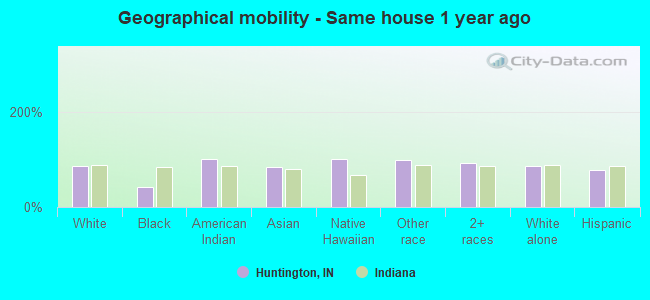
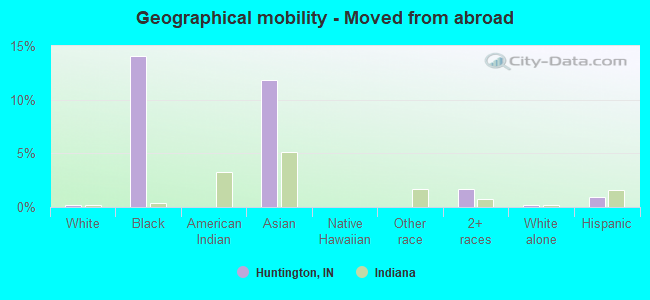
Geographical mobility in Huntington

- Same house 1 year ago
- 13,18785.6%White (Caucasian)
- 9042.3%Black or African American
- 30100.0%American Indian / Alaska Native
- 19184.2%Asian
- 37100.0%Native Hawaiian / Pacific Islander
- 30198.2%Other race
- 39392.9%Two or more races
- 13,21685.9%White alone, not Hispanic / Latino
- 43577.7%Hispanic or Latino
-
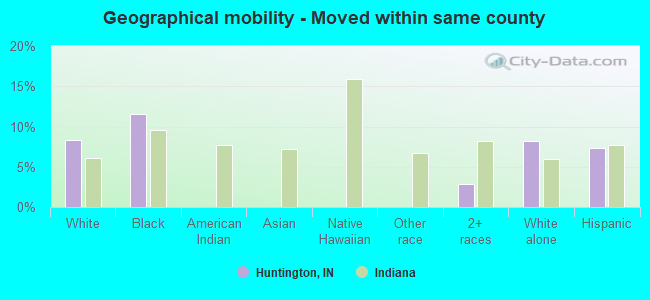
- Moved within same county
- 1,2738.3%White / Caucasian
- 2411.5%Black or African American
- 122.9%Two or more races
- 1,2618.2%White alone, not Hispanic / Latino
- 417.3%Hispanic or Latino
-
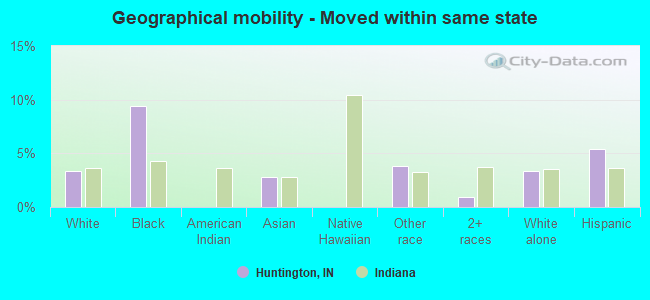
- Moved within same state
- 5233.4%White / Caucasian
- 209.4%Black or African American
- 62.8%Asian
- 123.8%Other race
- 40.9%Two or more races
- 5133.3%White alone, not Hispanic / Latino
- 305.4%Hispanic or Latino
-
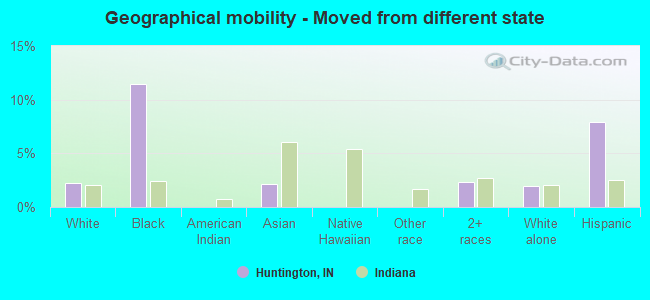
- Moved from different state
- 3422.2%White / Caucasian
- 2411.4%Black or African American
- 52.2%Asian
- 102.3%Two or more races
- 3082.0%White alone, not Hispanic / Latino
- 447.9%Hispanic or Latino
-
- Moved from abroad
- 350.2%White
- 3014.0%Black or African American
- 2711.9%Asian
- 71.6%Two or more races
- 350.2%White alone, not Hispanic / Latino
- 51.0%Hispanic or Latino
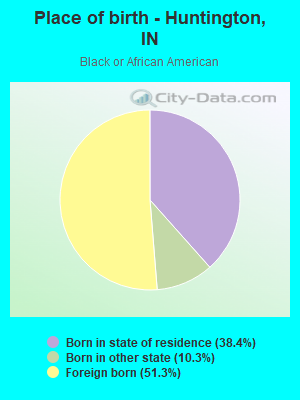
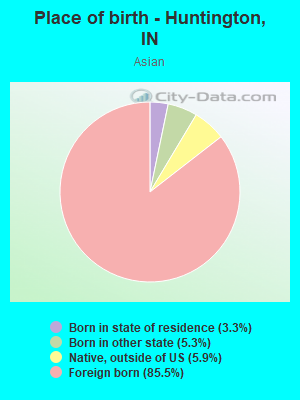
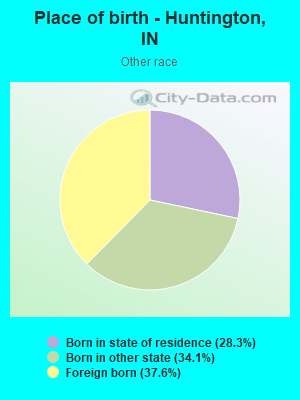
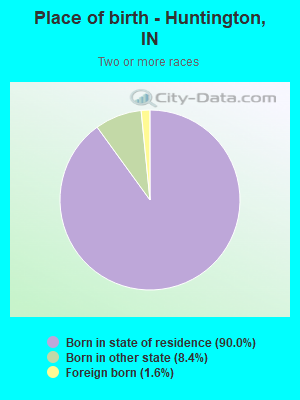
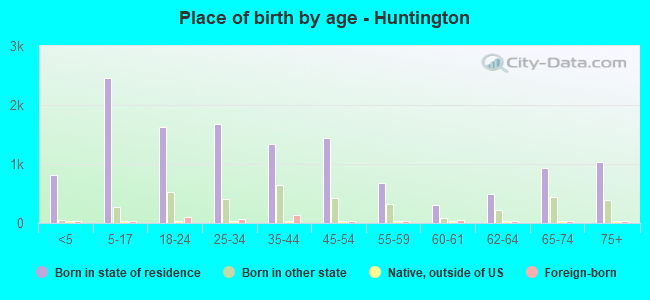
Children Nativity (place of birth) in Huntington
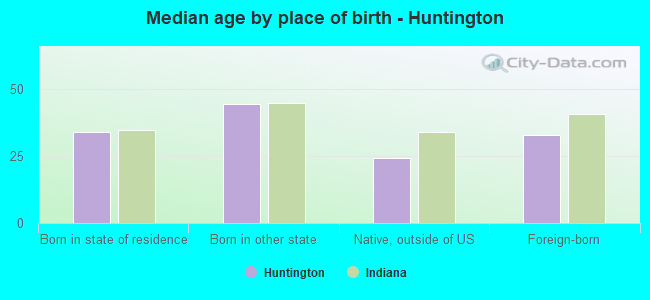
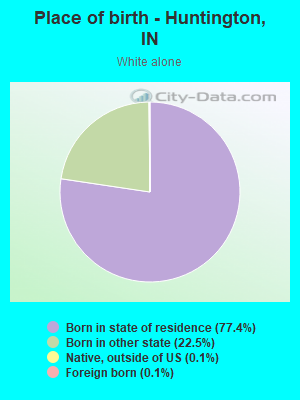
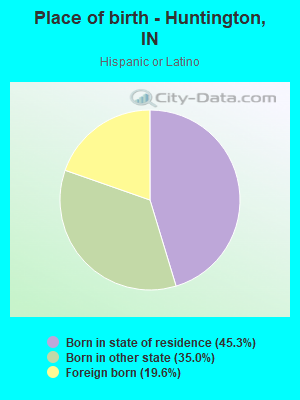
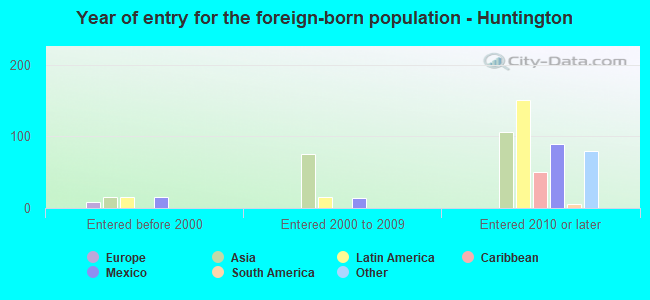
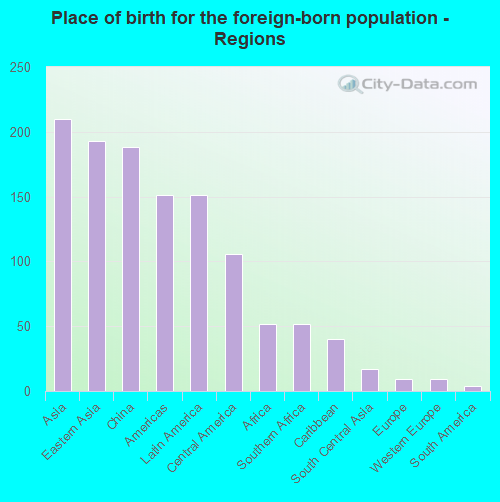
Place of birth for residents in Huntington
![Place of birth for the foreign-born population - Regions]()
- 210Asia
- 193Eastern Asia
- 188China
- 151Americas
- 151Latin America
- 106Central America
- 52Africa
- 52Southern Africa
- 40Caribbean
- 17South Central Asia
- 9Europe
- 9Western Europe
- 4South America
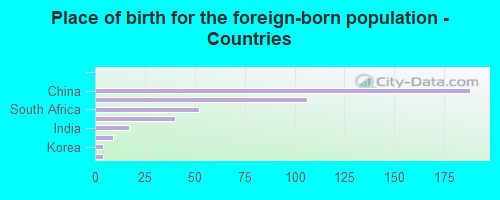
![Place of birth for the foreign-born population - Countries]()
- 188China
- 106Mexico
- 52South Africa
- 40Bahamas
- 17India
- 9Germany
- 4Korea
- 4Argentina
Grandparents responsible for own grandchildren in Huntington
Zip codes: 46750.