Races in Huntington Station, New York (NY) Detailed Stats
Data:
Races - White alone (%)
Races - White alone (% change since 2000)
Races - Black alone (%)
Races - Black alone (% change since 2000)
Races - American Indian alone (%)
Races - American Indian alone (% change since 2000)
Races - Asian alone (%)
Races - Asian alone (% change since 2000)
Races - Hispanic (%)
Races - Hispanic (% change since 2000)
Races - Native Hawaiian and Other Pacific Islander alone (%)
Races - Native Hawaiian and Other Pacific Islander alone (% change since 2000)
Races - Two or more races(%)
Races - Two or more races(% change since 2000)
Races - Other race alone (%)
Races - Other race alone (% change since 2000)
Racial diversity
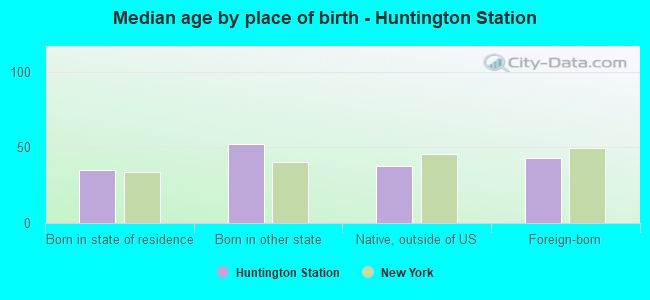
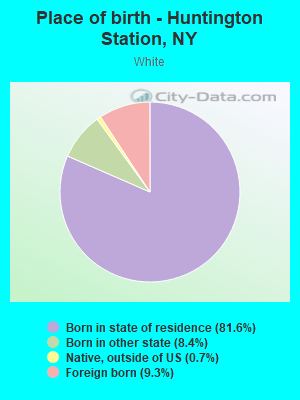
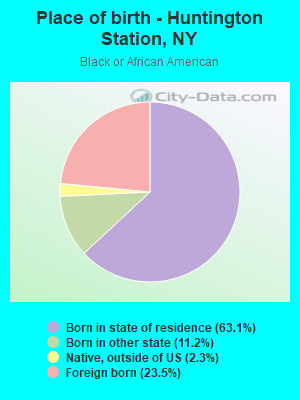
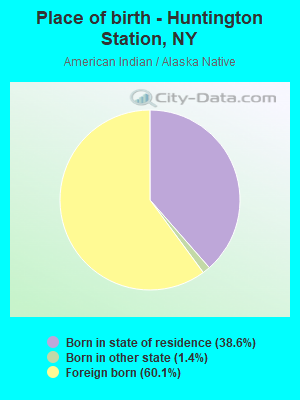
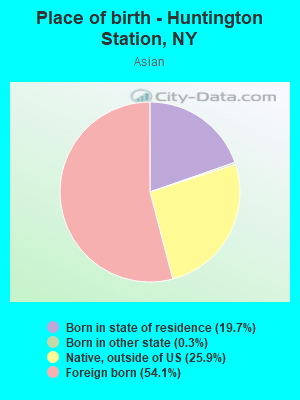
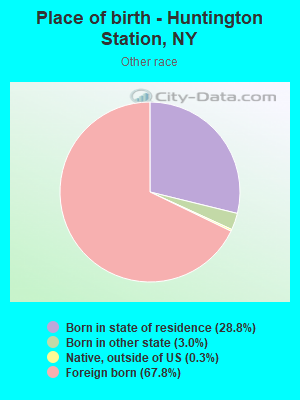
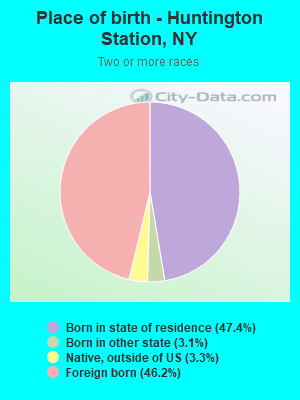
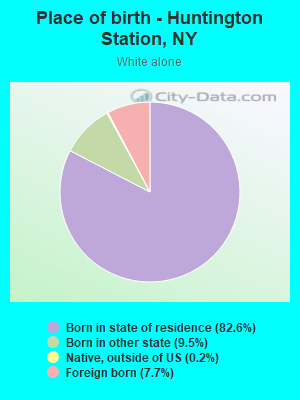
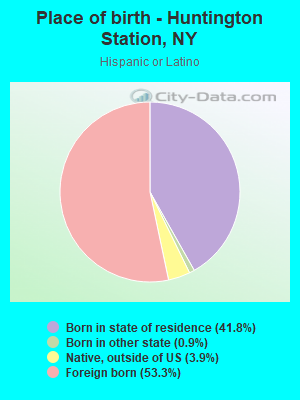
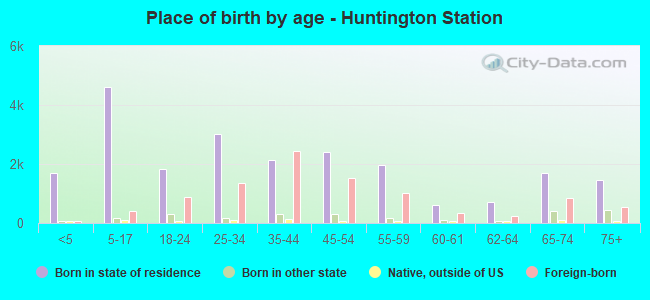
Place of birth - Born in state of residence (%)
Place of birth - Born in state of residence (%) - White
Place of birth - Born in state of residence (%) - Black or African American
Place of birth - Born in state of residence (%) - Asian
Place of birth - Born in state of residence (%) - Hispanic or Latino
Place of birth - Born in state of residence (%) - American Indian and Alaska Native
Place of birth - Born in state of residence (%) - Multirace
Place of birth - Born in state of residence (%) - Other Race
Place of birth - Born in other state (%)
Place of birth - Born in other state (%) - White
Place of birth - Born in other state (%) - Black or African American
Place of birth - Born in other state (%) - Asian
Place of birth - Born in other state (%) - Hispanic or Latino
Place of birth - Born in other state (%) - American Indian and Alaska Native
Place of birth - Born in other state (%) - Multirace
Place of birth - Born in other state (%) - Other Race
Place of birth - Native, outside of US (%)
Place of birth - Native, outside of US (%) - White
Place of birth - Native, outside of US (%) - Black or African American
Place of birth - Native, outside of US (%) - Asian
Place of birth - Native, outside of US (%) - Hispanic or Latino
Place of birth - Native, outside of US (%) - American Indian and Alaska Native
Place of birth - Native, outside of US (%) - Multirace
Place of birth - Native, outside of US (%) - Other Race
Place of birth - Foreign born (%)
Place of birth - Foreign born (%) - White
Place of birth - Foreign born (%) - Black or African American
Place of birth - Foreign born (%) - Asian
Place of birth - Foreign born (%) - Hispanic or Latino
Place of birth - Foreign born (%) - American Indian and Alaska Native
Place of birth - Foreign born (%) - Multirace
Place of birth - Foreign born (%) - Other Race
Residents speaking English at home (%)
Residents speaking English at home - Born in the United States (%)
Residents speaking English at home - Native, born elsewhere (%)
Residents speaking English at home - Foreign born (%)
Residents speaking Spanish at home (%)
Residents speaking Spanish at home - Born in the United States (%)
Residents speaking Spanish at home - Native, born elsewhere (%)
Residents speaking Spanish at home - Foreign born (%)
Residents speaking other language at home (%)
Residents speaking other language at home - Born in the United States (%)
Residents speaking other language at home - Native, born elsewhere (%)
Residents speaking other language at home - Foreign born (%)
Marital status - Never married (%)
Marital status - Now married (%)
Marital status - Separated (%)
Marital status - Widowed (%)
Marital status - Divorced (%)
Ancestries Reported - Arab (%)
Ancestries Reported - Czech (%)
Ancestries Reported - Danish (%)
Ancestries Reported - Dutch (%)
Ancestries Reported - English (%)
Ancestries Reported - French (%)
Ancestries Reported - French Canadian (%)
Ancestries Reported - German (%)
Ancestries Reported - Greek (%)
Ancestries Reported - Hungarian (%)
Ancestries Reported - Irish (%)
Ancestries Reported - Italian (%)
Ancestries Reported - Lithuanian (%)
Ancestries Reported - Norwegian (%)
Ancestries Reported - Polish (%)
Ancestries Reported - Portuguese (%)
Ancestries Reported - Russian (%)
Ancestries Reported - Scotch-Irish (%)
Ancestries Reported - Scottish (%)
Ancestries Reported - Slovak (%)
Ancestries Reported - Subsaharan African (%)
Ancestries Reported - Swedish (%)
Ancestries Reported - Swiss (%)
Ancestries Reported - Ukrainian (%)
Ancestries Reported - United States (%)
Ancestries Reported - Welsh (%)
Ancestries Reported - West Indian (%)
Ancestries Reported - Other (%)
Geographical mobility - Same house 1 year ago (%)
Geographical mobility - Same house 1 year ago (%) - White
Geographical mobility - Same house 1 year ago (%) - Black or African American
Geographical mobility - Same house 1 year ago (%) - Asian
Geographical mobility - Same house 1 year ago (%) - Hispanic or Latino
Geographical mobility - Same house 1 year ago (%) - American Indian and Alaska Native
Geographical mobility - Same house 1 year ago (%) - Multirace
Geographical mobility - Same house 1 year ago (%) - Other Race
Geographical mobility - Moved within same county (%)
Geographical mobility - Moved within same county (%) - White
Geographical mobility - Moved within same county (%) - Black or African American
Geographical mobility - Moved within same county (%) - Asian
Geographical mobility - Moved within same county (%) - Hispanic or Latino
Geographical mobility - Moved within same county (%) - American Indian and Alaska Native
Geographical mobility - Moved within same county (%) - Multirace
Geographical mobility - Moved within same county (%) - Other Race
Geographical mobility - Moved from different county within same state (%)
Geographical mobility - Moved from different county within same state (%) - White
Geographical mobility - Moved from different county within same state (%) - Black or African American
Geographical mobility - Moved from different county within same state (%) - Asian
Geographical mobility - Moved from different county within same state (%) - Hispanic or Latino
Geographical mobility - Moved from different county within same state (%) - American Indian and Alaska Native
Geographical mobility - Moved from different county within same state (%) - Multirace
Geographical mobility - Moved from different county within same state (%) - Other Race
Geographical mobility - Moved from different state (%)
Geographical mobility - Moved from different state (%) - White
Geographical mobility - Moved from different state (%) - Black or African American
Geographical mobility - Moved from different state (%) - Asian
Geographical mobility - Moved from different state (%) - Hispanic or Latino
Geographical mobility - Moved from different state (%) - American Indian and Alaska Native
Geographical mobility - Moved from different state (%) - Multirace
Geographical mobility - Moved from different state (%) - Other Race
Geographical mobility - Moved from abroad (%)
Geographical mobility - Moved from abroad (%) - White
Geographical mobility - Moved from abroad (%) - Black or African American
Geographical mobility - Moved from abroad (%) - Asian
Geographical mobility - Moved from abroad (%) - Hispanic or Latino
Geographical mobility - Moved from abroad (%) - American Indian and Alaska Native
Geographical mobility - Moved from abroad (%) - Multirace
Geographical mobility - Moved from abroad (%) - Other Race
Place of birth for the foreign-born population - Ireland (%)
Place of birth for the foreign-born population - Denmark (%)
Place of birth for the foreign-born population - Norway (%)
Place of birth for the foreign-born population - Sweden (%)
Place of birth for the foreign-born population - United Kingdom (%)
Place of birth for the foreign-born population - England (%)
Place of birth for the foreign-born population - Scotland (%)
Place of birth for the foreign-born population - Other Northern Europe (%)
Place of birth for the foreign-born population - Austria (%)
Place of birth for the foreign-born population - Belgium (%)
Place of birth for the foreign-born population - France (%)
Place of birth for the foreign-born population - Germany (%)
Place of birth for the foreign-born population - Netherlands (%)
Place of birth for the foreign-born population - Switzerland (%)
Place of birth for the foreign-born population - Other Western Europe (%)
Place of birth for the foreign-born population - Greece (%)
Place of birth for the foreign-born population - Italy (%)
Place of birth for the foreign-born population - Portugal (%)
Place of birth for the foreign-born population - Spain (%)
Place of birth for the foreign-born population - Other Southern Europe (%)
Place of birth for the foreign-born population - Albania (%)
Place of birth for the foreign-born population - Belarus (%)
Place of birth for the foreign-born population - Bosnia and Herzegovina (%)
Place of birth for the foreign-born population - Bulgaria (%)
Place of birth for the foreign-born population - Croatia (%)
Place of birth for the foreign-born population - Czechoslovakia (%)
Place of birth for the foreign-born population - Hungary (%)
Place of birth for the foreign-born population - Latvia (%)
Place of birth for the foreign-born population - Lithuania (%)
Place of birth for the foreign-born population - North Macedonia (Macedonia) (%)
Place of birth for the foreign-born population - Moldova (%)
Place of birth for the foreign-born population - Poland (%)
Place of birth for the foreign-born population - Romania (%)
Place of birth for the foreign-born population - Russia (%)
Place of birth for the foreign-born population - Serbia (%)
Place of birth for the foreign-born population - Ukraine (%)
Place of birth for the foreign-born population - Other Eastern Europe (%)
Place of birth for the foreign-born population - China (%)
Place of birth for the foreign-born population - Hong Kong (%)
Place of birth for the foreign-born population - Taiwan (%)
Place of birth for the foreign-born population - Japan (%)
Place of birth for the foreign-born population - Korea (%)
Place of birth for the foreign-born population - Other Eastern Asia (%)
Place of birth for the foreign-born population - Afghanistan (%)
Place of birth for the foreign-born population - Bangladesh (%)
Place of birth for the foreign-born population - India (%)
Place of birth for the foreign-born population - Iran (%)
Place of birth for the foreign-born population - Kazakhstan (%)
Place of birth for the foreign-born population - Nepal (%)
Place of birth for the foreign-born population - Pakistan (%)
Place of birth for the foreign-born population - Sri Lanka (%)
Place of birth for the foreign-born population - Uzbekistan (%)
Place of birth for the foreign-born population - Other South Central Asia (%)
Place of birth for the foreign-born population - Burma (%)
Place of birth for the foreign-born population - Cambodia (%)
Place of birth for the foreign-born population - Indonesia (%)
Place of birth for the foreign-born population - Laos (%)
Place of birth for the foreign-born population - Malaysia (%)
Place of birth for the foreign-born population - Philippines (%)
Place of birth for the foreign-born population - Singapore (%)
Place of birth for the foreign-born population - Thailand (%)
Place of birth for the foreign-born population - Vietnam (%)
Place of birth for the foreign-born population - Other South Eastern Asia (%)
Place of birth for the foreign-born population - Armenia (%)
Place of birth for the foreign-born population - Iraq (%)
Place of birth for the foreign-born population - Israel (%)
Place of birth for the foreign-born population - Jordan (%)
Place of birth for the foreign-born population - Kuwait (%)
Place of birth for the foreign-born population - Lebanon (%)
Place of birth for the foreign-born population - Saudi Arabia (%)
Place of birth for the foreign-born population - Syria (%)
Place of birth for the foreign-born population - Turkey (%)
Place of birth for the foreign-born population - Yemen (%)
Place of birth for the foreign-born population - Other Western Asia (%)
Place of birth for the foreign-born population - Eritrea (%)
Place of birth for the foreign-born population - Ethiopia (%)
Place of birth for the foreign-born population - Kenya (%)
Place of birth for the foreign-born population - Somalia (%)
Place of birth for the foreign-born population - Uganda (%)
Place of birth for the foreign-born population - Zimbabwe (%)
Place of birth for the foreign-born population - Other Eastern Africa (%)
Place of birth for the foreign-born population - Cameroon (%)
Place of birth for the foreign-born population - Congo (%)
Place of birth for the foreign-born population - Democratic Republic of Congo (Zaire) (%)
Place of birth for the foreign-born population - Other Middle Africa (%)
Place of birth for the foreign-born population - Egypt (%)
Place of birth for the foreign-born population - Morocco (%)
Place of birth for the foreign-born population - Sudan (%)
Place of birth for the foreign-born population - Other Northern Africa (%)
Place of birth for the foreign-born population - South Africa (%)
Place of birth for the foreign-born population - Other Southern Africa (%)
Place of birth for the foreign-born population - Cabo Verde (%)
Place of birth for the foreign-born population - Ghana (%)
Place of birth for the foreign-born population - Liberia (%)
Place of birth for the foreign-born population - Nigeria (%)
Place of birth for the foreign-born population - Senegal (%)
Place of birth for the foreign-born population - Sierra Leone (%)
Place of birth for the foreign-born population - Other Western Africa (%)
Place of birth for the foreign-born population - Australia (%)
Place of birth for the foreign-born population - New Zealand (%)
Place of birth for the foreign-born population - Fiji (%)
Place of birth for the foreign-born population - Micronesia (%)
Place of birth for the foreign-born population - Bahamas (%)
Place of birth for the foreign-born population - Barbados (%)
Place of birth for the foreign-born population - Cuba (%)
Place of birth for the foreign-born population - Dominica (%)
Place of birth for the foreign-born population - Dominican Republic (%)
Place of birth for the foreign-born population - Grenada (%)
Place of birth for the foreign-born population - Haiti (%)
Place of birth for the foreign-born population - Jamaica (%)
Place of birth for the foreign-born population - St. Vincent and the Grenadines (%)
Place of birth for the foreign-born population - Trinidad and Tobago (%)
Place of birth for the foreign-born population - West Indies (%)
Place of birth for the foreign-born population - Other Caribbean (%)
Place of birth for the foreign-born population - Belize (%)
Place of birth for the foreign-born population - Costa Rica (%)
Place of birth for the foreign-born population - El Salvador (%)
Place of birth for the foreign-born population - Guatemala (%)
Place of birth for the foreign-born population - Honduras (%)
Place of birth for the foreign-born population - Mexico (%)
Place of birth for the foreign-born population - Nicaragua (%)
Place of birth for the foreign-born population - Panama (%)
Place of birth for the foreign-born population - Other Central America (%)
Place of birth for the foreign-born population - Argentina (%)
Place of birth for the foreign-born population - Bolivia (%)
Place of birth for the foreign-born population - Brazil (%)
Place of birth for the foreign-born population - Chile (%)
Place of birth for the foreign-born population - Colombia (%)
Place of birth for the foreign-born population - Ecuador (%)
Place of birth for the foreign-born population - Guyana (%)
Place of birth for the foreign-born population - Peru (%)
Place of birth for the foreign-born population - Uruguay (%)
Place of birth for the foreign-born population - Venezuela (%)
Place of birth for the foreign-born population - Other South America (%)
Place of birth for the foreign-born population - Canada (%)
Place of birth for the foreign-born population - Other Northern America (%)
Place of birth for the foreign-born population - Other (%)
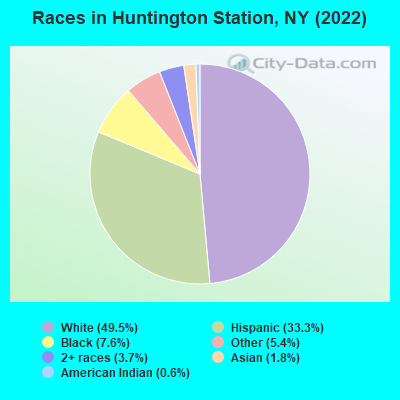
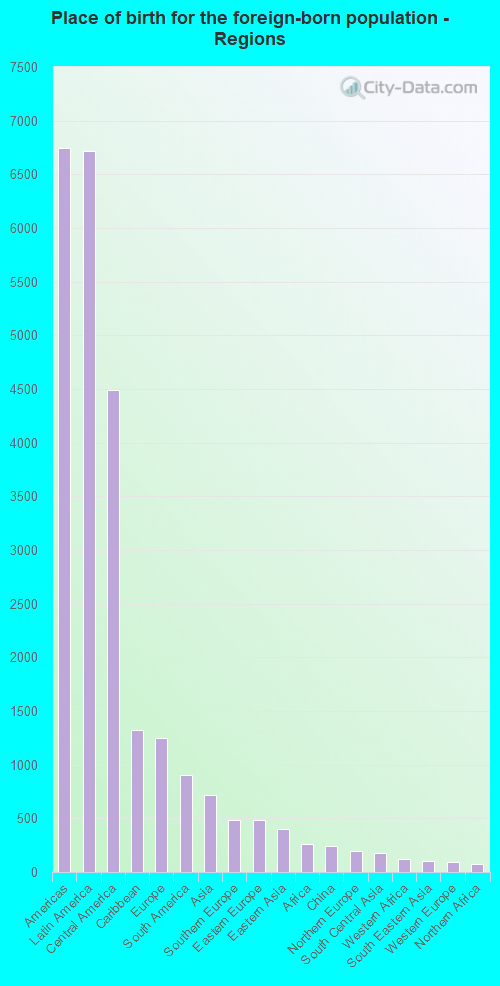
According to 2022 data, the most numerous races in Huntington Station, NY are White alone (17,144 residents), Hispanic (11,513 residents), and Black alone (2,640 residents). 58.9% of Huntington Station residents speak English at home. 25.9% of Huntington Station, NY residents are foreign-born (19.6% born in Latin America, 3.7% born in Europe), which is 15.2% greater than the foreign-born rate of 22.0% across the entire state of New York.
Race distribution in Huntington Station
2000 2022
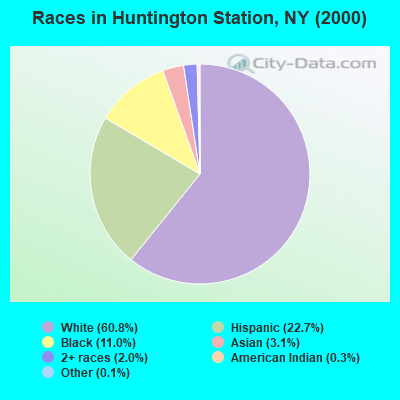
11,760,981 62.0% White alone 2,867,583 15.1% Hispanic 2,812,623 14.8% Black alone 1,035,926 5.5% Asian alone 366,116 1.9% Two or more races 75,499 0.4% Other race alone 52,499 0.3% American Indian alone 5,230 0.03% Native Hawaiian and Other
10,408,933 52.9% White alone 3,867,299 19.7% Hispanic 2,633,840 13.4% Black alone 1,776,286 9.0% Asian alone 732,670 3.7% Two or more races 216,110 1.1% Other race alone 35,082 0.2% American Indian alone 6,931 0.04% Native Hawaiian and Other
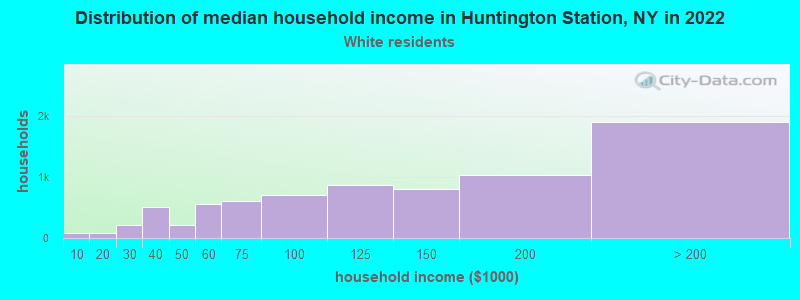
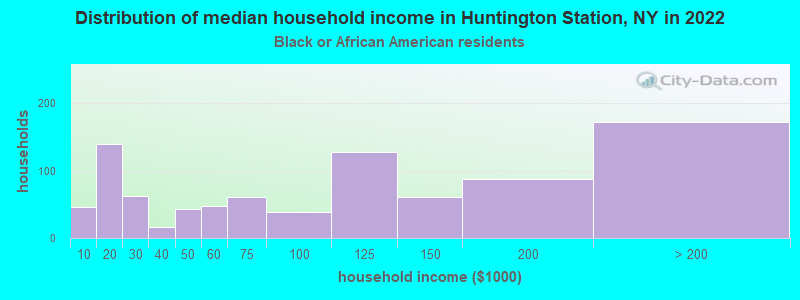
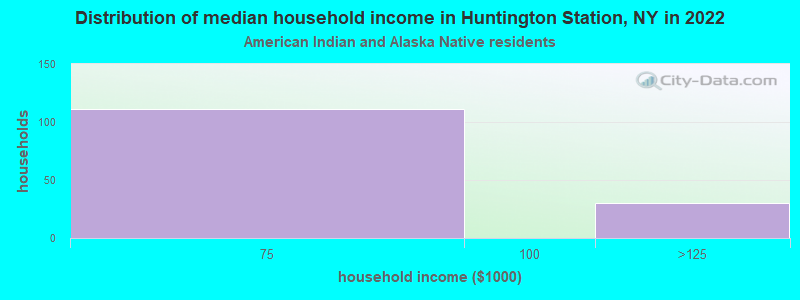
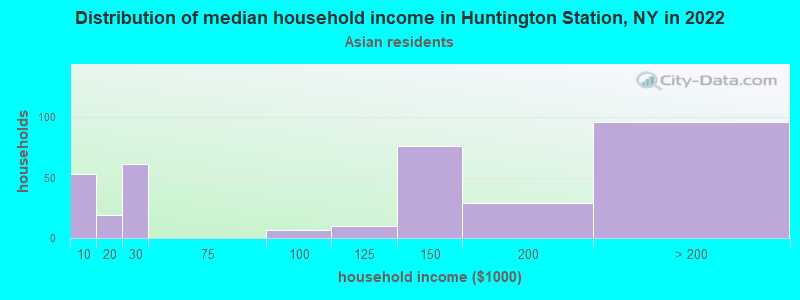
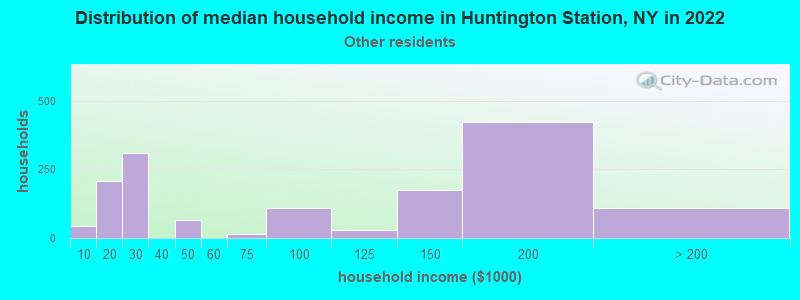
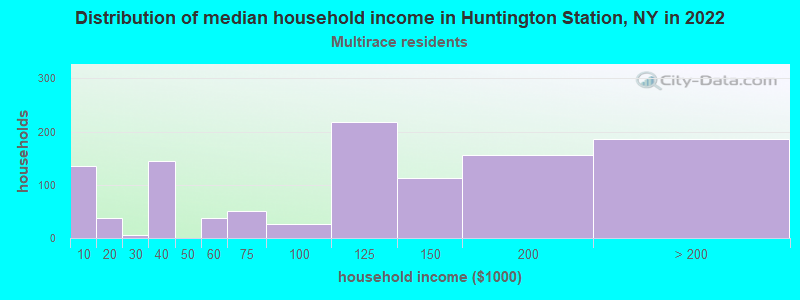
Income and house value in Huntington Station Median household income in 2022 $130,588 White non-Hispanic householders$108,020 Black householders$52,715 American Indian and Alaska Native householders$123,932 Asian householders$87,323 Some other race householders$114,948 Two or more races householders$107,452 Hispanic or Latino race householdersMedian 2022 house value $548,712 White Non-Hispanic householders$497,621 Black or African American householders$471,927 American Indian or Alaska Native householders $559,343 Asian householders$447,120 Some other race householders$494,077 Two or more races householders$482,559 Hispanic or Latino householders
Median age by race in Huntington Station
47.0 Median age for White residents43.1 48.8 37.7 Median age for Black or African American residents37.4 37.8 37.1 Median age for American Indian / Alaska Native residents40.2 14.6 58.4 Median age for Asian residents58.5 60.5 -742,816,091.2 Median age for Native Hawaiian / Pacific Islander residents-831,187,409.8 -771,300,447.7 34.5 Median age for Other race residents34.4 33.6 32.0 Median age for Two or more races residents36.7 28.6 49.6 Median age for White alone residents46.1 52.5 35.3 Median age for Hispanic or Latino residents37.4 31.5
Owner/renter occupied households by race in Huntington Station
House owners and renters - White residents 6,250 83.2% Owner occupied1,265 16.8% Renter occupiedHouse owners and renters - Black or African American residents 523 58.6% Owner occupied369 41.4% Renter occupiedHouse owners and renters - American Indian / Alaska Native residents 95 68.0% Owner occupied45 32.0% Renter occupiedHouse owners and renters - Asian residents 261 85.0% Owner occupied46 15.0% Renter occupiedHouse owners and renters - Other race residents 875 58.9% Owner occupied610 41.1% Renter occupiedHouse owners and renters - Two or more races residents 638 62.3% Owner occupied386 37.7% Renter occupiedHouse owners and renters - White alone residents 5,850 86.5% Owner occupied913 13.5% Renter occupiedHouse owners and renters - Hispanic or Latino residents 1,852 67.8% Owner occupied881 32.2% Renter occupied
Language usage in Huntington Station
English speakers - Total 58.9% of residents of Huntington Station speak English at home.
30.8% of residents speak Spanish at home 5,739 56.7% Speak English very well4,384 43.3% Speak English less than very well11.3% of residents speak other language at home 2,238 60.5% Speak English very well1,463 39.5% Speak English less than very well
English speakers - Born in the United States 89.1% of residents of Huntington Station speak English at home.
3.3% of residents speak Spanish at home 80 100.0% Speak English very well9.6% of residents speak other language at home 73 31.7% Speak English very well157 68.3% Speak English less than very well
English speakers - Native, born elsewhere 16.4% of residents of Huntington Station speak English at home.
70.4% of residents speak Spanish at home 345 81.4% Speak English very well79 18.6% Speak English less than very well3.5% of residents speak other language at home 12 57.1% Speak English very well9 42.9% Speak English less than very well
English speakers - Foreign-born 10.9% of residents of Huntington Station speak English at home.
66.3% of residents speak Spanish at home 2,261 35.2% Speak English very well4,158 64.8% Speak English less than very well23.8% of residents speak other language at home 1,351 58.6% Speak English very well954 41.4% Speak English less than very well
White (Caucasian) - Speak only English Native:
86.0% (14,417)Foreign-born:
29.1% (516)
White (Caucasian) - Speak another language Native:
11.6% (1,952)Foreign-born:
70.7% (1,254)
Black or African American - Speak only English Native:
82.5% (1,811)Foreign-born:
8.5% (60)
Black or African American - Speak another language Native:
19.5% (429)Foreign-born:
82.4% (580)
American Indian / Alaska Native - Speak another language Native:
12.1% (55)Foreign-born:
100.0% (763)
Asian - Speak only English Native:
28.9% (104)Foreign-born:
3.7% (19)
Asian - Speak another language Native:
74.1% (266)Foreign-born:
100.0% (509)
Other race - Speak only English Native:
23.8% (451)Foreign-born:
2.7% (139)
Other race - Speak another language Native:
74.4% (1,411)Foreign-born:
98.3% (5,041)
Two or more races - Speak only English Native:
56.9% (1,250)Foreign-born:
17.3% (363)
Two or more races - Speak another language Native:
42.8% (940)Foreign-born:
82.1% (1,725)
White alone - Speak only English Native:
92.9% (14,089)Foreign-born:
37.6% (499)
White alone - Speak another language Native:
7.4% (1,115)Foreign-born:
62.4% (827)
Hispanic or Latino - Speak only English Native:
29.1% (1,452)Foreign-born:
6.2% (385)
Hispanic or Latino - Speak another language Native:
69.6% (3,474)Foreign-born:
93.9% (5,828)
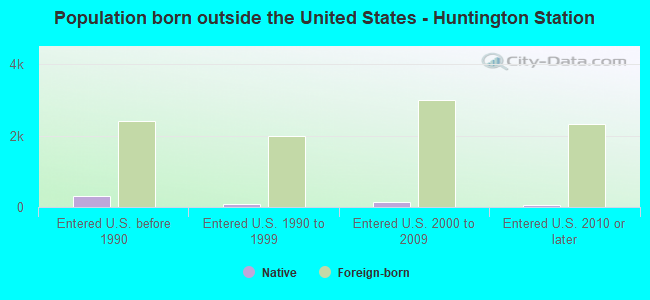
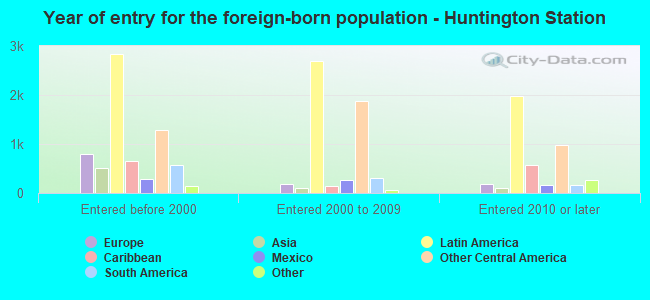
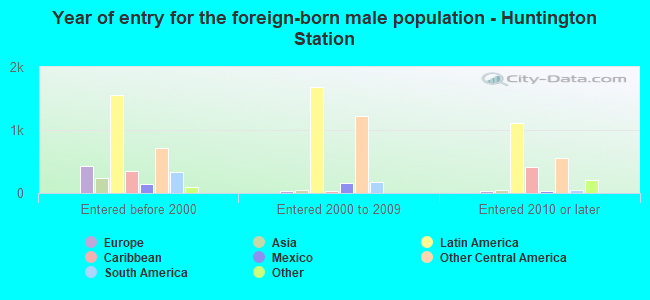
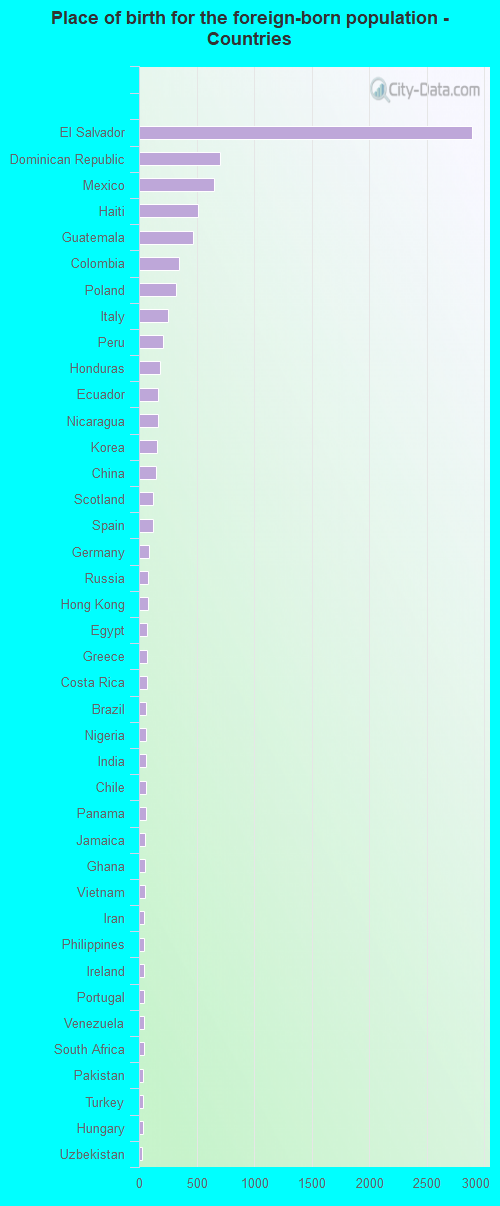
Foreign-born residents in Huntington Station 8,981 residents are foreign born (19.6% Latin America , 3.7% Europe ).
This city:
25.9%New York:
22.6%
Marital status for residents in Huntington Station Marital status - White (Caucasian) population 15 years and over
Males 35.0% Never married53.1% Now married0.8% Separated2.8% Widowed8.3% DivorcedFemales 28.9% Never married47.4% Now married2.4% Separated6.8% Widowed14.5% DivorcedWomen who gave birth in the past 12 months Now married:
100.0% (120)Unmarried:
0.0% (0)
Women who did not give birth in the past 12 months Now married:
44.8% (1,741)Unmarried:
55.2% (2,148)
Marital status - Black or African American population 15 years and over
Males 30.4% Never married57.6% Now married1.8% Separated8.0% Widowed2.2% DivorcedFemales 38.0% Never married37.0% Now married3.5% Separated17.2% Widowed4.3% DivorcedWomen who gave birth in the past 12 months Now married:
100.0% (130)Unmarried:
0.0% (0)
Women who did not give birth in the past 12 months Now married:
19.9% (105)Unmarried:
80.1% (425)
Marital status - American Indian / Alaska Native population 15 years and over
Males 57.7% Never married28.1% Now married0.0% Separated0.0% Widowed14.2% DivorcedFemales 51.3% Never married27.6% Now married0.0% Separated6.1% Widowed14.9% DivorcedWomen who did not give birth in the past 12 months Now married:
29.8% (82)Unmarried:
70.2% (192)
Marital status - Asian population 15 years and over
Males 43.2% Never married56.8% Now married0.0% Separated0.0% Widowed0.0% DivorcedFemales 19.3% Never married77.4% Now married0.0% Separated3.3% Widowed0.0% DivorcedWomen who gave birth in the past 12 months Now married:
100.0% (7)Unmarried:
0.0% (0)
Women who did not give birth in the past 12 months Now married:
40.3% (50)Unmarried:
59.7% (74)
Marital status - Other race population 15 years and over
Males 48.5% Never married44.4% Now married5.5% Separated0.0% Widowed1.6% DivorcedFemales 34.3% Never married51.7% Now married5.9% Separated0.0% Widowed8.2% DivorcedWomen who gave birth in the past 12 months Now married:
100.0% (39)Unmarried:
0.0% (0)
Women who did not give birth in the past 12 months Now married:
53.6% (850)Unmarried:
46.4% (735)
Marital status - Two or more races population 15 years and over
Males 52.5% Never married37.3% Now married1.7% Separated1.3% Widowed7.3% DivorcedFemales 44.2% Never married38.1% Now married0.0% Separated1.8% Widowed16.0% DivorcedWomen who gave birth in the past 12 months Now married:
100.0% (45)Unmarried:
0.0% (0)
Women who did not give birth in the past 12 months Now married:
29.5% (353)Unmarried:
70.5% (843)
Marital status - White alone, not Hispanic / Latino population 15 years and over
Males 33.9% Never married54.5% Now married0.1% Separated3.2% Widowed8.3% DivorcedFemales 24.5% Never married49.0% Now married2.2% Separated7.6% Widowed16.7% DivorcedWomen who gave birth in the past 12 months Now married:
100.0% (124)Unmarried:
0.0% (0)
Women who did not give birth in the past 12 months Now married:
48.7% (1,459)Unmarried:
51.3% (1,536)
Marital status - Hispanic or Latino population 15 years and over
Males 44.4% Never married43.6% Now married4.6% Separated1.6% Widowed5.8% DivorcedFemales 43.5% Never married40.4% Now married3.6% Separated4.1% Widowed8.4% DivorcedWomen who gave birth in the past 12 months Now married:
100.0% (119)Unmarried:
0.0% (0)
Women who did not give birth in the past 12 months Now married:
35.5% (1,043)Unmarried:
64.5% (1,891)
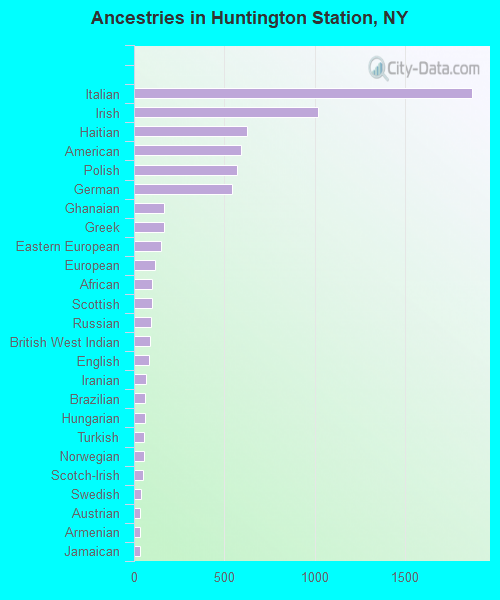
Ancestries in Huntington Station
1,873 11.3% Italian1,020 6.1% Irish626 3.8% Haitian593 3.6% American570 3.4% Polish544 3.3% German168 1.0% Ghanaian168 1.0% Greek152 0.9% Eastern European114 0.7% European99 0.6% African99 0.6% Scottish96 0.6% Russian88 0.5% British West Indian85 0.5% English64 0.4% Iranian61 0.4% Brazilian61 0.4% Hungarian56 0.3% Turkish54 0.3% Norwegian48 0.3% Scotch-Irish39 0.2% Swedish36 0.2% Austrian34 0.2% Armenian31 0.2% Jamaican26 0.2% West Indian25 0.2% Scandinavian18 0.1% Swiss13 0.08% Portuguese13 0.08% Ukrainian12 0.07% Dutch12 0.07% Albanian9 0.05% French Canadian9 0.05% Trinidadian and Tobagonian8 0.05% French7 0.04% British6 0.04% Northern European6 0.04% Welsh5 0.03% Danish5 0.03% Romanian
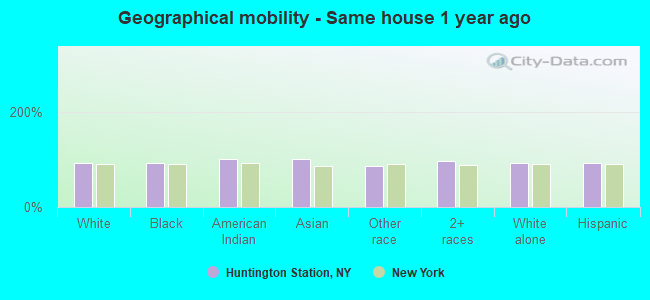
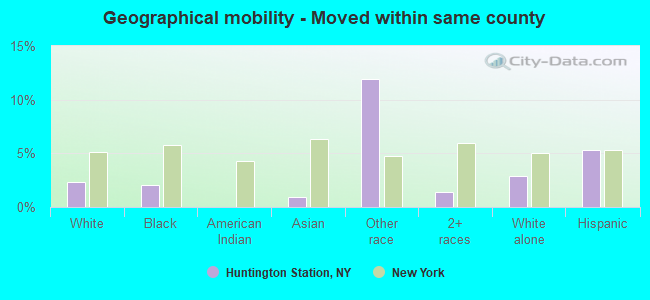
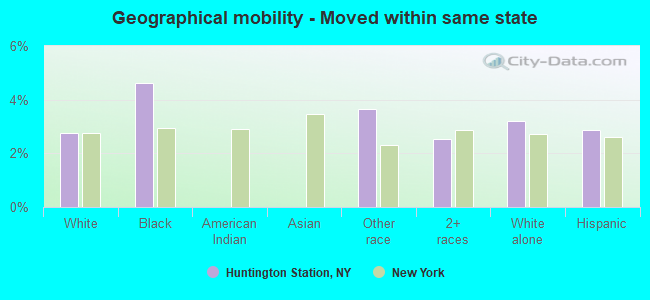
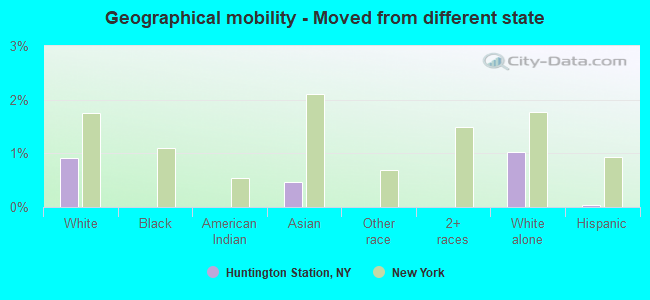
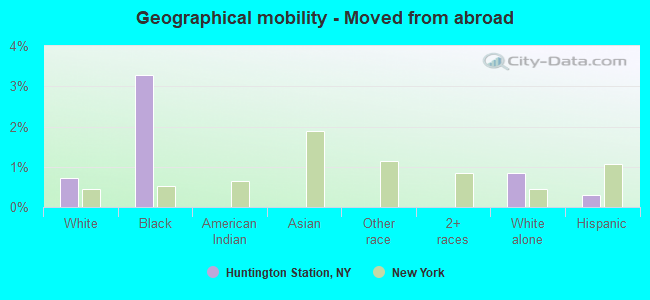
Geographical mobility in Huntington Station Same house 1 year ago 17,991 93.2% White (Caucasian)2,920 91.9% Black or African American962 100.0% American Indian / Alaska Native871 99.7% Asian6,371 85.3% Other race4,297 96.3% Two or more races15,659 92.0% White alone, not Hispanic / Latino10,495 91.6% Hispanic or LatinoMoved within same county 448 2.3% White / Caucasian65 2.0% Black or African American8 0.9% Asian892 11.9% Other race61 1.4% Two or more races487 2.9% White alone, not Hispanic / Latino603 5.3% Hispanic or LatinoMoved within same state 533 2.8% White / Caucasian146 4.6% Black or African American273 3.7% Other race113 2.5% Two or more races544 3.2% White alone, not Hispanic / Latino330 2.9% Hispanic or LatinoMoved from different state 175 0.9% White / Caucasian4 0.5% Asian176 1.0% White alone, not Hispanic / Latino5 0.0% Hispanic or LatinoMoved from abroad 140 0.7% White104 3.3% Black or African American145 0.9% White alone, not Hispanic / Latino34 0.3% Hispanic or Latino
Children Nativity (place of birth) in Huntington Station
Children under 6 years - Living with two parents Both parents native 911 100.0% NativeBoth parents foreign-born 487 100.0% NativeOne native, one foreign-born parent 201 100.0% NativeChildren under 6 years - Living with one parent Native parent 112 97.2% Native3 2.8% Foreign-bornForeign-born parent 214 88.4% Native28 11.6% Foreign-bornChildren 6 to 17 years - Living with two parents Both parents native 1,403 100.0% Native0 0.0% Foreign-bornBoth parents foreign-born 1,197 98.0% Native24 2.0% Foreign-bornOne native, one foreign-born parent 413 100.0% NativeChildren 6 to 17 years - Living with one parent Native parent 316 63.6% Native181 36.4% Foreign-bornForeign-born parent 709 71.5% Native282 28.5% Foreign-born
Grandparents responsible for own grandchildren in Huntington Station
Grandparents (30 to 59 years) White / Caucasian 80 100.0% Not responsible for grandchildrenOther race 12 37.3% Responsible for grandchildren20 62.7% Not responsible for grandchildrenTwo or more races 349 100.0% Not responsible for grandchildrenWhite alone, not Hispanic / Latino 74 100.0% Not responsible for grandchildrenHispanic or Latino 14 6.7% Responsible for grandchildren189 93.3% Not responsible for grandchildrenGrandparents (60 years and over) White / Caucasian 219 100.0% Not responsible for grandchildrenOther race 102 100.0% Not responsible for grandchildrenWhite alone, not Hispanic / Latino 213 100.0% Not responsible for grandchildrenHispanic or Latino 53 17.8% Responsible for grandchildren244 82.2% Not responsible for grandchildren