Races in Idabel, Oklahoma (OK) Detailed Stats
Ancestries, Foreign-born residents, place of birth
Settings
X


Recent posts about races in Idabel, Oklahoma on our local forum with over 2,400,000 registered users:
 | Oklahoma Weather Thread (860 replies) |
| SE Oklahoma compared to East Tennessee (41 replies) |
| What's it like living in Oklahoma in 2022? (13 replies) |
| Should Oklahoma be a midwest state, southern state, or both? (604 replies) |
| Tell me about living in southeast Oklahoma (85 replies) |
| Oklahoma's Regional Idenity (129 replies) |
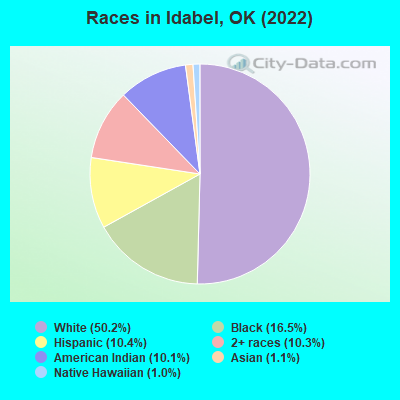
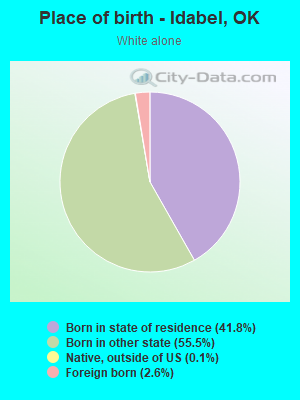
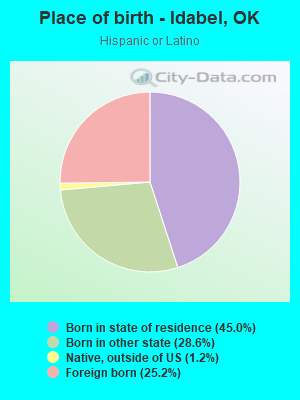
According to 2022 data, the most numerous races in Idabel, OK are White alone (3,552 residents), Hispanic (737 residents), and Two or more races (730 residents). 89.9% of Idabel residents speak English at home. 5.1% of Idabel, OK residents are foreign-born (2.6% born in Latin America, 1.3% born in Europe, 0.8% born in Asia), which is 17.0% less than the foreign-born rate of 6.0% across the entire state of Oklahoma.
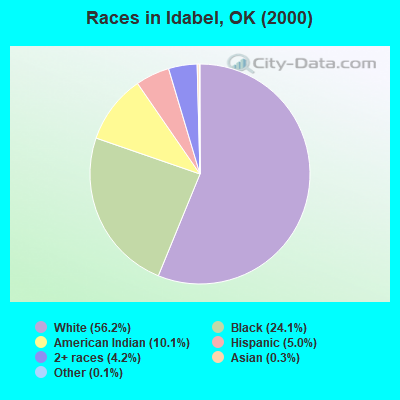
Race distribution in Idabel
2000
2022

- 3,90856.2%White alone
- 1,67824.1%Black alone
- 70210.1%American Indian alone
- 3455.0%Hispanic
- 2894.2%Two or more races
- 210.3%Asian alone
- 80.1%Other race alone
- 10.01%Native Hawaiian and Other
Pacific Islander alone
-
- 3,55250.2%White alone
- 1,16716.5%Black alone
- 73710.4%Hispanic
- 73010.3%Two or more races
- 71610.1%American Indian alone
- 761.1%Asian alone
- 681.0%Native Hawaiian and Other
Pacific Islander alone - 40.06%Other race alone
2000
2022
-
- 2,556,36874.1%White alone
- 266,1587.7%American Indian alone
- 257,9817.5%Black alone
- 179,3045.2%Hispanic
- 140,2494.1%Two or more races
- 46,1721.3%Asian alone
- 2,3220.07%Other race alone
- 2,1000.06%Native Hawaiian and Other
Pacific Islander alone

-
- 2,517,40362.6%White alone
- 486,69212.1%Hispanic
- 364,4539.1%Two or more races
- 273,6506.8%American Indian alone
- 268,5436.7%Black alone
- 92,6722.3%Asian alone
- 10,7860.3%Other race alone
- 5,6010.1%Native Hawaiian and Other
Pacific Islander alone

Income and house value in Idabel
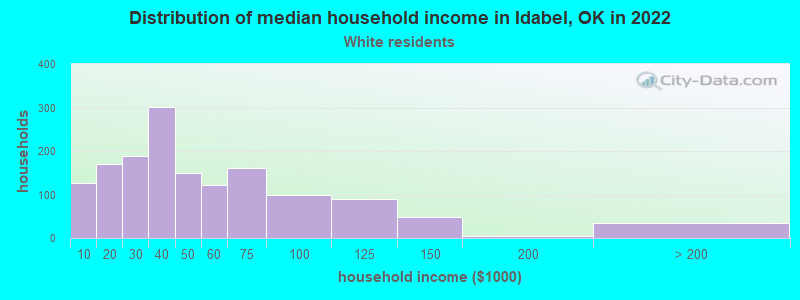
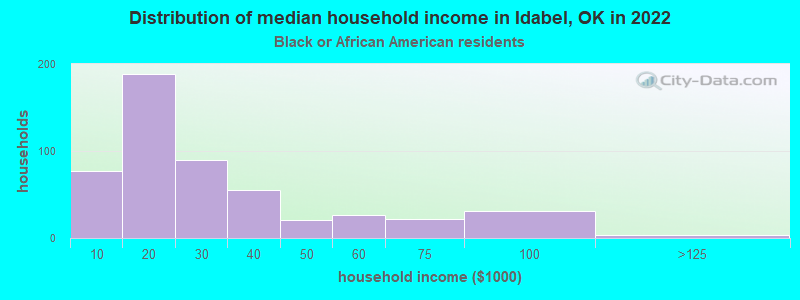
- Median household income in 2022
- $37,214White non-Hispanic householders
- $18,368Black householders
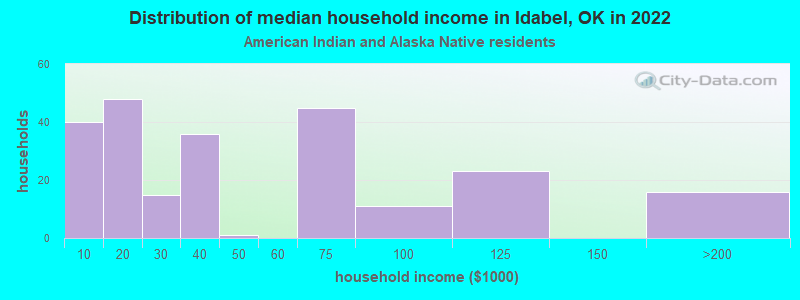
- $34,635American Indian and Alaska Native householders
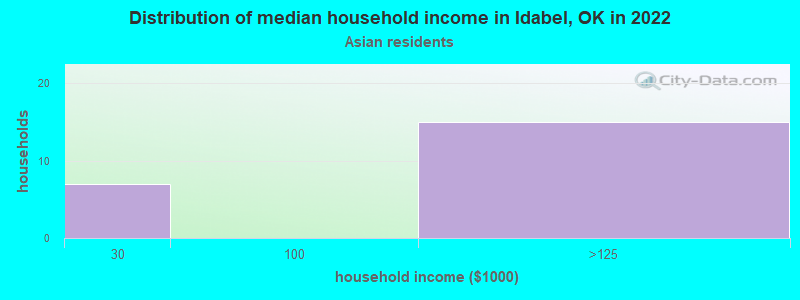
- $102,008Asian householders
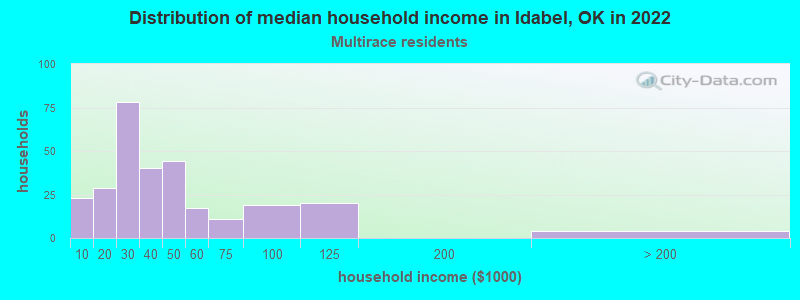
- $30,561Two or more races householders
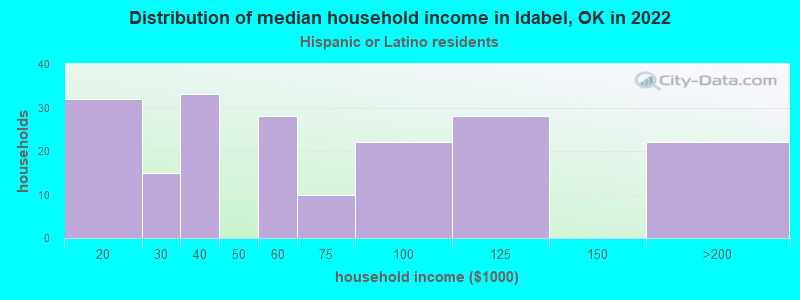
- $50,630Hispanic or Latino race householders
- Median 2022 house value
- $107,657White Non-Hispanic householders
- $74,464Black or African American householders
- $69,005American Indian or Alaska Native householders
- $70,970Asian householders
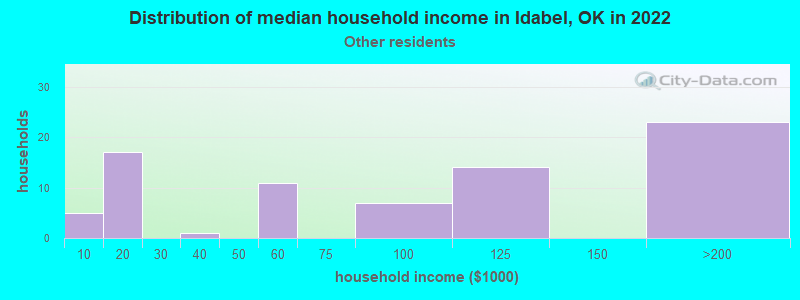
- $100,014Some other race householders
- $76,211Two or more races householders
- $82,762Hispanic or Latino householders
Household income for White non-Hispanic householders
Household income for Black householders
Household income for American Indian and Alaska Native householders
Household income for Asian householders
Household income for Some other race householders
Household income for Two or more races householders
Household income for Hispanic or Latino race householders
Median age by race in Idabel
- 39.2Median age for White residents
- 37.8Males
- 40.6Females
- 34.1Median age for Black or African American residents
- 42.1Males
- 33.0Females
- 28.4Median age for American Indian / Alaska Native residents
- 22.7Males
- 36.3Females
- 35.0Median age for Asian residents
- 34.7Males
- 41.8Females
- 6.0Median age for Native Hawaiian / Pacific Islander residents
- -675,324,674.6Males
- 5.8Females
- 31.5Median age for Other race residents
- 31.4Males
- 24.6Females
- 15.4Median age for Two or more races residents
- 14.6Males
- 18.5Females
- 38.7Median age for White alone residents
- 37.6Males
- 40.1Females
- 20.3Median age for Hispanic or Latino residents
- 22.0Males
- 16.8Females
Owner/renter occupied households by race in Idabel
- House owners and renters - White residents
- 89360.0%Owner occupied
- 59540.0%Renter occupied
- House owners and renters - Black or African American residents
- 19938.0%Owner occupied
- 32562.0%Renter occupied
- House owners and renters - American Indian / Alaska Native residents
- 8537.1%Owner occupied
- 14362.9%Renter occupied
- House owners and renters - Asian residents
- 1247.7%Owner occupied
- 1352.3%Renter occupied
- House owners and renters - Native Hawaiian / Pacific Islander residents
- 12100.0%Renter occupied
- House owners and renters - Other race residents
- 4052.3%Owner occupied
- 3747.7%Renter occupied
- House owners and renters - Two or more races residents
- 13847.1%Owner occupied
- 15452.9%Renter occupied
- House owners and renters - White alone residents
- 86859.2%Owner occupied
- 59940.8%Renter occupied
- House owners and renters - Hispanic or Latino residents
- 11560.2%Owner occupied
- 7639.8%Renter occupied
Language usage in Idabel
- English speakers - Total
- 89.9% of residents of Idabel speak English at home.
- 5.8% of residents speak Spanish at home
- 20555.4%Speak English very well
- 16544.6%Speak English less than very well
- 4.2% of residents speak other language at home
- 19172.3%Speak English very well
- 7327.7%Speak English less than very well
- English speakers - Born in the United States
- 95.5% of residents of Idabel speak English at home.
- 1.8% of residents speak Spanish at home
- 4075.5%Speak English very well
- 1324.5%Speak English less than very well
- 2.5% of residents speak other language at home
- 6994.5%Speak English very well
- 45.5%Speak English less than very well
All residents speak only English at home
- English speakers - Foreign-born
- 5.0% of residents of Idabel speak English at home.
- 49.7% of residents speak Spanish at home
- 3217.8%Speak English very well
- 14882.2%Speak English less than very well
- 45.0% of residents speak other language at home
- 9558.3%Speak English very well
- 6841.7%Speak English less than very well
White (Caucasian) - Speak only English
| Native: | 99.1% (3,119) |
| Foreign-born: | 7.8% (5) |
White (Caucasian) - Speak another language
| Native: | 1.4% (43) |
| Foreign-born: | 79.6% (56) |
Native Hawaiian / Pacific Islander - Speak only English
| Native: | 100.0% (17) |
| Foreign-born: | 33.1% (9) |
Other race - Speak another language
| Native: | 59.4% (60) |
| Foreign-born: | 100.0% (118) |
Two or more races - Speak another language
| Native: | 17.5% (166) |
| Foreign-born: | 100.0% (91) |
White alone - Speak only English
| Native: | 98.4% (3,095) |
| Foreign-born: | 6.3% (6) |
White alone - Speak another language
| Native: | 1.6% (50) |
| Foreign-born: | 90.9% (84) |
Hispanic or Latino - Speak another language
| Native: | 40.3% (173) |
| Foreign-born: | 99.4% (185) |
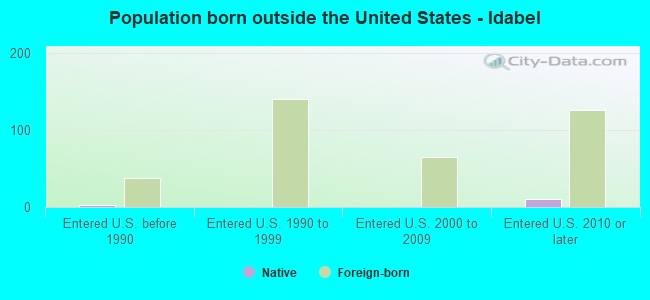
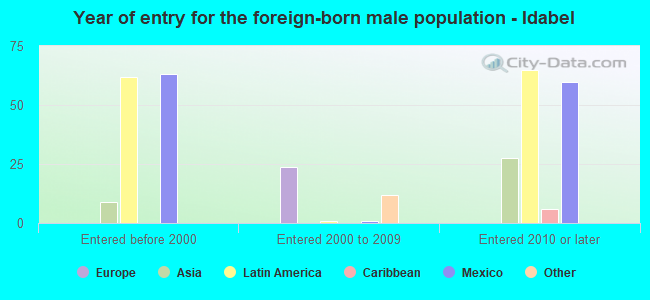
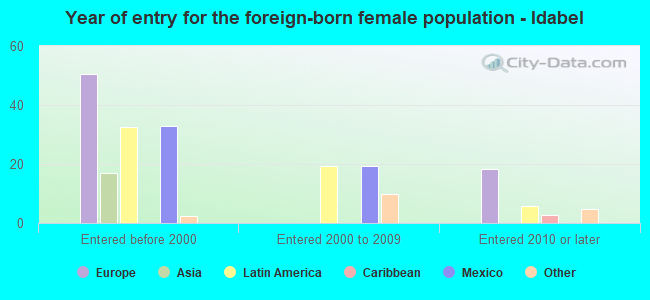
Foreign-born residents in Idabel
363 residents are foreign born (2.6% Latin America, 1.3% Europe, 0.8% Asia).
| This city: | 5.1% |
| Oklahoma: | 6.1% |
Marital status for residents in Idabel
Marital status - White (Caucasian) population 15 years and over
- Males
- 32.6%Never married
- 47.5%Now married
- 2.3%Separated
- 7.4%Widowed
- 10.2%Divorced
- Females
- 20.4%Never married
- 41.6%Now married
- 3.9%Separated
- 15.8%Widowed
- 18.3%Divorced
Women who gave birth in the past 12 months
| Now married: | 81.4% (80) |
| Unmarried: | 18.6% (18) |
Women who did not give birth in the past 12 months
| Now married: | 47.0% (353) |
| Unmarried: | 53.0% (397) |
Marital status - Black or African American population 15 years and over
- Males
- 60.2%Never married
- 17.6%Now married
- 9.5%Separated
- 3.4%Widowed
- 9.3%Divorced
- Females
- 56.8%Never married
- 6.8%Now married
- 9.3%Separated
- 10.7%Widowed
- 16.5%Divorced
Women who gave birth in the past 12 months
| Now married: | 0.0% (0) |
| Unmarried: | 100.0% (21) |
Women who did not give birth in the past 12 months
| Now married: | 22.5% (58) |
| Unmarried: | 77.5% (200) |
Marital status - American Indian / Alaska Native population 15 years and over
- Males
- 49.7%Never married
- 31.4%Now married
- 4.7%Separated
- 0.0%Widowed
- 14.2%Divorced
- Females
- 42.0%Never married
- 36.7%Now married
- 0.0%Separated
- 15.4%Widowed
- 5.9%Divorced
Women who gave birth in the past 12 months
| Now married: | 0.0% (0) |
| Unmarried: | 100.0% (6) |
Women who did not give birth in the past 12 months
| Now married: | 33.5% (64) |
| Unmarried: | 66.5% (127) |
Marital status - Asian population 15 years and over
- Males
- 44.7%Never married
- 55.3%Now married
- 0.0%Separated
- 0.0%Widowed
- 0.0%Divorced
- Females
- 0.0%Never married
- 42.1%Now married
- 0.0%Separated
- 26.3%Widowed
- 31.6%Divorced
Women who did not give birth in the past 12 months
| Now married: | 0.0% (0) |
| Unmarried: | 100.0% (6) |
Marital status - Native Hawaiian / Pacific Islander population 15 years and over
- Males
- 0.0%Never married
- 100.0%Now married
- 0.0%Separated
- 0.0%Widowed
- 0.0%Divorced
- Females
- 0.0%Never married
- 100.0%Now married
- 0.0%Separated
- 0.0%Widowed
- 0.0%Divorced
Women who did not give birth in the past 12 months
| Now married: | 100.0% (7) |
| Unmarried: | 0.0% (0) |
Marital status - Other race population 15 years and over
- Males
- 41.6%Never married
- 58.4%Now married
- 0.0%Separated
- 0.0%Widowed
- 0.0%Divorced
- Females
- 46.7%Never married
- 40.0%Now married
- 4.4%Separated
- 0.0%Widowed
- 8.9%Divorced
Women who did not give birth in the past 12 months
| Now married: | 44.4% (23) |
| Unmarried: | 55.6% (29) |
Marital status - Two or more races population 15 years and over
- Males
- 45.8%Never married
- 54.2%Now married
- 0.0%Separated
- 0.0%Widowed
- 0.0%Divorced
- Females
- 38.2%Never married
- 30.2%Now married
- 5.6%Separated
- 15.3%Widowed
- 10.8%Divorced
Women who did not give birth in the past 12 months
| Now married: | 35.9% (105) |
| Unmarried: | 64.1% (188) |
Marital status - White alone, not Hispanic / Latino population 15 years and over
- Males
- 32.7%Never married
- 46.7%Now married
- 2.4%Separated
- 7.7%Widowed
- 10.6%Divorced
- Females
- 20.7%Never married
- 40.8%Now married
- 4.0%Separated
- 16.0%Widowed
- 18.5%Divorced
Women who gave birth in the past 12 months
| Now married: | 78.7% (70) |
| Unmarried: | 21.3% (19) |
Women who did not give birth in the past 12 months
| Now married: | 46.4% (355) |
| Unmarried: | 53.6% (411) |
Marital status - Hispanic or Latino population 15 years and over
- Males
- 37.2%Never married
- 62.8%Now married
- 0.0%Separated
- 0.0%Widowed
- 0.0%Divorced
- Females
- 37.3%Never married
- 51.9%Now married
- 1.3%Separated
- 9.5%Widowed
- 0.0%Divorced
Women who gave birth in the past 12 months
| Now married: | 100.0% (14) |
| Unmarried: | 0.0% (0) |
Women who did not give birth in the past 12 months
| Now married: | 54.6% (78) |
| Unmarried: | 45.4% (65) |
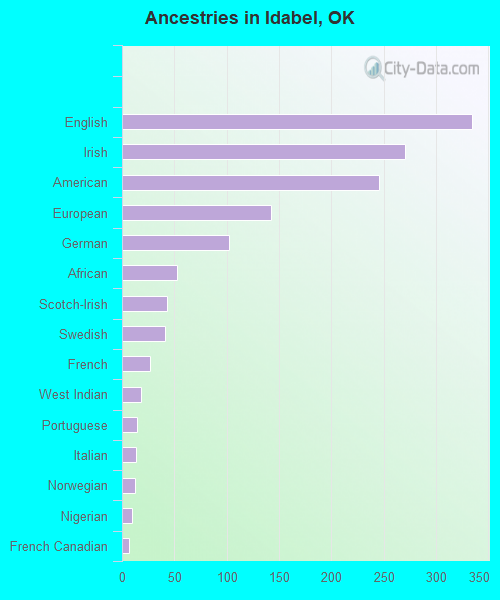
Ancestries in Idabel

- 3349.8%English
- 2707.9%Irish
- 2467.2%American
- 1424.2%European
- 1023.0%German
- 531.6%African
- 431.3%Scotch-Irish
- 411.2%Swedish
- 270.8%French
- 180.5%West Indian
- 140.4%Portuguese
- 130.4%Italian
- 120.4%Norwegian
- 100.3%Nigerian
- 70.2%French Canadian
- 30.09%Canadian
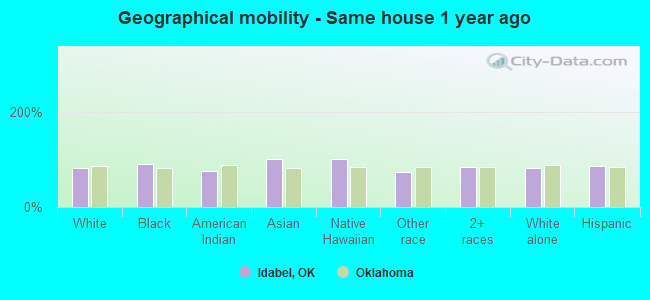
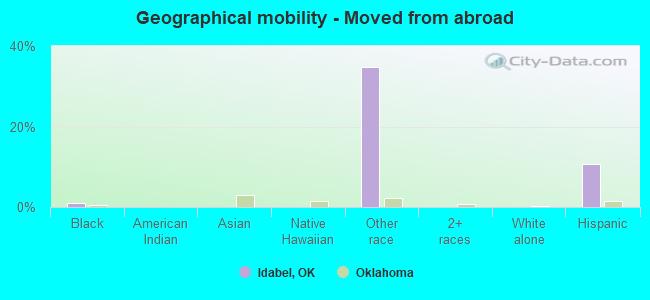
Geographical mobility in Idabel

- Same house 1 year ago
- 2,87982.3%White (Caucasian)
- 1,05091.4%Black or African American
- 61175.7%American Indian / Alaska Native
- 77100.0%Asian
- 90100.0%Native Hawaiian / Pacific Islander
- 15873.1%Other race
- 99583.5%Two or more races
- 2,89482.1%White alone, not Hispanic / Latino
- 61286.2%Hispanic or Latino
-
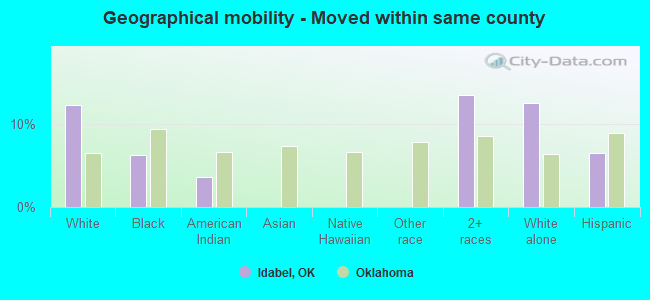
- Moved within same county
- 43212.3%White / Caucasian
- 736.3%Black or African American
- 293.6%American Indian / Alaska Native
- 16213.6%Two or more races
- 44212.5%White alone, not Hispanic / Latino
- 476.6%Hispanic or Latino
-
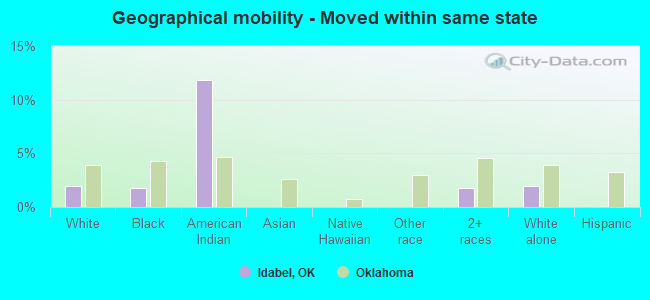
- Moved within same state
- 692.0%White / Caucasian
- 201.8%Black or African American
- 9511.8%American Indian / Alaska Native
- 211.7%Two or more races
- 702.0%White alone, not Hispanic / Latino
-
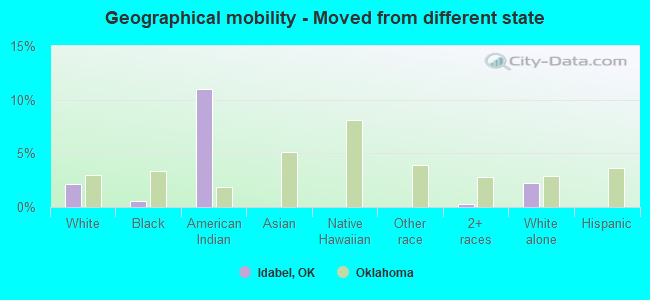
- Moved from different state
- 762.2%White / Caucasian
- 70.6%Black or African American
- 8811.0%American Indian / Alaska Native
- 40.3%Two or more races
- 802.3%White alone, not Hispanic / Latino
-
- Moved from abroad
- 100.9%Black or African American
- 7534.8%Other race
- 7510.6%Hispanic or Latino
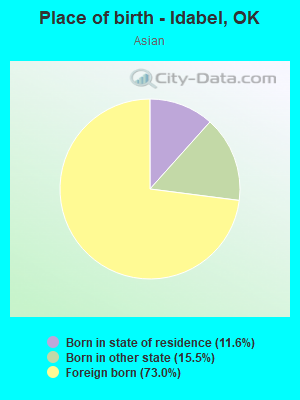
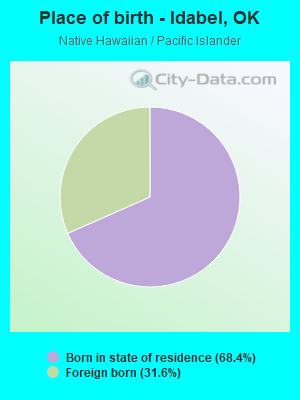
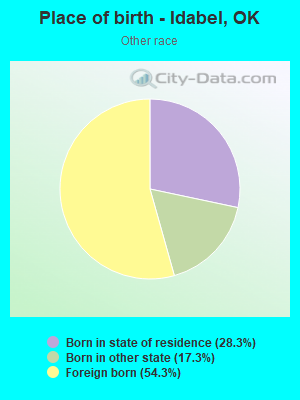
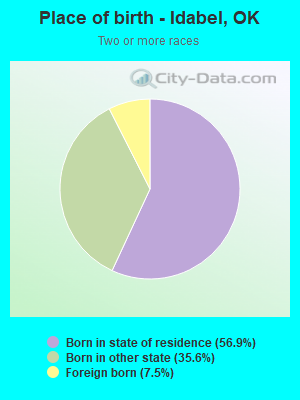
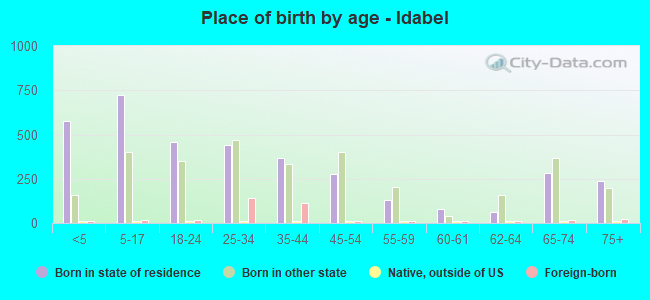
Children Nativity (place of birth) in Idabel
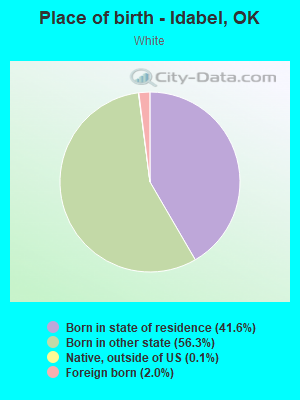
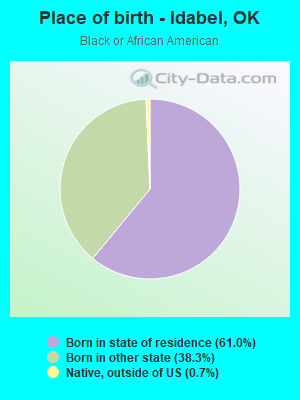
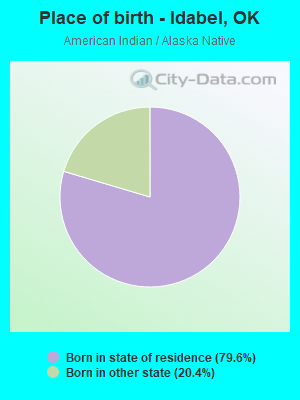
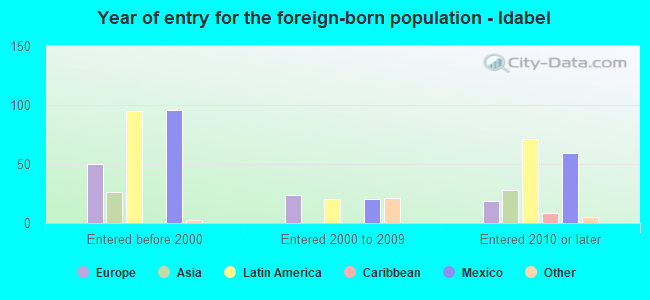
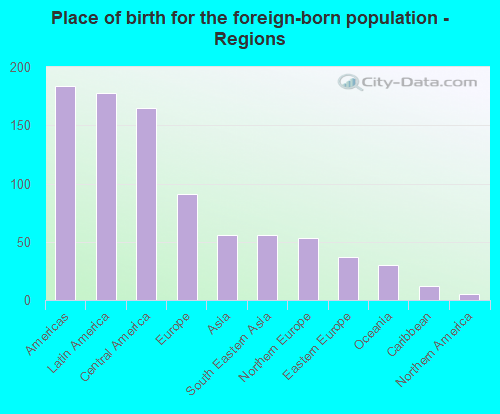
Place of birth for residents in Idabel
![Place of birth for the foreign-born population - Regions]()
- 184Americas
- 178Latin America
- 165Central America
- 91Europe
- 56Asia
- 56South Eastern Asia
- 53Northern Europe
- 37Eastern Europe
- 30Oceania
- 12Caribbean
- 5Northern America
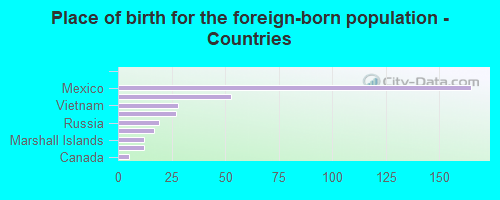
![Place of birth for the foreign-born population - Countries]()
- 165Mexico
- 53England
- 28Vietnam
- 27Philippines
- 19Russia
- 17Ukraine
- 12Marshall Islands
- 12Cuba
- 5Canada
Grandparents responsible for own grandchildren in Idabel
Zip codes: 74745.