Races in Independence, Missouri (MO) Detailed Stats
Data:
Races - White alone (%)
Races - White alone (% change since 2000)
Races - Black alone (%)
Races - Black alone (% change since 2000)
Races - American Indian alone (%)
Races - American Indian alone (% change since 2000)
Races - Asian alone (%)
Races - Asian alone (% change since 2000)
Races - Hispanic (%)
Races - Hispanic (% change since 2000)
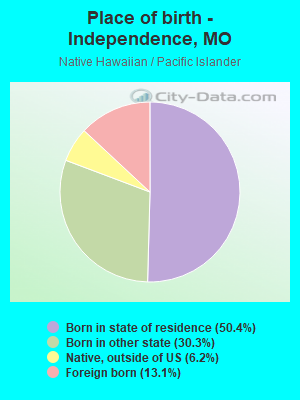
Races - Native Hawaiian and Other Pacific Islander alone (%)
Races - Native Hawaiian and Other Pacific Islander alone (% change since 2000)
Races - Two or more races(%)
Races - Two or more races(% change since 2000)
Races - Other race alone (%)
Races - Other race alone (% change since 2000)
Racial diversity
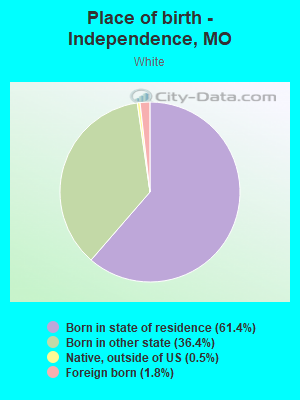
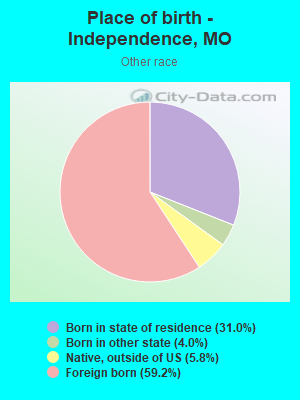
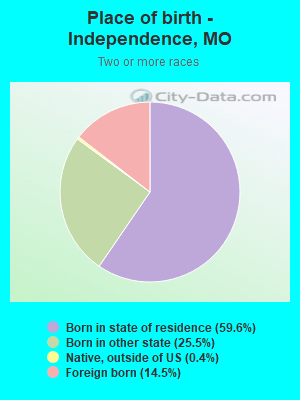
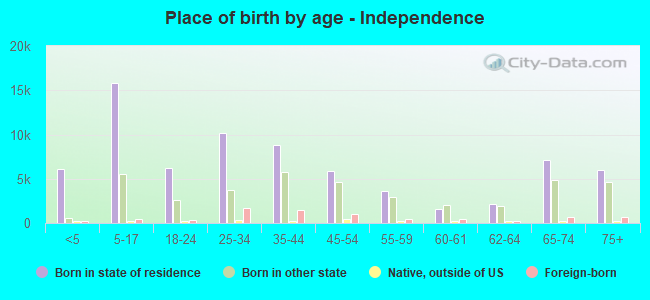
Place of birth - Born in state of residence (%)
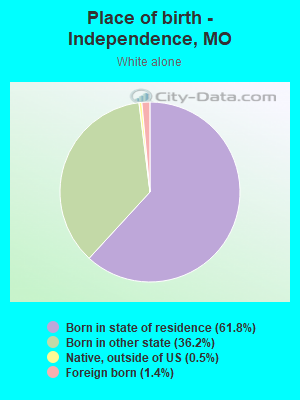
Place of birth - Born in state of residence (%) - White
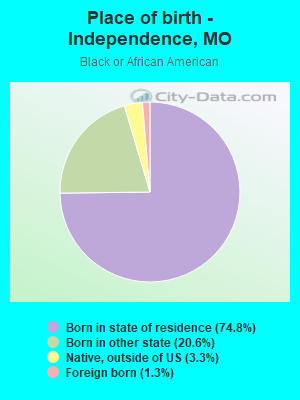
Place of birth - Born in state of residence (%) - Black or African American
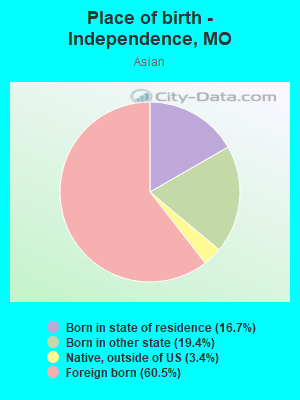
Place of birth - Born in state of residence (%) - Asian
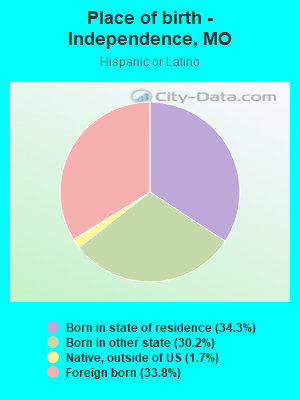
Place of birth - Born in state of residence (%) - Hispanic or Latino
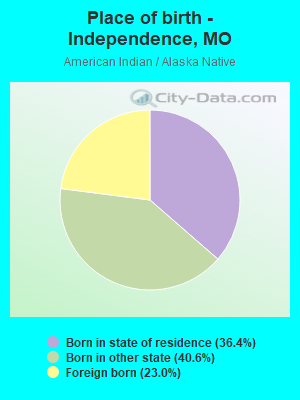
Place of birth - Born in state of residence (%) - American Indian and Alaska Native
Place of birth - Born in state of residence (%) - Multirace
Place of birth - Born in state of residence (%) - Other Race
Place of birth - Born in other state (%)
Place of birth - Born in other state (%) - White
Place of birth - Born in other state (%) - Black or African American
Place of birth - Born in other state (%) - Asian
Place of birth - Born in other state (%) - Hispanic or Latino
Place of birth - Born in other state (%) - American Indian and Alaska Native
Place of birth - Born in other state (%) - Multirace
Place of birth - Born in other state (%) - Other Race
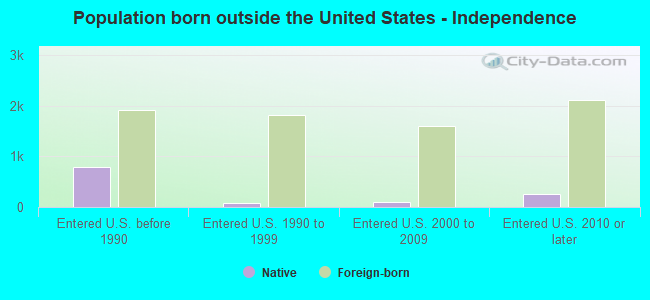
Place of birth - Native, outside of US (%)
Place of birth - Native, outside of US (%) - White
Place of birth - Native, outside of US (%) - Black or African American
Place of birth - Native, outside of US (%) - Asian
Place of birth - Native, outside of US (%) - Hispanic or Latino
Place of birth - Native, outside of US (%) - American Indian and Alaska Native
Place of birth - Native, outside of US (%) - Multirace
Place of birth - Native, outside of US (%) - Other Race
Place of birth - Foreign born (%)
Place of birth - Foreign born (%) - White
Place of birth - Foreign born (%) - Black or African American
Place of birth - Foreign born (%) - Asian
Place of birth - Foreign born (%) - Hispanic or Latino
Place of birth - Foreign born (%) - American Indian and Alaska Native
Place of birth - Foreign born (%) - Multirace
Place of birth - Foreign born (%) - Other Race
Residents speaking English at home (%)
Residents speaking English at home - Born in the United States (%)
Residents speaking English at home - Native, born elsewhere (%)
Residents speaking English at home - Foreign born (%)
Residents speaking Spanish at home (%)
Residents speaking Spanish at home - Born in the United States (%)
Residents speaking Spanish at home - Native, born elsewhere (%)
Residents speaking Spanish at home - Foreign born (%)
Residents speaking other language at home (%)
Residents speaking other language at home - Born in the United States (%)
Residents speaking other language at home - Native, born elsewhere (%)
Residents speaking other language at home - Foreign born (%)
Marital status - Never married (%)
Marital status - Now married (%)
Marital status - Separated (%)
Marital status - Widowed (%)
Marital status - Divorced (%)
Ancestries Reported - Arab (%)
Ancestries Reported - Czech (%)
Ancestries Reported - Danish (%)
Ancestries Reported - Dutch (%)
Ancestries Reported - English (%)
Ancestries Reported - French (%)
Ancestries Reported - French Canadian (%)
Ancestries Reported - German (%)
Ancestries Reported - Greek (%)
Ancestries Reported - Hungarian (%)
Ancestries Reported - Irish (%)
Ancestries Reported - Italian (%)
Ancestries Reported - Lithuanian (%)
Ancestries Reported - Norwegian (%)
Ancestries Reported - Polish (%)
Ancestries Reported - Portuguese (%)
Ancestries Reported - Russian (%)
Ancestries Reported - Scotch-Irish (%)
Ancestries Reported - Scottish (%)
Ancestries Reported - Slovak (%)
Ancestries Reported - Subsaharan African (%)
Ancestries Reported - Swedish (%)
Ancestries Reported - Swiss (%)
Ancestries Reported - Ukrainian (%)
Ancestries Reported - United States (%)
Ancestries Reported - Welsh (%)
Ancestries Reported - West Indian (%)
Ancestries Reported - Other (%)
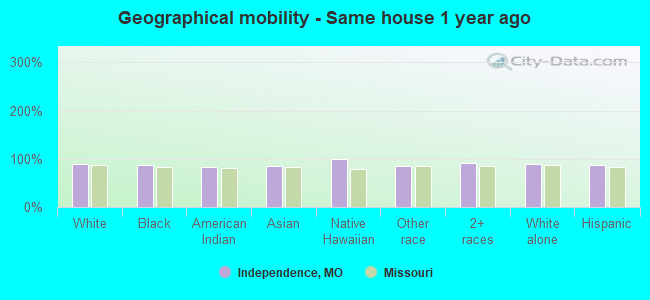
Geographical mobility - Same house 1 year ago (%)
Geographical mobility - Same house 1 year ago (%) - White
Geographical mobility - Same house 1 year ago (%) - Black or African American
Geographical mobility - Same house 1 year ago (%) - Asian
Geographical mobility - Same house 1 year ago (%) - Hispanic or Latino
Geographical mobility - Same house 1 year ago (%) - American Indian and Alaska Native
Geographical mobility - Same house 1 year ago (%) - Multirace
Geographical mobility - Same house 1 year ago (%) - Other Race
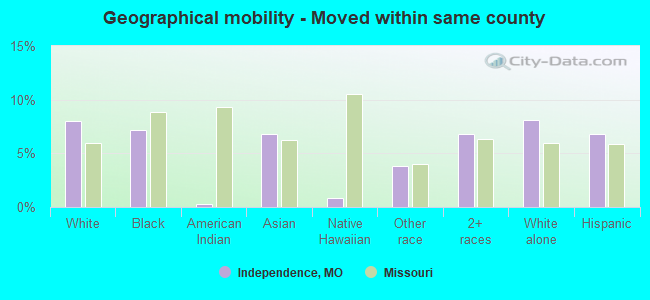
Geographical mobility - Moved within same county (%)
Geographical mobility - Moved within same county (%) - White
Geographical mobility - Moved within same county (%) - Black or African American
Geographical mobility - Moved within same county (%) - Asian
Geographical mobility - Moved within same county (%) - Hispanic or Latino
Geographical mobility - Moved within same county (%) - American Indian and Alaska Native
Geographical mobility - Moved within same county (%) - Multirace
Geographical mobility - Moved within same county (%) - Other Race
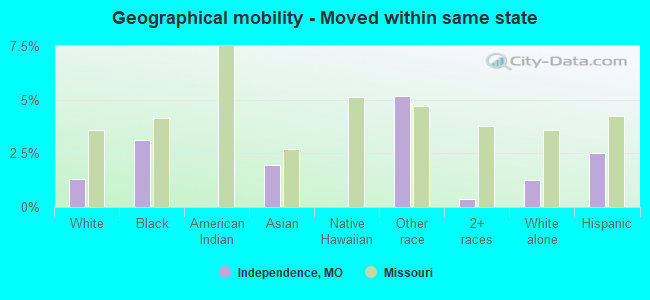
Geographical mobility - Moved from different county within same state (%)
Geographical mobility - Moved from different county within same state (%) - White
Geographical mobility - Moved from different county within same state (%) - Black or African American
Geographical mobility - Moved from different county within same state (%) - Asian
Geographical mobility - Moved from different county within same state (%) - Hispanic or Latino
Geographical mobility - Moved from different county within same state (%) - American Indian and Alaska Native
Geographical mobility - Moved from different county within same state (%) - Multirace
Geographical mobility - Moved from different county within same state (%) - Other Race
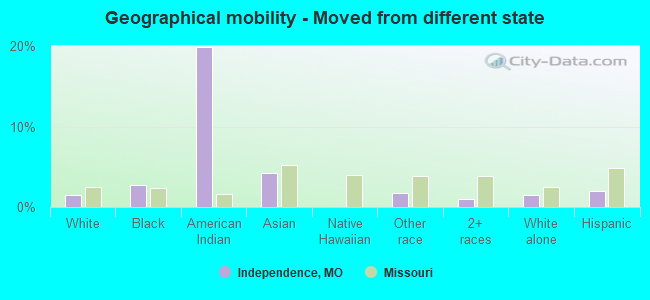
Geographical mobility - Moved from different state (%)
Geographical mobility - Moved from different state (%) - White
Geographical mobility - Moved from different state (%) - Black or African American
Geographical mobility - Moved from different state (%) - Asian
Geographical mobility - Moved from different state (%) - Hispanic or Latino
Geographical mobility - Moved from different state (%) - American Indian and Alaska Native
Geographical mobility - Moved from different state (%) - Multirace
Geographical mobility - Moved from different state (%) - Other Race
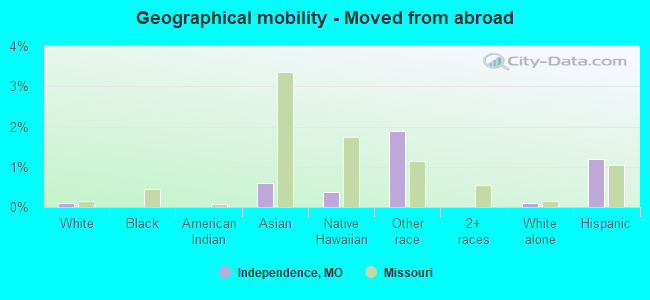
Geographical mobility - Moved from abroad (%)
Geographical mobility - Moved from abroad (%) - White
Geographical mobility - Moved from abroad (%) - Black or African American
Geographical mobility - Moved from abroad (%) - Asian
Geographical mobility - Moved from abroad (%) - Hispanic or Latino
Geographical mobility - Moved from abroad (%) - American Indian and Alaska Native
Geographical mobility - Moved from abroad (%) - Multirace
Geographical mobility - Moved from abroad (%) - Other Race
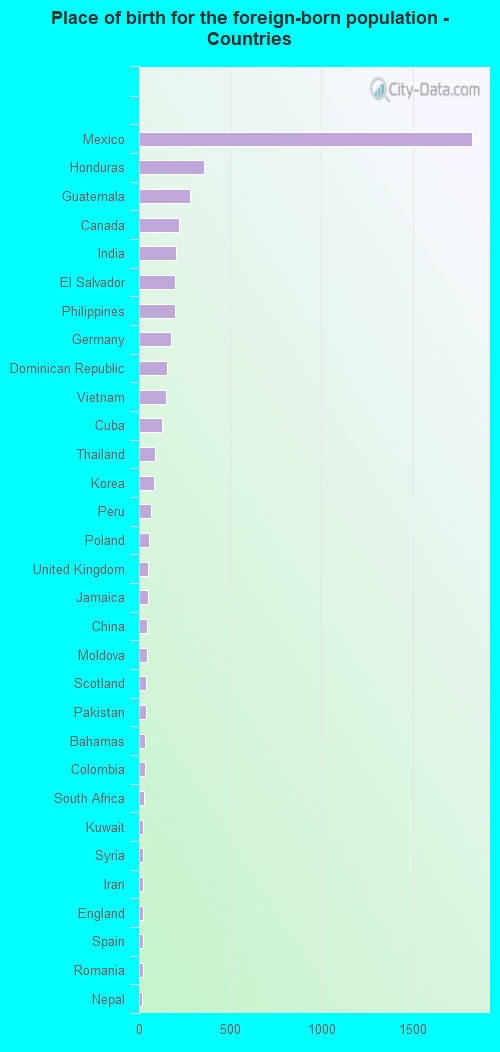
Place of birth for the foreign-born population - Ireland (%)
Place of birth for the foreign-born population - Denmark (%)
Place of birth for the foreign-born population - Norway (%)
Place of birth for the foreign-born population - Sweden (%)
Place of birth for the foreign-born population - United Kingdom (%)
Place of birth for the foreign-born population - England (%)
Place of birth for the foreign-born population - Scotland (%)
Place of birth for the foreign-born population - Other Northern Europe (%)
Place of birth for the foreign-born population - Austria (%)
Place of birth for the foreign-born population - Belgium (%)
Place of birth for the foreign-born population - France (%)
Place of birth for the foreign-born population - Germany (%)
Place of birth for the foreign-born population - Netherlands (%)
Place of birth for the foreign-born population - Switzerland (%)
Place of birth for the foreign-born population - Other Western Europe (%)
Place of birth for the foreign-born population - Greece (%)
Place of birth for the foreign-born population - Italy (%)
Place of birth for the foreign-born population - Portugal (%)
Place of birth for the foreign-born population - Spain (%)
Place of birth for the foreign-born population - Other Southern Europe (%)
Place of birth for the foreign-born population - Albania (%)
Place of birth for the foreign-born population - Belarus (%)
Place of birth for the foreign-born population - Bosnia and Herzegovina (%)
Place of birth for the foreign-born population - Bulgaria (%)
Place of birth for the foreign-born population - Croatia (%)
Place of birth for the foreign-born population - Czechoslovakia (%)
Place of birth for the foreign-born population - Hungary (%)
Place of birth for the foreign-born population - Latvia (%)
Place of birth for the foreign-born population - Lithuania (%)
Place of birth for the foreign-born population - North Macedonia (Macedonia) (%)
Place of birth for the foreign-born population - Moldova (%)
Place of birth for the foreign-born population - Poland (%)
Place of birth for the foreign-born population - Romania (%)
Place of birth for the foreign-born population - Russia (%)
Place of birth for the foreign-born population - Serbia (%)
Place of birth for the foreign-born population - Ukraine (%)
Place of birth for the foreign-born population - Other Eastern Europe (%)
Place of birth for the foreign-born population - China (%)
Place of birth for the foreign-born population - Hong Kong (%)
Place of birth for the foreign-born population - Taiwan (%)
Place of birth for the foreign-born population - Japan (%)
Place of birth for the foreign-born population - Korea (%)
Place of birth for the foreign-born population - Other Eastern Asia (%)
Place of birth for the foreign-born population - Afghanistan (%)
Place of birth for the foreign-born population - Bangladesh (%)
Place of birth for the foreign-born population - India (%)
Place of birth for the foreign-born population - Iran (%)
Place of birth for the foreign-born population - Kazakhstan (%)
Place of birth for the foreign-born population - Nepal (%)
Place of birth for the foreign-born population - Pakistan (%)
Place of birth for the foreign-born population - Sri Lanka (%)
Place of birth for the foreign-born population - Uzbekistan (%)
Place of birth for the foreign-born population - Other South Central Asia (%)
Place of birth for the foreign-born population - Burma (%)
Place of birth for the foreign-born population - Cambodia (%)
Place of birth for the foreign-born population - Indonesia (%)
Place of birth for the foreign-born population - Laos (%)
Place of birth for the foreign-born population - Malaysia (%)
Place of birth for the foreign-born population - Philippines (%)
Place of birth for the foreign-born population - Singapore (%)
Place of birth for the foreign-born population - Thailand (%)
Place of birth for the foreign-born population - Vietnam (%)
Place of birth for the foreign-born population - Other South Eastern Asia (%)
Place of birth for the foreign-born population - Armenia (%)
Place of birth for the foreign-born population - Iraq (%)
Place of birth for the foreign-born population - Israel (%)
Place of birth for the foreign-born population - Jordan (%)
Place of birth for the foreign-born population - Kuwait (%)
Place of birth for the foreign-born population - Lebanon (%)
Place of birth for the foreign-born population - Saudi Arabia (%)
Place of birth for the foreign-born population - Syria (%)
Place of birth for the foreign-born population - Turkey (%)
Place of birth for the foreign-born population - Yemen (%)
Place of birth for the foreign-born population - Other Western Asia (%)
Place of birth for the foreign-born population - Eritrea (%)
Place of birth for the foreign-born population - Ethiopia (%)
Place of birth for the foreign-born population - Kenya (%)
Place of birth for the foreign-born population - Somalia (%)
Place of birth for the foreign-born population - Uganda (%)
Place of birth for the foreign-born population - Zimbabwe (%)
Place of birth for the foreign-born population - Other Eastern Africa (%)
Place of birth for the foreign-born population - Cameroon (%)
Place of birth for the foreign-born population - Congo (%)
Place of birth for the foreign-born population - Democratic Republic of Congo (Zaire) (%)
Place of birth for the foreign-born population - Other Middle Africa (%)
Place of birth for the foreign-born population - Egypt (%)
Place of birth for the foreign-born population - Morocco (%)
Place of birth for the foreign-born population - Sudan (%)
Place of birth for the foreign-born population - Other Northern Africa (%)
Place of birth for the foreign-born population - South Africa (%)
Place of birth for the foreign-born population - Other Southern Africa (%)
Place of birth for the foreign-born population - Cabo Verde (%)
Place of birth for the foreign-born population - Ghana (%)
Place of birth for the foreign-born population - Liberia (%)
Place of birth for the foreign-born population - Nigeria (%)
Place of birth for the foreign-born population - Senegal (%)
Place of birth for the foreign-born population - Sierra Leone (%)
Place of birth for the foreign-born population - Other Western Africa (%)
Place of birth for the foreign-born population - Australia (%)
Place of birth for the foreign-born population - New Zealand (%)
Place of birth for the foreign-born population - Fiji (%)
Place of birth for the foreign-born population - Micronesia (%)
Place of birth for the foreign-born population - Bahamas (%)
Place of birth for the foreign-born population - Barbados (%)
Place of birth for the foreign-born population - Cuba (%)
Place of birth for the foreign-born population - Dominica (%)
Place of birth for the foreign-born population - Dominican Republic (%)
Place of birth for the foreign-born population - Grenada (%)
Place of birth for the foreign-born population - Haiti (%)
Place of birth for the foreign-born population - Jamaica (%)
Place of birth for the foreign-born population - St. Vincent and the Grenadines (%)
Place of birth for the foreign-born population - Trinidad and Tobago (%)
Place of birth for the foreign-born population - West Indies (%)
Place of birth for the foreign-born population - Other Caribbean (%)
Place of birth for the foreign-born population - Belize (%)
Place of birth for the foreign-born population - Costa Rica (%)
Place of birth for the foreign-born population - El Salvador (%)
Place of birth for the foreign-born population - Guatemala (%)
Place of birth for the foreign-born population - Honduras (%)
Place of birth for the foreign-born population - Mexico (%)
Place of birth for the foreign-born population - Nicaragua (%)
Place of birth for the foreign-born population - Panama (%)
Place of birth for the foreign-born population - Other Central America (%)
Place of birth for the foreign-born population - Argentina (%)
Place of birth for the foreign-born population - Bolivia (%)
Place of birth for the foreign-born population - Brazil (%)
Place of birth for the foreign-born population - Chile (%)
Place of birth for the foreign-born population - Colombia (%)
Place of birth for the foreign-born population - Ecuador (%)
Place of birth for the foreign-born population - Guyana (%)
Place of birth for the foreign-born population - Peru (%)
Place of birth for the foreign-born population - Uruguay (%)
Place of birth for the foreign-born population - Venezuela (%)
Place of birth for the foreign-born population - Other South America (%)
Place of birth for the foreign-born population - Canada (%)
Place of birth for the foreign-born population - Other Northern America (%)
Place of birth for the foreign-born population - Other (%)
Latest news about races in Independence, MO collected exclusively by city-data.com from local newspapers, TV, and radio stations
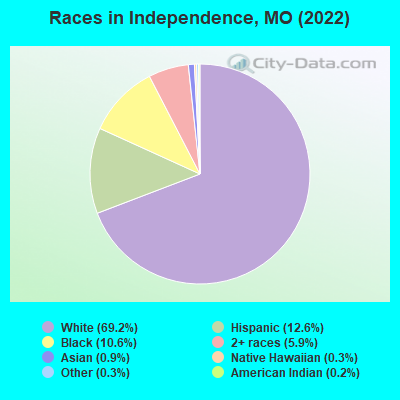
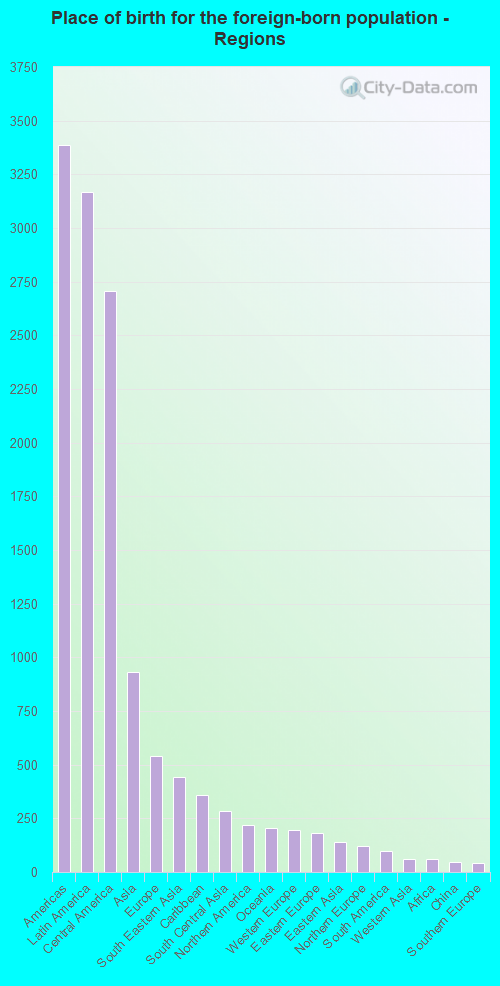
According to 2022 data, the most numerous races in Independence, MO are White alone (83,875 residents), Black alone (12,850 residents), and Two or more races (7,179 residents). 90.9% of Independence residents speak English at home. 4.2% of Independence, MO residents are foreign-born (2.6% born in Latin America, 0.8% born in Asia, 0.5% born in Europe), which is 4.4% greater than the foreign-born rate of 4.0% across the entire state of Missouri.
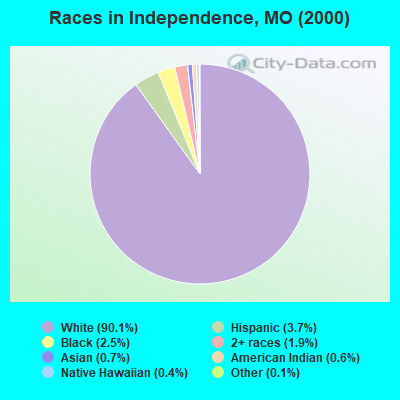
Race distribution in Independence
2000 2022
4,686,474 83.8% White alone 625,667 11.2% Black alone 118,592 2.1% Hispanic 71,905 1.3% Two or more races 61,041 1.1% Asian alone 23,302 0.4% American Indian alone 5,291 0.09% Other race alone 2,939 0.05% Native Hawaiian and Other
4,733,411 76.6% White alone 656,739 10.6% Black alone 316,300 5.1% Two or more races 291,763 4.7% Hispanic 132,436 2.1% Asian alone 27,467 0.4% Other race alone 12,313 0.2% American Indian alone 7,528 0.1% Native Hawaiian and Other
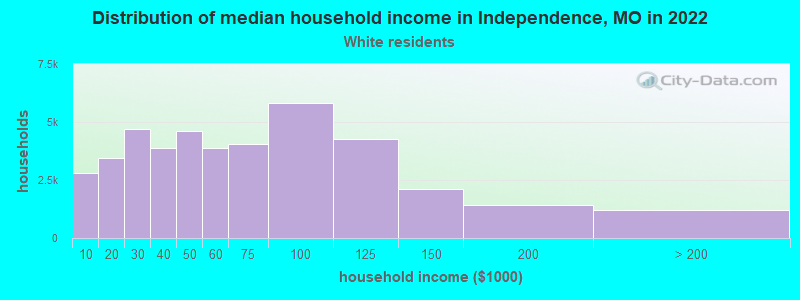
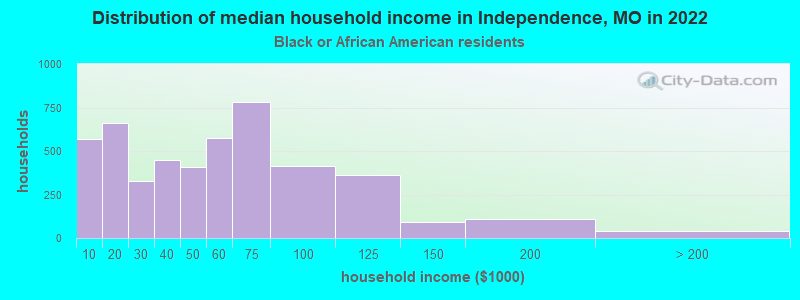
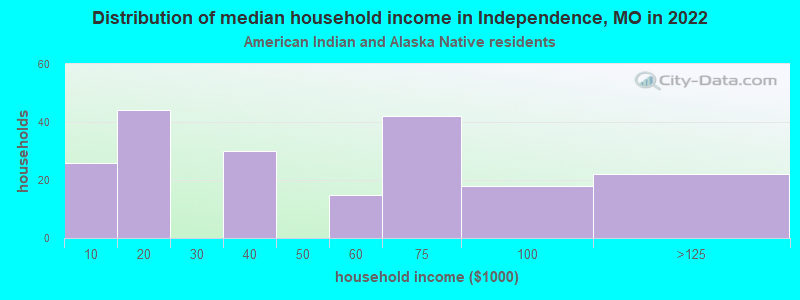
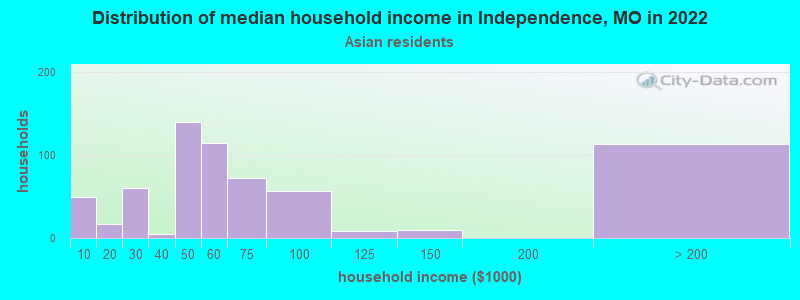
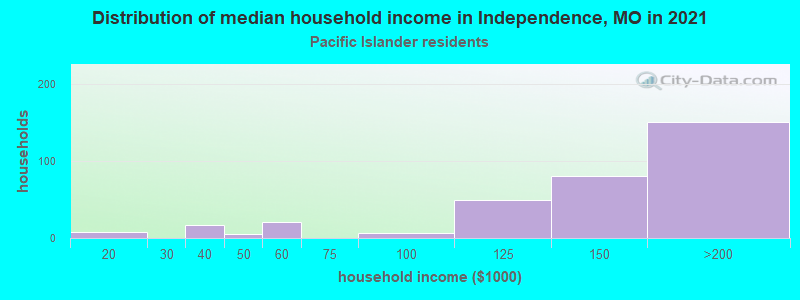
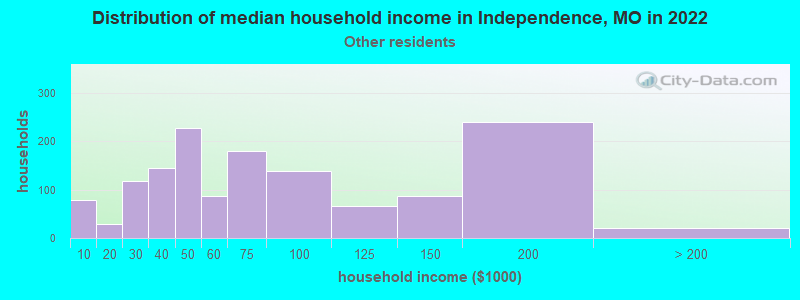
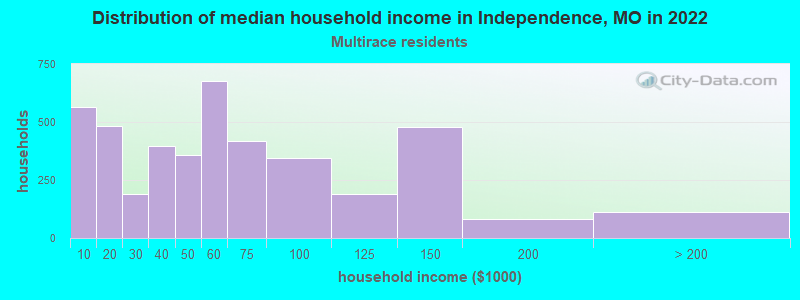
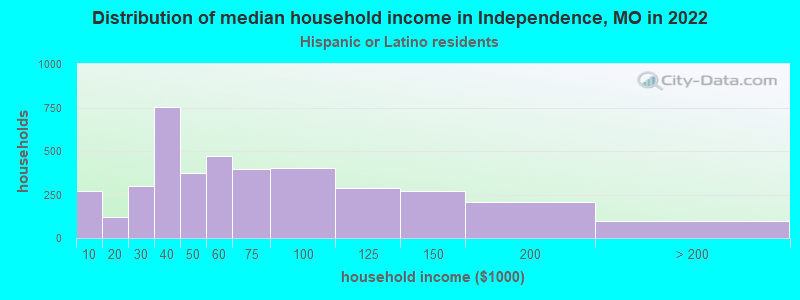
Income and house value in Independence Median household income in 2022 $52,930 White non-Hispanic householders$52,798 Black householders$51,476 American Indian and Alaska Native householders$52,168 Asian householders$75,985 Some other race householders$51,660 Two or more races householders$52,826 Hispanic or Latino race householdersMedian 2022 house value $167,808 White Non-Hispanic householders$164,982 Black or African American householders$132,377 American Indian or Alaska Native householders $152,810 Asian householders$217,368 Native Hawaiian and other Pacific Islander householders$180,850 Some other race householders$144,984 Two or more races householders$169,982 Hispanic or Latino householders
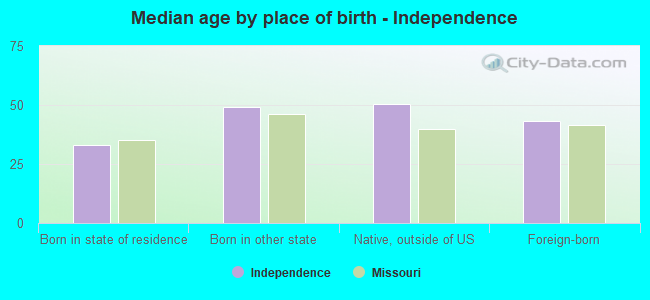
Median age by race in Independence
44.7 Median age for White residents44.1 46.3 28.2 Median age for Black or African American residents28.3 28.1 43.9 Median age for American Indian / Alaska Native residents45.1 -666,666,666.0 31.8 Median age for Asian residents45.5 31.6 39.7 Median age for Native Hawaiian / Pacific Islander residents-666,666,666.0 -666,666,666.0 28.7 Median age for Other race residents32.3 28.1 23.5 Median age for Two or more races residents19.9 24.2 46.7 Median age for White alone residents45.0 48.2 27.0 Median age for Hispanic or Latino residents28.5 23.9
Owner/renter occupied households by race in Independence
House owners and renters - White residents 27,742 65.8% Owner occupied14,417 34.2% Renter occupiedHouse owners and renters - Black or African American residents 2,227 44.0% Owner occupied2,833 56.0% Renter occupiedHouse owners and renters - American Indian / Alaska Native residents 118 58.7% Owner occupied83 41.3% Renter occupiedHouse owners and renters - Asian residents 389 62.9% Owner occupied229 37.1% Renter occupiedHouse owners and renters - Native Hawaiian / Pacific Islander residents 159 53.2% Owner occupied140 46.8% Renter occupiedHouse owners and renters - Other race residents 739 63.7% Owner occupied422 36.3% Renter occupiedHouse owners and renters - Two or more races residents 2,538 59.1% Owner occupied1,758 40.9% Renter occupiedHouse owners and renters - White alone residents 27,206 66.2% Owner occupied13,864 33.8% Renter occupiedHouse owners and renters - Hispanic or Latino residents 2,880 58.0% Owner occupied2,084 42.0% Renter occupied
Language usage in Independence
English speakers - Total 90.9% of residents of Independence speak English at home.
7.7% of residents speak Spanish at home 5,437 61.6% Speak English very well3,389 38.4% Speak English less than very well1.4% of residents speak other language at home 722 44.0% Speak English very well918 56.0% Speak English less than very well
English speakers - Born in the United States 92.8% of residents of Independence speak English at home.
6.6% of residents speak Spanish at home 2,397 93.7% Speak English very well161 6.3% Speak English less than very well0.5% of residents speak other language at home 111 54.1% Speak English very well94 45.9% Speak English less than very well
English speakers - Native, born elsewhere 69.4% of residents of Independence speak English at home.
21.9% of residents speak Spanish at home 25 9.4% Speak English very well241 90.6% Speak English less than very well8.7% of residents speak other language at home 105 100.0% Speak English very well
English speakers - Foreign-born 26.0% of residents of Independence speak English at home.
59.8% of residents speak Spanish at home 1,492 33.9% Speak English very well2,914 66.1% Speak English less than very well14.2% of residents speak other language at home 220 21.1% Speak English very well824 78.9% Speak English less than very well
White (Caucasian) - Speak only English Native:
98.7% (81,559)Foreign-born:
51.1% (746)
White (Caucasian) - Speak another language Native:
1.3% (1,077)Foreign-born:
48.9% (713)
Black or African American - Speak only English Native:
98.5% (11,333)Foreign-born:
82.6% (133)
Black or African American - Speak another language Native:
0.8% (94)Foreign-born:
24.5% (39)
American Indian / Alaska Native - Speak only English Native:
90.0% (263)Foreign-born:
82.2% (49)
American Indian / Alaska Native - Speak another language Native:
2.2% (6)Foreign-born:
81.3% (48)
Asian - Speak only English Native:
29.9% (164)Foreign-born:
16.8% (150)
Asian - Speak another language Native:
69.3% (379)Foreign-born:
82.6% (739)
Native Hawaiian / Pacific Islander - Speak only English Native:
86.3% (875)Foreign-born:
57.6% (94)
Native Hawaiian / Pacific Islander - Speak another language Native:
12.6% (128)Foreign-born:
46.9% (77)
Other race - Speak only English Native:
55.3% (702)Foreign-born:
18.5% (504)
Other race - Speak another language Native:
44.7% (567)Foreign-born:
81.5% (2,222)
Two or more races - Speak another language Native:
23.8% (2,569)Foreign-born:
100.0% (2,026)
White alone - Speak only English Native:
99.2% (79,140)Foreign-born:
37.0% (418)
White alone - Speak another language Native:
0.8% (620)Foreign-born:
63.0% (713)
Hispanic or Latino - Speak only English Native:
53.6% (4,660)Foreign-born:
16.2% (832)
Hispanic or Latino - Speak another language Native:
46.4% (4,032)Foreign-born:
83.8% (4,316)
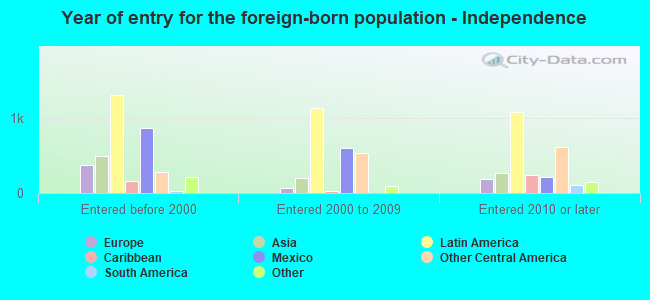
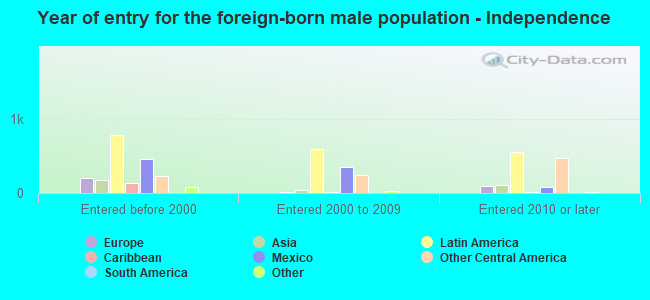
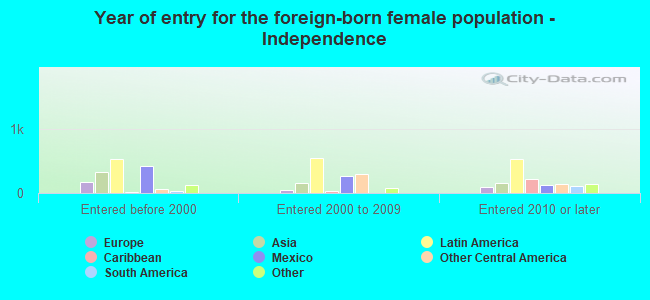
Foreign-born residents in Independence 5,122 residents are foreign born (2.6% Latin America , 0.8% Asia , 0.5% Europe ).
This city:
4.2%Missouri:
4.2%
Marital status for residents in Independence Marital status - White (Caucasian) population 15 years and over
Males 32.1% Never married41.1% Now married2.8% Separated7.0% Widowed17.0% DivorcedFemales 25.8% Never married41.3% Now married1.7% Separated11.8% Widowed19.3% DivorcedWomen who gave birth in the past 12 months Now married:
100.0% (625)Unmarried:
0.0% (0)
Women who did not give birth in the past 12 months Now married:
39.7% (6,691)Unmarried:
60.3% (10,155)
Marital status - Black or African American population 15 years and over
Males 43.1% Never married44.7% Now married0.4% Separated2.8% Widowed9.1% DivorcedFemales 69.3% Never married16.5% Now married0.0% Separated1.5% Widowed12.8% DivorcedWomen who gave birth in the past 12 months Now married:
45.1% (30)Unmarried:
54.9% (37)
Women who did not give birth in the past 12 months Now married:
22.0% (814)Unmarried:
78.0% (2,891)
Marital status - American Indian / Alaska Native population 15 years and over
Males 9.6% Never married71.2% Now married0.0% Separated0.0% Widowed19.2% DivorcedFemales 21.6% Never married60.2% Now married0.0% Separated0.0% Widowed18.1% DivorcedWomen who gave birth in the past 12 months Now married:
100.0% (37)Unmarried:
0.0% (0)
Women who did not give birth in the past 12 months Now married:
20.3% (14)Unmarried:
79.7% (54)
Marital status - Asian population 15 years and over
Males 36.0% Never married50.6% Now married0.0% Separated5.3% Widowed8.1% DivorcedFemales 22.1% Never married60.0% Now married1.3% Separated8.2% Widowed8.4% DivorcedWomen who did not give birth in the past 12 months Now married:
51.4% (216)Unmarried:
48.6% (205)
Marital status - Native Hawaiian / Pacific Islander population 15 years and over
Males 11.6% Never married58.0% Now married6.3% Separated0.0% Widowed24.1% DivorcedFemales 29.5% Never married60.0% Now married8.9% Separated0.0% Widowed1.6% DivorcedWomen who gave birth in the past 12 months Now married:
100.0% (44)Unmarried:
0.0% (0)
Women who did not give birth in the past 12 months Now married:
49.2% (98)Unmarried:
50.8% (101)
Marital status - Other race population 15 years and over
Males 41.7% Never married44.6% Now married0.0% Separated1.4% Widowed12.4% DivorcedFemales 30.2% Never married50.4% Now married2.2% Separated5.1% Widowed12.0% DivorcedWomen who gave birth in the past 12 months Now married:
35.3% (48)Unmarried:
64.7% (88)
Women who did not give birth in the past 12 months Now married:
54.5% (429)Unmarried:
45.5% (359)
Marital status - Two or more races population 15 years and over
Males 48.3% Never married34.4% Now married0.6% Separated4.5% Widowed12.1% DivorcedFemales 45.9% Never married36.0% Now married0.7% Separated1.4% Widowed16.0% DivorcedWomen who gave birth in the past 12 months Now married:
10.7% (12)Unmarried:
89.3% (104)
Women who did not give birth in the past 12 months Now married:
37.2% (1,072)Unmarried:
62.8% (1,812)
Marital status - White alone, not Hispanic / Latino population 15 years and over
Males 31.4% Never married42.1% Now married2.1% Separated7.1% Widowed17.4% DivorcedFemales 25.9% Never married41.1% Now married1.7% Separated12.0% Widowed19.3% DivorcedWomen who gave birth in the past 12 months Now married:
100.0% (386)Unmarried:
0.0% (0)
Women who did not give birth in the past 12 months Now married:
39.7% (6,560)Unmarried:
60.3% (9,976)
Marital status - Hispanic or Latino population 15 years and over
Males 47.1% Never married36.6% Now married5.3% Separated2.7% Widowed8.3% DivorcedFemales 46.6% Never married36.2% Now married1.0% Separated2.7% Widowed13.5% DivorcedWomen who gave birth in the past 12 months Now married:
100.0% (239)Unmarried:
0.0% (0)
Women who did not give birth in the past 12 months Now married:
26.3% (970)Unmarried:
73.7% (2,720)
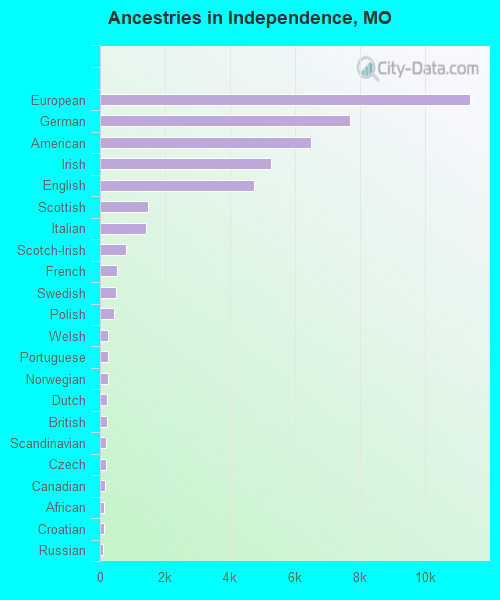
Ancestries in Independence
11,406 17.4% European7,712 11.8% German6,494 9.9% American5,252 8.0% Irish4,741 7.2% English1,468 2.2% Scottish1,410 2.2% Italian806 1.2% Scotch-Irish521 0.8% French485 0.7% Swedish431 0.7% Polish259 0.4% Welsh256 0.4% Portuguese245 0.4% Norwegian228 0.3% Dutch204 0.3% British198 0.3% Scandinavian171 0.3% Czech153 0.2% Canadian123 0.2% African120 0.2% Croatian104 0.2% Russian88 0.1% French Canadian87 0.1% Romanian82 0.1% Danish75 0.1% Slovak67 0.1% Jamaican61 0.09% Greek57 0.09% Hungarian52 0.08% Lebanese44 0.07% Northern European44 0.07% Swiss43 0.07% Syrian31 0.05% Iranian28 0.04% Haitian27 0.04% Zimbabwean25 0.04% Latvian24 0.04% Nigerian23 0.04% Luxembourger20 0.03% Czechoslovakian19 0.03% Belgian17 0.03% Finnish15 0.02% Yugoslavian13 0.02% Eastern European7 0.01% Serbian7 0.01% Somali6 0.01% Armenian
Geographical mobility in Independence Same house 1 year ago 77,811 89.1% White (Caucasian)11,012 87.1% Black or African American305 82.3% American Indian / Alaska Native1,242 85.0% Asian1,415 99.6% Native Hawaiian / Pacific Islander4,119 86.4% Other race10,711 91.3% Two or more races74,633 89.1% White alone, not Hispanic / Latino13,276 87.5% Hispanic or LatinoMoved within same county 7,016 8.0% White / Caucasian911 7.2% Black or African American1 0.3% American Indian / Alaska Native99 6.8% Asian12 0.8% Native Hawaiian / Pacific Islander180 3.8% Other race802 6.8% Two or more races6,767 8.1% White alone, not Hispanic / Latino1,025 6.8% Hispanic or LatinoMoved within same state 1,124 1.3% White / Caucasian393 3.1% Black or African American28 1.9% Asian246 5.2% Other race43 0.4% Two or more races1,048 1.3% White alone, not Hispanic / Latino382 2.5% Hispanic or LatinoMoved from different state 1,280 1.5% White / Caucasian352 2.8% Black or African American73 19.8% American Indian / Alaska Native61 4.2% Asian81 1.7% Other race122 1.0% Two or more races1,208 1.4% White alone, not Hispanic / Latino299 2.0% Hispanic or LatinoMoved from abroad 78 0.1% White9 0.6% Asian5 0.4% Native Hawaiian / Pacific Islander90 1.9% Other race78 0.1% White alone, not Hispanic / Latino182 1.2% Hispanic or Latino
Children Nativity (place of birth) in Independence
Children under 6 years - Living with two parents Both parents native 3,408 100.0% NativeBoth parents foreign-born 215 100.0% NativeOne native, one foreign-born parent 494 100.0% NativeChildren under 6 years - Living with one parent Native parent 3,356 100.0% NativeForeign-born parent 424 100.0% NativeChildren 6 to 17 years - Living with two parents Both parents native 7,720 99.8% Native17 0.2% Foreign-bornBoth parents foreign-born 637 90.6% Native66 9.4% Foreign-bornOne native, one foreign-born parent 541 100.0% NativeChildren 6 to 17 years - Living with one parent Native parent 7,870 100.0% NativeForeign-born parent 406 53.6% Native351 46.4% Foreign-born
Grandparents responsible for own grandchildren in Independence
Grandparents (30 to 59 years) White / Caucasian 187 33.0% Responsible for grandchildren380 67.0% Not responsible for grandchildrenBlack or African American 92 100.0% Responsible for grandchildrenAsian 28 100.0% Not responsible for grandchildrenNative Hawaiian / Pacific Islander 15 100.0% Responsible for grandchildrenOther race 58 100.0% Not responsible for grandchildrenTwo or more races 8 20.6% Responsible for grandchildren32 79.4% Not responsible for grandchildrenWhite alone, not Hispanic / Latino 187 36.2% Responsible for grandchildren329 63.8% Not responsible for grandchildrenHispanic or Latino 77 100.0% Not responsible for grandchildrenGrandparents (60 years and over) White / Caucasian 239 38.8% Responsible for grandchildren377 61.2% Not responsible for grandchildrenBlack or African American 43 100.0% Not responsible for grandchildrenNative Hawaiian / Pacific Islander 68 91.6% Responsible for grandchildren6 8.4% Not responsible for grandchildrenOther race 13 14.0% Responsible for grandchildren82 86.0% Not responsible for grandchildrenTwo or more races 43 73.1% Responsible for grandchildren16 26.9% Not responsible for grandchildrenWhite alone, not Hispanic / Latino 239 38.8% Responsible for grandchildren377 61.2% Not responsible for grandchildrenHispanic or Latino 10 9.7% Responsible for grandchildren95 90.3% Not responsible for grandchildren