Races in Indiana, Pennsylvania (PA) Detailed Stats
Data:
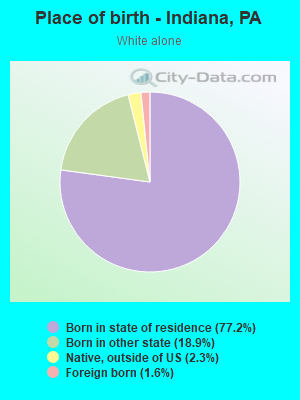
Races - White alone (%)
Races - White alone (% change since 2000)
Races - Black alone (%)
Races - Black alone (% change since 2000)
Races - American Indian alone (%)
Races - American Indian alone (% change since 2000)
Races - Asian alone (%)
Races - Asian alone (% change since 2000)
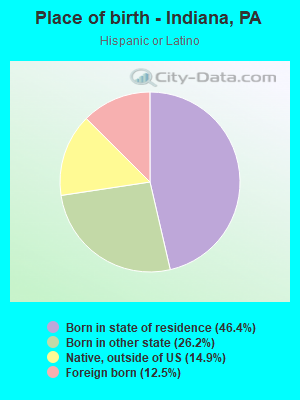
Races - Hispanic (%)
Races - Hispanic (% change since 2000)
Races - Native Hawaiian and Other Pacific Islander alone (%)
Races - Native Hawaiian and Other Pacific Islander alone (% change since 2000)
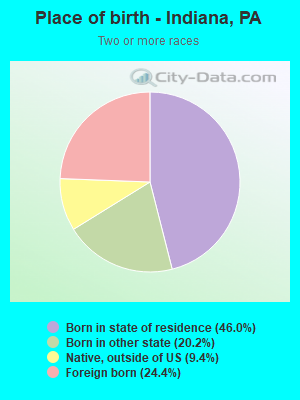
Races - Two or more races(%)
Races - Two or more races(% change since 2000)
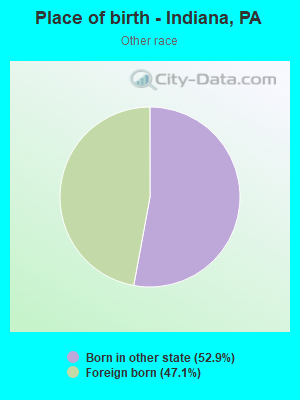
Races - Other race alone (%)
Races - Other race alone (% change since 2000)
Racial diversity
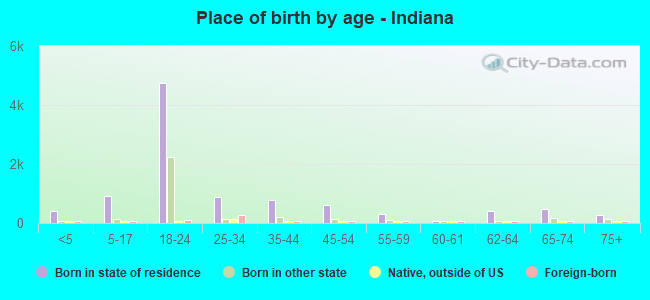
Place of birth - Born in state of residence (%)
Place of birth - Born in state of residence (%) - White
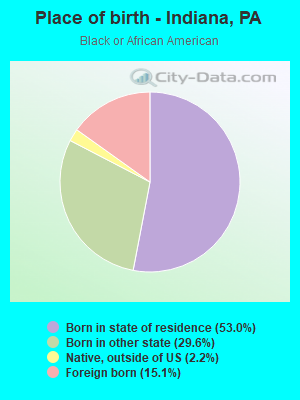
Place of birth - Born in state of residence (%) - Black or African American
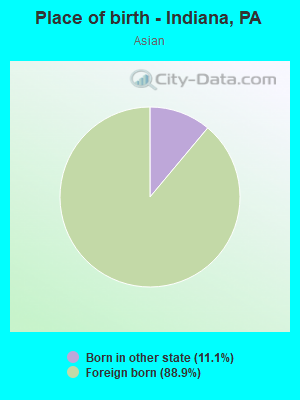
Place of birth - Born in state of residence (%) - Asian
Place of birth - Born in state of residence (%) - Hispanic or Latino
Place of birth - Born in state of residence (%) - American Indian and Alaska Native
Place of birth - Born in state of residence (%) - Multirace
Place of birth - Born in state of residence (%) - Other Race
Place of birth - Born in other state (%)
Place of birth - Born in other state (%) - White
Place of birth - Born in other state (%) - Black or African American
Place of birth - Born in other state (%) - Asian
Place of birth - Born in other state (%) - Hispanic or Latino
Place of birth - Born in other state (%) - American Indian and Alaska Native
Place of birth - Born in other state (%) - Multirace
Place of birth - Born in other state (%) - Other Race
Place of birth - Native, outside of US (%)
Place of birth - Native, outside of US (%) - White
Place of birth - Native, outside of US (%) - Black or African American
Place of birth - Native, outside of US (%) - Asian
Place of birth - Native, outside of US (%) - Hispanic or Latino
Place of birth - Native, outside of US (%) - American Indian and Alaska Native
Place of birth - Native, outside of US (%) - Multirace
Place of birth - Native, outside of US (%) - Other Race
Place of birth - Foreign born (%)
Place of birth - Foreign born (%) - White
Place of birth - Foreign born (%) - Black or African American
Place of birth - Foreign born (%) - Asian
Place of birth - Foreign born (%) - Hispanic or Latino
Place of birth - Foreign born (%) - American Indian and Alaska Native
Place of birth - Foreign born (%) - Multirace
Place of birth - Foreign born (%) - Other Race
Residents speaking English at home (%)
Residents speaking English at home - Born in the United States (%)
Residents speaking English at home - Native, born elsewhere (%)
Residents speaking English at home - Foreign born (%)
Residents speaking Spanish at home (%)
Residents speaking Spanish at home - Born in the United States (%)
Residents speaking Spanish at home - Native, born elsewhere (%)
Residents speaking Spanish at home - Foreign born (%)
Residents speaking other language at home (%)
Residents speaking other language at home - Born in the United States (%)
Residents speaking other language at home - Native, born elsewhere (%)
Residents speaking other language at home - Foreign born (%)
Marital status - Never married (%)
Marital status - Now married (%)
Marital status - Separated (%)
Marital status - Widowed (%)
Marital status - Divorced (%)
Ancestries Reported - Arab (%)
Ancestries Reported - Czech (%)
Ancestries Reported - Danish (%)
Ancestries Reported - Dutch (%)
Ancestries Reported - English (%)
Ancestries Reported - French (%)
Ancestries Reported - French Canadian (%)
Ancestries Reported - German (%)
Ancestries Reported - Greek (%)
Ancestries Reported - Hungarian (%)
Ancestries Reported - Irish (%)
Ancestries Reported - Italian (%)
Ancestries Reported - Lithuanian (%)
Ancestries Reported - Norwegian (%)
Ancestries Reported - Polish (%)
Ancestries Reported - Portuguese (%)
Ancestries Reported - Russian (%)
Ancestries Reported - Scotch-Irish (%)
Ancestries Reported - Scottish (%)
Ancestries Reported - Slovak (%)
Ancestries Reported - Subsaharan African (%)
Ancestries Reported - Swedish (%)
Ancestries Reported - Swiss (%)
Ancestries Reported - Ukrainian (%)
Ancestries Reported - United States (%)
Ancestries Reported - Welsh (%)
Ancestries Reported - West Indian (%)
Ancestries Reported - Other (%)
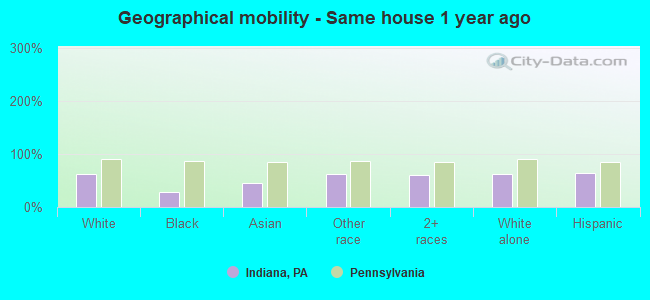
Geographical mobility - Same house 1 year ago (%)
Geographical mobility - Same house 1 year ago (%) - White
Geographical mobility - Same house 1 year ago (%) - Black or African American
Geographical mobility - Same house 1 year ago (%) - Asian
Geographical mobility - Same house 1 year ago (%) - Hispanic or Latino
Geographical mobility - Same house 1 year ago (%) - American Indian and Alaska Native
Geographical mobility - Same house 1 year ago (%) - Multirace
Geographical mobility - Same house 1 year ago (%) - Other Race
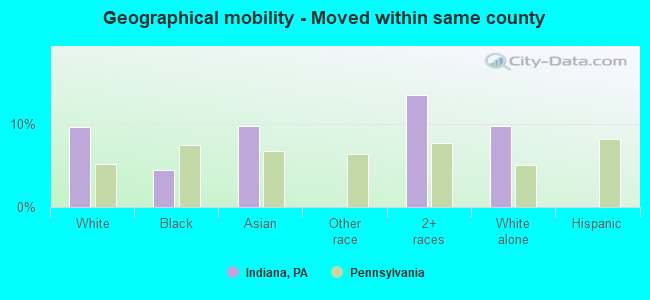
Geographical mobility - Moved within same county (%)
Geographical mobility - Moved within same county (%) - White
Geographical mobility - Moved within same county (%) - Black or African American
Geographical mobility - Moved within same county (%) - Asian
Geographical mobility - Moved within same county (%) - Hispanic or Latino
Geographical mobility - Moved within same county (%) - American Indian and Alaska Native
Geographical mobility - Moved within same county (%) - Multirace
Geographical mobility - Moved within same county (%) - Other Race
Geographical mobility - Moved from different county within same state (%)
Geographical mobility - Moved from different county within same state (%) - White
Geographical mobility - Moved from different county within same state (%) - Black or African American
Geographical mobility - Moved from different county within same state (%) - Asian
Geographical mobility - Moved from different county within same state (%) - Hispanic or Latino
Geographical mobility - Moved from different county within same state (%) - American Indian and Alaska Native
Geographical mobility - Moved from different county within same state (%) - Multirace
Geographical mobility - Moved from different county within same state (%) - Other Race
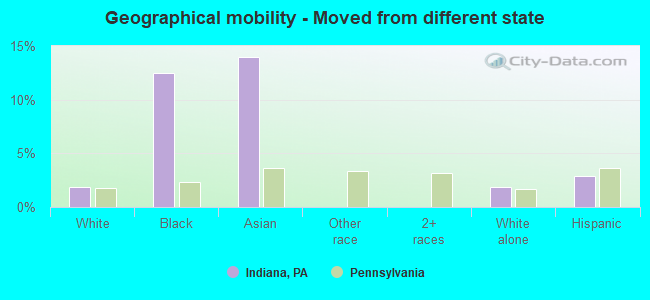
Geographical mobility - Moved from different state (%)
Geographical mobility - Moved from different state (%) - White
Geographical mobility - Moved from different state (%) - Black or African American
Geographical mobility - Moved from different state (%) - Asian
Geographical mobility - Moved from different state (%) - Hispanic or Latino
Geographical mobility - Moved from different state (%) - American Indian and Alaska Native
Geographical mobility - Moved from different state (%) - Multirace
Geographical mobility - Moved from different state (%) - Other Race
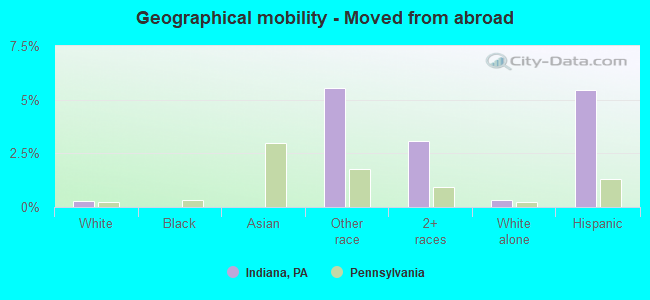
Geographical mobility - Moved from abroad (%)
Geographical mobility - Moved from abroad (%) - White
Geographical mobility - Moved from abroad (%) - Black or African American
Geographical mobility - Moved from abroad (%) - Asian
Geographical mobility - Moved from abroad (%) - Hispanic or Latino
Geographical mobility - Moved from abroad (%) - American Indian and Alaska Native
Geographical mobility - Moved from abroad (%) - Multirace
Geographical mobility - Moved from abroad (%) - Other Race
Place of birth for the foreign-born population - Ireland (%)
Place of birth for the foreign-born population - Denmark (%)
Place of birth for the foreign-born population - Norway (%)
Place of birth for the foreign-born population - Sweden (%)
Place of birth for the foreign-born population - United Kingdom (%)
Place of birth for the foreign-born population - England (%)
Place of birth for the foreign-born population - Scotland (%)
Place of birth for the foreign-born population - Other Northern Europe (%)
Place of birth for the foreign-born population - Austria (%)
Place of birth for the foreign-born population - Belgium (%)
Place of birth for the foreign-born population - France (%)
Place of birth for the foreign-born population - Germany (%)
Place of birth for the foreign-born population - Netherlands (%)
Place of birth for the foreign-born population - Switzerland (%)
Place of birth for the foreign-born population - Other Western Europe (%)
Place of birth for the foreign-born population - Greece (%)
Place of birth for the foreign-born population - Italy (%)
Place of birth for the foreign-born population - Portugal (%)
Place of birth for the foreign-born population - Spain (%)
Place of birth for the foreign-born population - Other Southern Europe (%)
Place of birth for the foreign-born population - Albania (%)
Place of birth for the foreign-born population - Belarus (%)
Place of birth for the foreign-born population - Bosnia and Herzegovina (%)
Place of birth for the foreign-born population - Bulgaria (%)
Place of birth for the foreign-born population - Croatia (%)
Place of birth for the foreign-born population - Czechoslovakia (%)
Place of birth for the foreign-born population - Hungary (%)
Place of birth for the foreign-born population - Latvia (%)
Place of birth for the foreign-born population - Lithuania (%)
Place of birth for the foreign-born population - North Macedonia (Macedonia) (%)
Place of birth for the foreign-born population - Moldova (%)
Place of birth for the foreign-born population - Poland (%)
Place of birth for the foreign-born population - Romania (%)
Place of birth for the foreign-born population - Russia (%)
Place of birth for the foreign-born population - Serbia (%)
Place of birth for the foreign-born population - Ukraine (%)
Place of birth for the foreign-born population - Other Eastern Europe (%)
Place of birth for the foreign-born population - China (%)
Place of birth for the foreign-born population - Hong Kong (%)
Place of birth for the foreign-born population - Taiwan (%)
Place of birth for the foreign-born population - Japan (%)
Place of birth for the foreign-born population - Korea (%)
Place of birth for the foreign-born population - Other Eastern Asia (%)
Place of birth for the foreign-born population - Afghanistan (%)
Place of birth for the foreign-born population - Bangladesh (%)
Place of birth for the foreign-born population - India (%)
Place of birth for the foreign-born population - Iran (%)
Place of birth for the foreign-born population - Kazakhstan (%)
Place of birth for the foreign-born population - Nepal (%)
Place of birth for the foreign-born population - Pakistan (%)
Place of birth for the foreign-born population - Sri Lanka (%)
Place of birth for the foreign-born population - Uzbekistan (%)
Place of birth for the foreign-born population - Other South Central Asia (%)
Place of birth for the foreign-born population - Burma (%)
Place of birth for the foreign-born population - Cambodia (%)
Place of birth for the foreign-born population - Indonesia (%)
Place of birth for the foreign-born population - Laos (%)
Place of birth for the foreign-born population - Malaysia (%)
Place of birth for the foreign-born population - Philippines (%)
Place of birth for the foreign-born population - Singapore (%)
Place of birth for the foreign-born population - Thailand (%)
Place of birth for the foreign-born population - Vietnam (%)
Place of birth for the foreign-born population - Other South Eastern Asia (%)
Place of birth for the foreign-born population - Armenia (%)
Place of birth for the foreign-born population - Iraq (%)
Place of birth for the foreign-born population - Israel (%)
Place of birth for the foreign-born population - Jordan (%)
Place of birth for the foreign-born population - Kuwait (%)
Place of birth for the foreign-born population - Lebanon (%)
Place of birth for the foreign-born population - Saudi Arabia (%)
Place of birth for the foreign-born population - Syria (%)
Place of birth for the foreign-born population - Turkey (%)
Place of birth for the foreign-born population - Yemen (%)
Place of birth for the foreign-born population - Other Western Asia (%)
Place of birth for the foreign-born population - Eritrea (%)
Place of birth for the foreign-born population - Ethiopia (%)
Place of birth for the foreign-born population - Kenya (%)
Place of birth for the foreign-born population - Somalia (%)
Place of birth for the foreign-born population - Uganda (%)
Place of birth for the foreign-born population - Zimbabwe (%)
Place of birth for the foreign-born population - Other Eastern Africa (%)
Place of birth for the foreign-born population - Cameroon (%)
Place of birth for the foreign-born population - Congo (%)
Place of birth for the foreign-born population - Democratic Republic of Congo (Zaire) (%)
Place of birth for the foreign-born population - Other Middle Africa (%)
Place of birth for the foreign-born population - Egypt (%)
Place of birth for the foreign-born population - Morocco (%)
Place of birth for the foreign-born population - Sudan (%)
Place of birth for the foreign-born population - Other Northern Africa (%)
Place of birth for the foreign-born population - South Africa (%)
Place of birth for the foreign-born population - Other Southern Africa (%)
Place of birth for the foreign-born population - Cabo Verde (%)
Place of birth for the foreign-born population - Ghana (%)
Place of birth for the foreign-born population - Liberia (%)
Place of birth for the foreign-born population - Nigeria (%)
Place of birth for the foreign-born population - Senegal (%)
Place of birth for the foreign-born population - Sierra Leone (%)
Place of birth for the foreign-born population - Other Western Africa (%)
Place of birth for the foreign-born population - Australia (%)
Place of birth for the foreign-born population - New Zealand (%)
Place of birth for the foreign-born population - Fiji (%)
Place of birth for the foreign-born population - Micronesia (%)
Place of birth for the foreign-born population - Bahamas (%)
Place of birth for the foreign-born population - Barbados (%)
Place of birth for the foreign-born population - Cuba (%)
Place of birth for the foreign-born population - Dominica (%)
Place of birth for the foreign-born population - Dominican Republic (%)
Place of birth for the foreign-born population - Grenada (%)
Place of birth for the foreign-born population - Haiti (%)
Place of birth for the foreign-born population - Jamaica (%)
Place of birth for the foreign-born population - St. Vincent and the Grenadines (%)
Place of birth for the foreign-born population - Trinidad and Tobago (%)
Place of birth for the foreign-born population - West Indies (%)
Place of birth for the foreign-born population - Other Caribbean (%)
Place of birth for the foreign-born population - Belize (%)
Place of birth for the foreign-born population - Costa Rica (%)
Place of birth for the foreign-born population - El Salvador (%)
Place of birth for the foreign-born population - Guatemala (%)
Place of birth for the foreign-born population - Honduras (%)
Place of birth for the foreign-born population - Mexico (%)
Place of birth for the foreign-born population - Nicaragua (%)
Place of birth for the foreign-born population - Panama (%)
Place of birth for the foreign-born population - Other Central America (%)
Place of birth for the foreign-born population - Argentina (%)
Place of birth for the foreign-born population - Bolivia (%)
Place of birth for the foreign-born population - Brazil (%)
Place of birth for the foreign-born population - Chile (%)
Place of birth for the foreign-born population - Colombia (%)
Place of birth for the foreign-born population - Ecuador (%)
Place of birth for the foreign-born population - Guyana (%)
Place of birth for the foreign-born population - Peru (%)
Place of birth for the foreign-born population - Uruguay (%)
Place of birth for the foreign-born population - Venezuela (%)
Place of birth for the foreign-born population - Other South America (%)
Place of birth for the foreign-born population - Canada (%)
Place of birth for the foreign-born population - Other Northern America (%)
Place of birth for the foreign-born population - Other (%)
Latest news about races in Indiana, PA collected exclusively by city-data.com from local newspapers, TV, and radio stations
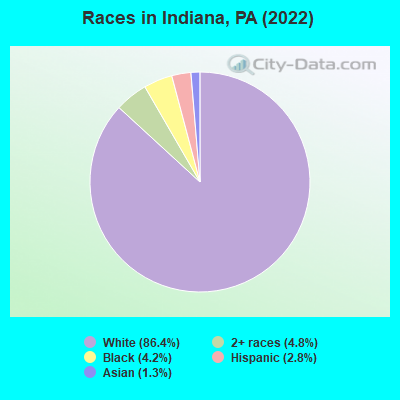
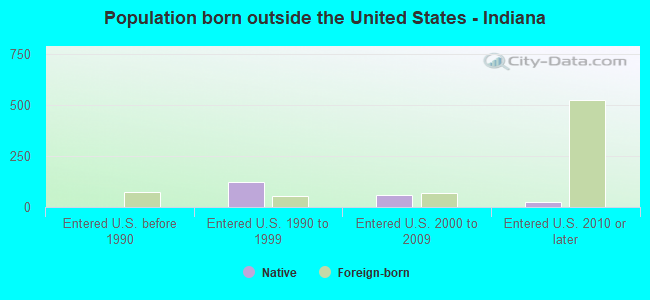
According to 2022 data, the most numerous races in Indiana, PA are White alone (12,155 residents), Black alone (597 residents), and Hispanic (389 residents). 93.0% of Indiana residents speak English at home. 4.8% of Indiana, PA residents are foreign-born (3.1% born in Asia, 0.9% born in Latin America), which is 46.8% less than the foreign-born rate of 7.0% across the entire state of Pennsylvania.
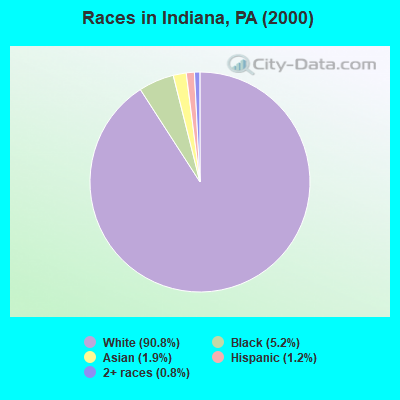
Race distribution in Indiana
2000 2022
10,322,455 84.1% White alone 1,202,437 9.8% Black alone 394,088 3.2% Hispanic 218,296 1.8% Asian alone 113,097 0.9% Two or more races 13,086 0.1% Other race alone 14,904 0.1% American Indian alone 2,691 0.02% Native Hawaiian and Other
9,487,228 73.1% White alone 1,311,581 10.1% Black alone 1,115,997 8.6% Hispanic 493,942 3.8% Two or more races 487,124 3.8% Asian alone 63,582 0.5% Other race alone 10,130 0.08% American Indian alone 2,424 0.02% Native Hawaiian and Other
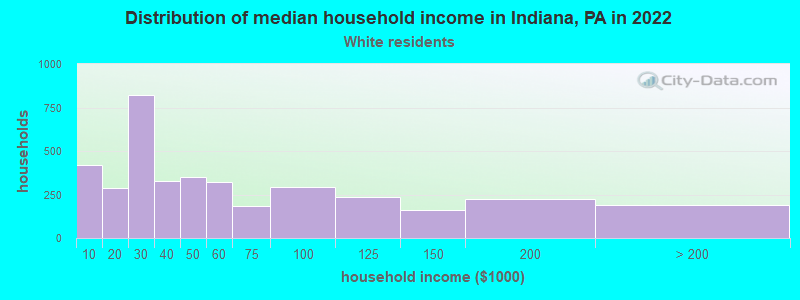
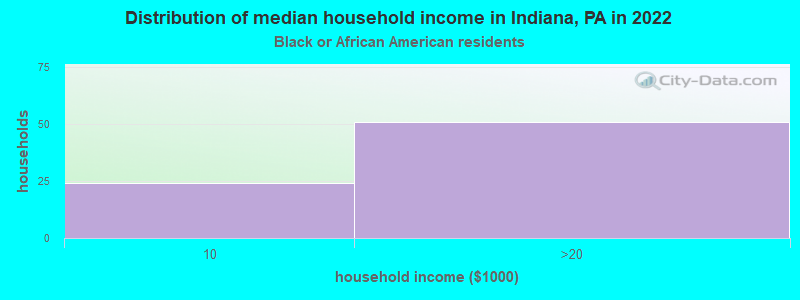
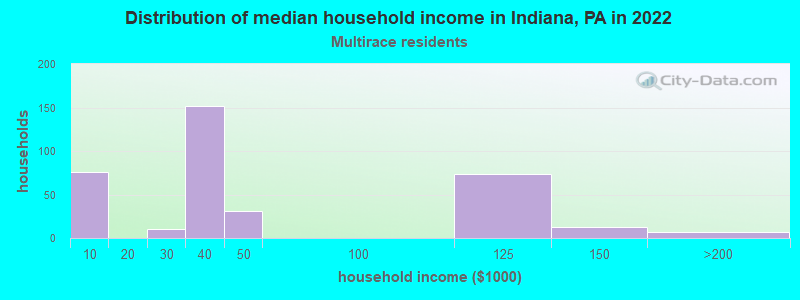
Income and house value in Indiana Median household income in 2022 $37,169 White non-Hispanic householders$14,482 Black householdersMedian 2022 house value $132,552 White Non-Hispanic householders$91,481 Black or African American householders $111,614 Asian householders$146,564 Hispanic or Latino householders
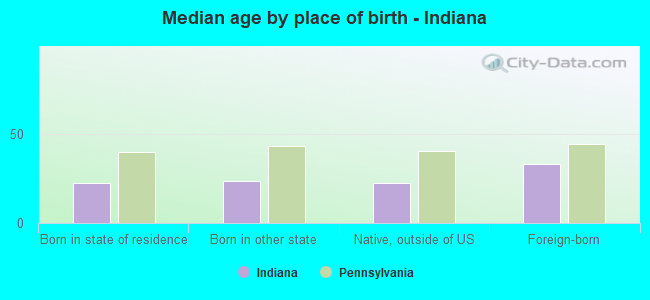
Median age by race in Indiana
22.1 Median age for White residents22.4 21.6 20.1 Median age for Black or African American residents20.2 20.1 -642,857,142.2 Median age for American Indian / Alaska Native residents-714,583,332.6 -577,519,379.3 17.9 Median age for Asian residents19.6 25.1 -666,666,666.0 Median age for Native Hawaiian / Pacific Islander residents-666,666,666.0 -666,666,666.0 9.3 Median age for Other race residents19.9 20.2 36.9 Median age for Two or more races residents36.3 35.7 21.8 Median age for White alone residents21.8 21.5 21.0 Median age for Hispanic or Latino residents20.3 21.8
Owner/renter occupied households by race in Indiana
House owners and renters - White residents 1,763 45.9% Owner occupied2,079 54.1% Renter occupiedHouse owners and renters - Black or African American residents 72 100.0% Renter occupiedHouse owners and renters - Asian residents 32 56.5% Owner occupied24 43.5% Renter occupiedHouse owners and renters - Two or more races residents 37 13.7% Owner occupied231 86.3% Renter occupiedHouse owners and renters - White alone residents 1,752 45.6% Owner occupied2,088 54.4% Renter occupied
Language usage in Indiana
English speakers - Total 93.0% of residents of Indiana speak English at home.
1.3% of residents speak Spanish at home 170 95.0% Speak English very well9 5.0% Speak English less than very well5.2% of residents speak other language at home 607 85.0% Speak English very well107 15.0% Speak English less than very well
English speakers - Born in the United States 93.3% of residents of Indiana speak English at home.
2.8% of residents speak Spanish at home 68 100.0% Speak English very well3.6% of residents speak other language at home 85 96.6% Speak English very well3 3.4% Speak English less than very well
English speakers - Native, born elsewhere 14.3% of residents of Indiana speak English at home.
21.0% of residents speak Spanish at home 47 100.0% Speak English very well78.1% of residents speak other language at home 175 100.0% Speak English very well
English speakers - Foreign-born 21.8% of residents of Indiana speak English at home.
7.0% of residents speak Spanish at home 38 80.9% Speak English very well9 19.1% Speak English less than very well66.1% of residents speak other language at home 342 77.2% Speak English very well101 22.8% Speak English less than very well
White (Caucasian) - Speak only English Native:
97.9% (11,352)Foreign-born:
14.8% (67)
White (Caucasian) - Speak another language Native:
2.1% (244)Foreign-born:
27.0% (123)
Black or African American - Speak only English Native:
94.1% (500)Foreign-born:
53.8% (51)
Black or African American - Speak another language Native:
5.8% (31)Foreign-born:
46.8% (44)
Asian - Speak only English Native:
16.1% (3)Foreign-born:
28.6% (46)
Asian - Speak another language Native:
85.9% (17)Foreign-born:
71.6% (115)
Other race - Speak another language Native:
34.3% (16)Foreign-born:
100.0% (45)
Two or more races - Speak another language Native:
15.5% (111)Foreign-born:
100.0% (238)
White alone - Speak only English Native:
97.8% (11,256)Foreign-born:
14.9% (70)
White alone - Speak another language Native:
2.1% (244)Foreign-born:
31.8% (150)
Hispanic or Latino - Speak another language Native:
41.9% (127)Foreign-born:
100.0% (48)
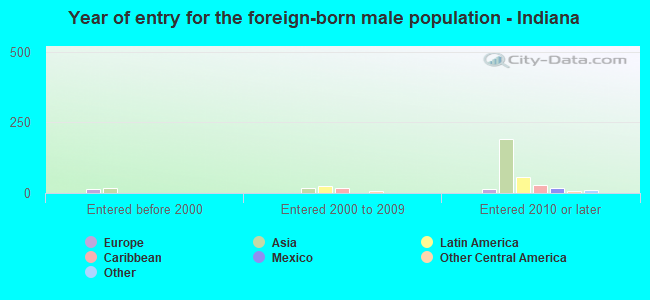
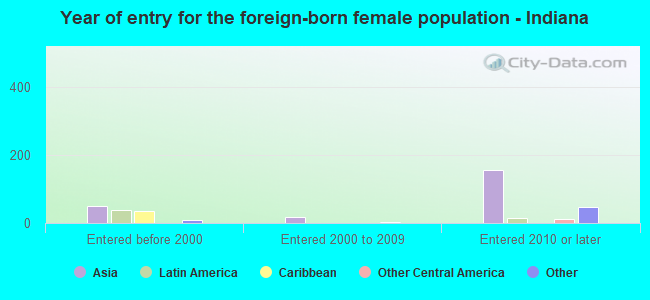
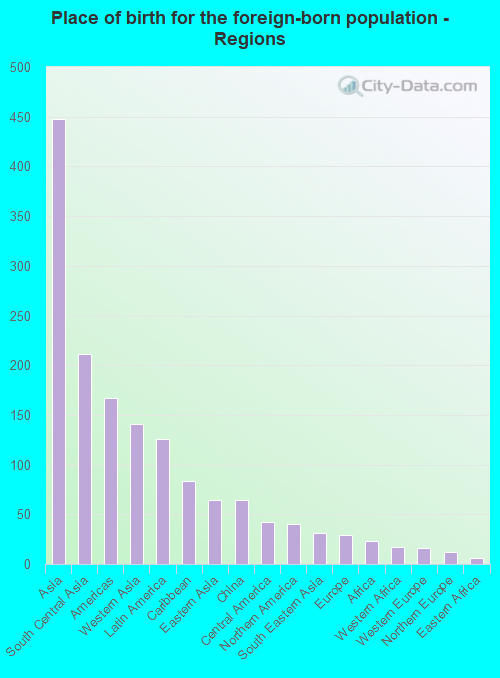
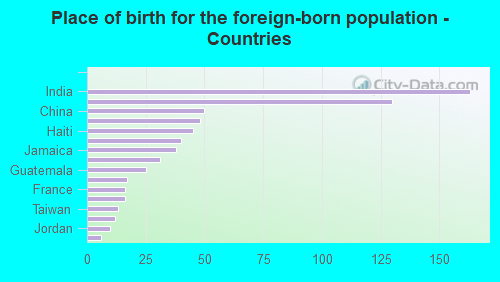
Foreign-born residents in Indiana 668 residents are foreign born (3.1% Asia , 0.9% Latin America ).
This city:
4.8%Pennsylvania:
7.3%
Marital status for residents in Indiana Marital status - White (Caucasian) population 15 years and over
Males 66.0% Never married27.0% Now married0.2% Separated0.0% Widowed6.7% DivorcedFemales 64.6% Never married24.0% Now married0.0% Separated3.6% Widowed7.8% DivorcedWomen who gave birth in the past 12 months Now married:
43.6% (70)Unmarried:
56.4% (90)
Women who did not give birth in the past 12 months Now married:
13.8% (620)Unmarried:
86.2% (3,868)
Marital status - Black or African American population 15 years and over
Males 98.5% Never married0.0% Now married0.0% Separated0.0% Widowed1.5% DivorcedFemales 97.8% Never married0.0% Now married2.2% Separated0.0% Widowed0.0% DivorcedWomen who did not give birth in the past 12 months Now married:
0.0% (0)Unmarried:
100.0% (302)
Marital status - Asian population 15 years and over
Males 79.0% Never married9.7% Now married11.3% Separated0.0% Widowed0.0% DivorcedFemales 73.5% Never married26.5% Now married0.0% Separated0.0% Widowed0.0% DivorcedWomen who did not give birth in the past 12 months Now married:
34.2% (27)Unmarried:
65.8% (51)
Marital status - Other race population 15 years and over
Males 100.0% Never married0.0% Now married0.0% Separated0.0% Widowed0.0% DivorcedFemales 100.0% Never married0.0% Now married0.0% Separated0.0% Widowed0.0% DivorcedWomen who did not give birth in the past 12 months Now married:
0.0% (0)Unmarried:
100.0% (50)
Marital status - Two or more races population 15 years and over
Males 91.1% Never married8.9% Now married0.0% Separated0.0% Widowed0.0% DivorcedFemales 72.3% Never married20.6% Now married3.7% Separated0.0% Widowed3.4% DivorcedWomen who did not give birth in the past 12 months Now married:
23.7% (84)Unmarried:
76.3% (271)
Marital status - White alone, not Hispanic / Latino population 15 years and over
Males 65.7% Never married27.2% Now married0.2% Separated0.0% Widowed6.8% DivorcedFemales 64.7% Never married23.9% Now married0.0% Separated3.6% Widowed7.9% DivorcedWomen who gave birth in the past 12 months Now married:
43.6% (70)Unmarried:
56.4% (91)
Women who did not give birth in the past 12 months Now married:
13.6% (609)Unmarried:
86.4% (3,872)
Marital status - Hispanic or Latino population 15 years and over
Males 75.8% Never married20.3% Now married0.0% Separated0.0% Widowed3.9% DivorcedFemales 92.1% Never married7.9% Now married0.0% Separated0.0% Widowed0.0% DivorcedWomen who did not give birth in the past 12 months Now married:
7.9% (16)Unmarried:
92.1% (186)
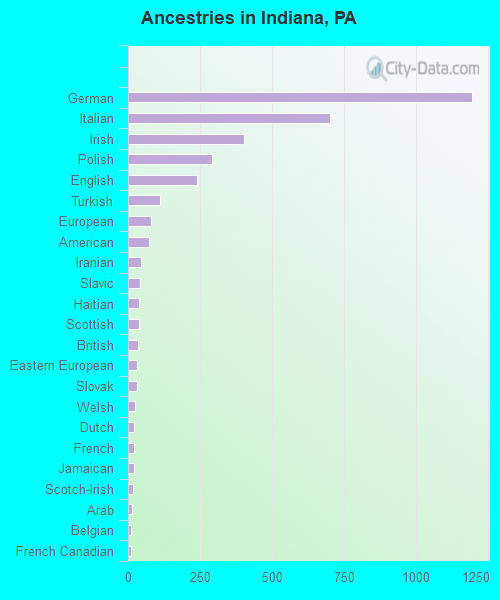
Ancestries in Indiana
1,194 27.6% German700 16.2% Italian403 9.3% Irish291 6.7% Polish241 5.6% English112 2.6% Turkish79 1.8% European74 1.7% American44 1.0% Iranian40 0.9% Slavic39 0.9% Haitian37 0.9% Scottish33 0.8% British31 0.7% Eastern European31 0.7% Slovak23 0.5% Welsh22 0.5% Dutch22 0.5% French22 0.5% Jamaican18 0.4% Scotch-Irish15 0.3% Arab12 0.3% Belgian12 0.3% French Canadian9 0.2% Hungarian9 0.2% Swedish9 0.2% Swiss8 0.2% Russian4 0.09% African
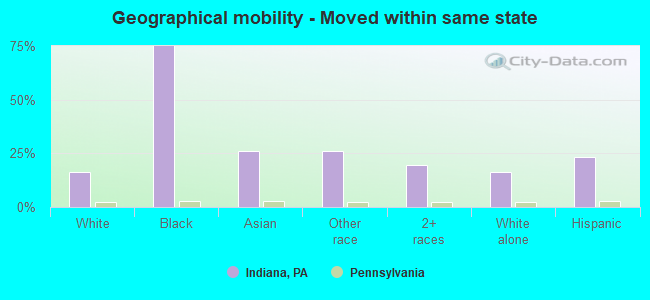
Geographical mobility in Indiana Same house 1 year ago 7,583 62.1% White (Caucasian)132 28.0% Black or African American82 44.7% Asian55 62.0% Other race577 60.3% Two or more races7,519 62.2% White alone, not Hispanic / Latino253 65.1% Hispanic or LatinoMoved within same county 1,184 9.7% White / Caucasian21 4.5% Black or African American18 9.8% Asian130 13.6% Two or more races1,184 9.8% White alone, not Hispanic / LatinoMoved within same state 2,014 16.5% White / Caucasian355 75.0% Black or African American48 25.9% Asian23 26.0% Other race189 19.8% Two or more races1,959 16.2% White alone, not Hispanic / Latino91 23.3% Hispanic or LatinoMoved from different state 223 1.8% White / Caucasian59 12.5% Black or African American26 14.0% Asian222 1.8% White alone, not Hispanic / Latino11 2.9% Hispanic or LatinoMoved from abroad 33 0.3% White5 5.5% Other race29 3.1% Two or more races38 0.3% White alone, not Hispanic / Latino21 5.5% Hispanic or Latino
Children Nativity (place of birth) in Indiana
Children under 6 years - Living with two parents Both parents native 392 100.0% NativeOne native, one foreign-born parent 4 100.0% NativeChildren under 6 years - Living with one parent Native parent 121 100.0% Native
Children 6 to 17 years - Living with two parents Both parents native 615 100.0% NativeBoth parents foreign-born 16 100.0% Foreign-bornChildren 6 to 17 years - Living with one parent Native parent 253 100.0% Native