Races in Inwood, Florida (FL) Detailed Stats
Data:
Races - White alone (%)
Races - White alone (% change since 2000)
Races - Black alone (%)
Races - Black alone (% change since 2000)
Races - American Indian alone (%)
Races - American Indian alone (% change since 2000)
Races - Asian alone (%)
Races - Asian alone (% change since 2000)
Races - Hispanic (%)
Races - Hispanic (% change since 2000)
Races - Native Hawaiian and Other Pacific Islander alone (%)
Races - Native Hawaiian and Other Pacific Islander alone (% change since 2000)
Races - Two or more races(%)
Races - Two or more races(% change since 2000)
Races - Other race alone (%)
Races - Other race alone (% change since 2000)
Racial diversity
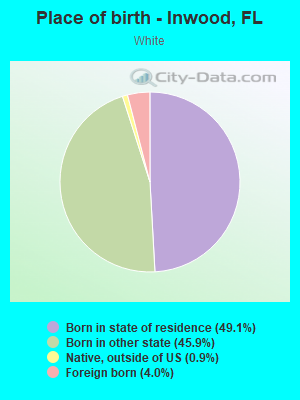
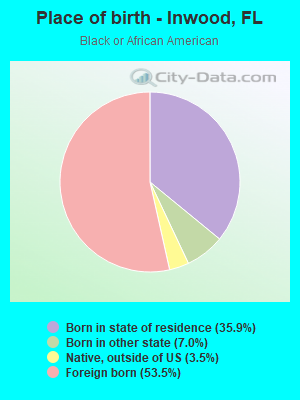
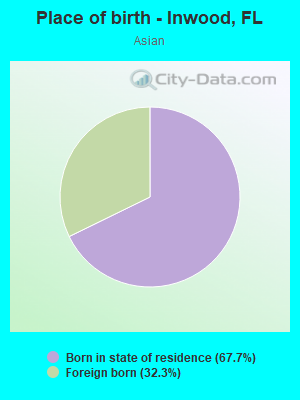
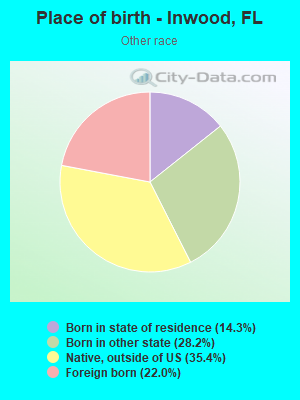
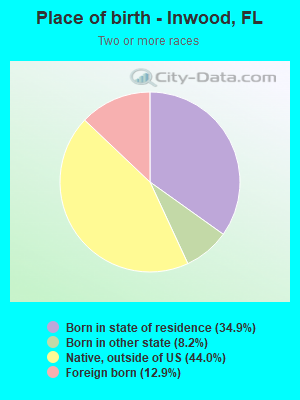
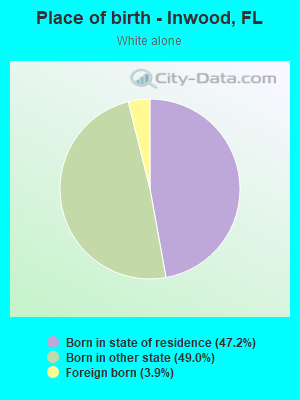
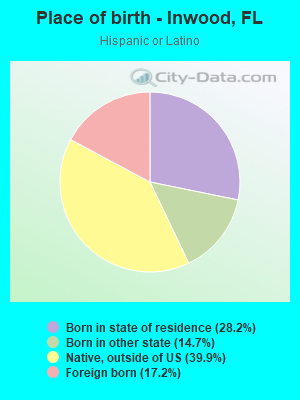
Place of birth - Born in state of residence (%)
Place of birth - Born in state of residence (%) - White
Place of birth - Born in state of residence (%) - Black or African American
Place of birth - Born in state of residence (%) - Asian
Place of birth - Born in state of residence (%) - Hispanic or Latino
Place of birth - Born in state of residence (%) - American Indian and Alaska Native
Place of birth - Born in state of residence (%) - Multirace
Place of birth - Born in state of residence (%) - Other Race
Place of birth - Born in other state (%)
Place of birth - Born in other state (%) - White
Place of birth - Born in other state (%) - Black or African American
Place of birth - Born in other state (%) - Asian
Place of birth - Born in other state (%) - Hispanic or Latino
Place of birth - Born in other state (%) - American Indian and Alaska Native
Place of birth - Born in other state (%) - Multirace
Place of birth - Born in other state (%) - Other Race
Place of birth - Native, outside of US (%)
Place of birth - Native, outside of US (%) - White
Place of birth - Native, outside of US (%) - Black or African American
Place of birth - Native, outside of US (%) - Asian
Place of birth - Native, outside of US (%) - Hispanic or Latino
Place of birth - Native, outside of US (%) - American Indian and Alaska Native
Place of birth - Native, outside of US (%) - Multirace
Place of birth - Native, outside of US (%) - Other Race
Place of birth - Foreign born (%)
Place of birth - Foreign born (%) - White
Place of birth - Foreign born (%) - Black or African American
Place of birth - Foreign born (%) - Asian
Place of birth - Foreign born (%) - Hispanic or Latino
Place of birth - Foreign born (%) - American Indian and Alaska Native
Place of birth - Foreign born (%) - Multirace
Place of birth - Foreign born (%) - Other Race
Residents speaking English at home (%)
Residents speaking English at home - Born in the United States (%)
Residents speaking English at home - Native, born elsewhere (%)
Residents speaking English at home - Foreign born (%)
Residents speaking Spanish at home (%)
Residents speaking Spanish at home - Born in the United States (%)
Residents speaking Spanish at home - Native, born elsewhere (%)
Residents speaking Spanish at home - Foreign born (%)
Residents speaking other language at home (%)
Residents speaking other language at home - Born in the United States (%)
Residents speaking other language at home - Native, born elsewhere (%)
Residents speaking other language at home - Foreign born (%)
Marital status - Never married (%)
Marital status - Now married (%)
Marital status - Separated (%)
Marital status - Widowed (%)
Marital status - Divorced (%)
Ancestries Reported - Arab (%)
Ancestries Reported - Czech (%)
Ancestries Reported - Danish (%)
Ancestries Reported - Dutch (%)
Ancestries Reported - English (%)
Ancestries Reported - French (%)
Ancestries Reported - French Canadian (%)
Ancestries Reported - German (%)
Ancestries Reported - Greek (%)
Ancestries Reported - Hungarian (%)
Ancestries Reported - Irish (%)
Ancestries Reported - Italian (%)
Ancestries Reported - Lithuanian (%)
Ancestries Reported - Norwegian (%)
Ancestries Reported - Polish (%)
Ancestries Reported - Portuguese (%)
Ancestries Reported - Russian (%)
Ancestries Reported - Scotch-Irish (%)
Ancestries Reported - Scottish (%)
Ancestries Reported - Slovak (%)
Ancestries Reported - Subsaharan African (%)
Ancestries Reported - Swedish (%)
Ancestries Reported - Swiss (%)
Ancestries Reported - Ukrainian (%)
Ancestries Reported - United States (%)
Ancestries Reported - Welsh (%)
Ancestries Reported - West Indian (%)
Ancestries Reported - Other (%)
Geographical mobility - Same house 1 year ago (%)
Geographical mobility - Same house 1 year ago (%) - White
Geographical mobility - Same house 1 year ago (%) - Black or African American
Geographical mobility - Same house 1 year ago (%) - Asian
Geographical mobility - Same house 1 year ago (%) - Hispanic or Latino
Geographical mobility - Same house 1 year ago (%) - American Indian and Alaska Native
Geographical mobility - Same house 1 year ago (%) - Multirace
Geographical mobility - Same house 1 year ago (%) - Other Race
Geographical mobility - Moved within same county (%)
Geographical mobility - Moved within same county (%) - White
Geographical mobility - Moved within same county (%) - Black or African American
Geographical mobility - Moved within same county (%) - Asian
Geographical mobility - Moved within same county (%) - Hispanic or Latino
Geographical mobility - Moved within same county (%) - American Indian and Alaska Native
Geographical mobility - Moved within same county (%) - Multirace
Geographical mobility - Moved within same county (%) - Other Race
Geographical mobility - Moved from different county within same state (%)
Geographical mobility - Moved from different county within same state (%) - White
Geographical mobility - Moved from different county within same state (%) - Black or African American
Geographical mobility - Moved from different county within same state (%) - Asian
Geographical mobility - Moved from different county within same state (%) - Hispanic or Latino
Geographical mobility - Moved from different county within same state (%) - American Indian and Alaska Native
Geographical mobility - Moved from different county within same state (%) - Multirace
Geographical mobility - Moved from different county within same state (%) - Other Race
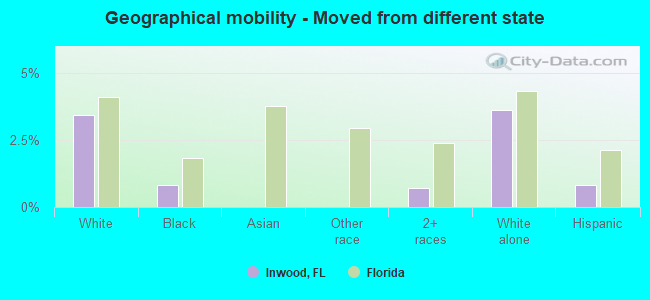
Geographical mobility - Moved from different state (%)
Geographical mobility - Moved from different state (%) - White
Geographical mobility - Moved from different state (%) - Black or African American
Geographical mobility - Moved from different state (%) - Asian
Geographical mobility - Moved from different state (%) - Hispanic or Latino
Geographical mobility - Moved from different state (%) - American Indian and Alaska Native
Geographical mobility - Moved from different state (%) - Multirace
Geographical mobility - Moved from different state (%) - Other Race
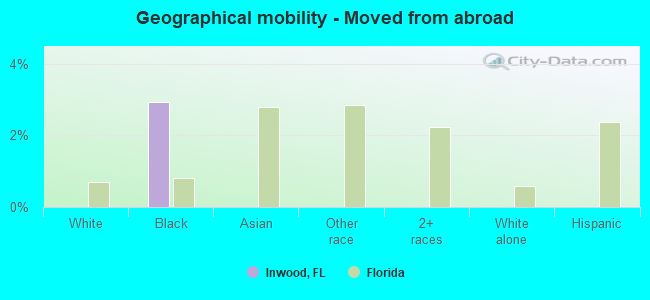
Geographical mobility - Moved from abroad (%)
Geographical mobility - Moved from abroad (%) - White
Geographical mobility - Moved from abroad (%) - Black or African American
Geographical mobility - Moved from abroad (%) - Asian
Geographical mobility - Moved from abroad (%) - Hispanic or Latino
Geographical mobility - Moved from abroad (%) - American Indian and Alaska Native
Geographical mobility - Moved from abroad (%) - Multirace
Geographical mobility - Moved from abroad (%) - Other Race
Place of birth for the foreign-born population - Ireland (%)
Place of birth for the foreign-born population - Denmark (%)
Place of birth for the foreign-born population - Norway (%)
Place of birth for the foreign-born population - Sweden (%)
Place of birth for the foreign-born population - United Kingdom (%)
Place of birth for the foreign-born population - England (%)
Place of birth for the foreign-born population - Scotland (%)
Place of birth for the foreign-born population - Other Northern Europe (%)
Place of birth for the foreign-born population - Austria (%)
Place of birth for the foreign-born population - Belgium (%)
Place of birth for the foreign-born population - France (%)
Place of birth for the foreign-born population - Germany (%)
Place of birth for the foreign-born population - Netherlands (%)
Place of birth for the foreign-born population - Switzerland (%)
Place of birth for the foreign-born population - Other Western Europe (%)
Place of birth for the foreign-born population - Greece (%)
Place of birth for the foreign-born population - Italy (%)
Place of birth for the foreign-born population - Portugal (%)
Place of birth for the foreign-born population - Spain (%)
Place of birth for the foreign-born population - Other Southern Europe (%)
Place of birth for the foreign-born population - Albania (%)
Place of birth for the foreign-born population - Belarus (%)
Place of birth for the foreign-born population - Bosnia and Herzegovina (%)
Place of birth for the foreign-born population - Bulgaria (%)
Place of birth for the foreign-born population - Croatia (%)
Place of birth for the foreign-born population - Czechoslovakia (%)
Place of birth for the foreign-born population - Hungary (%)
Place of birth for the foreign-born population - Latvia (%)
Place of birth for the foreign-born population - Lithuania (%)
Place of birth for the foreign-born population - North Macedonia (Macedonia) (%)
Place of birth for the foreign-born population - Moldova (%)
Place of birth for the foreign-born population - Poland (%)
Place of birth for the foreign-born population - Romania (%)
Place of birth for the foreign-born population - Russia (%)
Place of birth for the foreign-born population - Serbia (%)
Place of birth for the foreign-born population - Ukraine (%)
Place of birth for the foreign-born population - Other Eastern Europe (%)
Place of birth for the foreign-born population - China (%)
Place of birth for the foreign-born population - Hong Kong (%)
Place of birth for the foreign-born population - Taiwan (%)
Place of birth for the foreign-born population - Japan (%)
Place of birth for the foreign-born population - Korea (%)
Place of birth for the foreign-born population - Other Eastern Asia (%)
Place of birth for the foreign-born population - Afghanistan (%)
Place of birth for the foreign-born population - Bangladesh (%)
Place of birth for the foreign-born population - India (%)
Place of birth for the foreign-born population - Iran (%)
Place of birth for the foreign-born population - Kazakhstan (%)
Place of birth for the foreign-born population - Nepal (%)
Place of birth for the foreign-born population - Pakistan (%)
Place of birth for the foreign-born population - Sri Lanka (%)
Place of birth for the foreign-born population - Uzbekistan (%)
Place of birth for the foreign-born population - Other South Central Asia (%)
Place of birth for the foreign-born population - Burma (%)
Place of birth for the foreign-born population - Cambodia (%)
Place of birth for the foreign-born population - Indonesia (%)
Place of birth for the foreign-born population - Laos (%)
Place of birth for the foreign-born population - Malaysia (%)
Place of birth for the foreign-born population - Philippines (%)
Place of birth for the foreign-born population - Singapore (%)
Place of birth for the foreign-born population - Thailand (%)
Place of birth for the foreign-born population - Vietnam (%)
Place of birth for the foreign-born population - Other South Eastern Asia (%)
Place of birth for the foreign-born population - Armenia (%)
Place of birth for the foreign-born population - Iraq (%)
Place of birth for the foreign-born population - Israel (%)
Place of birth for the foreign-born population - Jordan (%)
Place of birth for the foreign-born population - Kuwait (%)
Place of birth for the foreign-born population - Lebanon (%)
Place of birth for the foreign-born population - Saudi Arabia (%)
Place of birth for the foreign-born population - Syria (%)
Place of birth for the foreign-born population - Turkey (%)
Place of birth for the foreign-born population - Yemen (%)
Place of birth for the foreign-born population - Other Western Asia (%)
Place of birth for the foreign-born population - Eritrea (%)
Place of birth for the foreign-born population - Ethiopia (%)
Place of birth for the foreign-born population - Kenya (%)
Place of birth for the foreign-born population - Somalia (%)
Place of birth for the foreign-born population - Uganda (%)
Place of birth for the foreign-born population - Zimbabwe (%)
Place of birth for the foreign-born population - Other Eastern Africa (%)
Place of birth for the foreign-born population - Cameroon (%)
Place of birth for the foreign-born population - Congo (%)
Place of birth for the foreign-born population - Democratic Republic of Congo (Zaire) (%)
Place of birth for the foreign-born population - Other Middle Africa (%)
Place of birth for the foreign-born population - Egypt (%)
Place of birth for the foreign-born population - Morocco (%)
Place of birth for the foreign-born population - Sudan (%)
Place of birth for the foreign-born population - Other Northern Africa (%)
Place of birth for the foreign-born population - South Africa (%)
Place of birth for the foreign-born population - Other Southern Africa (%)
Place of birth for the foreign-born population - Cabo Verde (%)
Place of birth for the foreign-born population - Ghana (%)
Place of birth for the foreign-born population - Liberia (%)
Place of birth for the foreign-born population - Nigeria (%)
Place of birth for the foreign-born population - Senegal (%)
Place of birth for the foreign-born population - Sierra Leone (%)
Place of birth for the foreign-born population - Other Western Africa (%)
Place of birth for the foreign-born population - Australia (%)
Place of birth for the foreign-born population - New Zealand (%)
Place of birth for the foreign-born population - Fiji (%)
Place of birth for the foreign-born population - Micronesia (%)
Place of birth for the foreign-born population - Bahamas (%)
Place of birth for the foreign-born population - Barbados (%)
Place of birth for the foreign-born population - Cuba (%)
Place of birth for the foreign-born population - Dominica (%)
Place of birth for the foreign-born population - Dominican Republic (%)
Place of birth for the foreign-born population - Grenada (%)
Place of birth for the foreign-born population - Haiti (%)
Place of birth for the foreign-born population - Jamaica (%)
Place of birth for the foreign-born population - St. Vincent and the Grenadines (%)
Place of birth for the foreign-born population - Trinidad and Tobago (%)
Place of birth for the foreign-born population - West Indies (%)
Place of birth for the foreign-born population - Other Caribbean (%)
Place of birth for the foreign-born population - Belize (%)
Place of birth for the foreign-born population - Costa Rica (%)
Place of birth for the foreign-born population - El Salvador (%)
Place of birth for the foreign-born population - Guatemala (%)
Place of birth for the foreign-born population - Honduras (%)
Place of birth for the foreign-born population - Mexico (%)
Place of birth for the foreign-born population - Nicaragua (%)
Place of birth for the foreign-born population - Panama (%)
Place of birth for the foreign-born population - Other Central America (%)
Place of birth for the foreign-born population - Argentina (%)
Place of birth for the foreign-born population - Bolivia (%)
Place of birth for the foreign-born population - Brazil (%)
Place of birth for the foreign-born population - Chile (%)
Place of birth for the foreign-born population - Colombia (%)
Place of birth for the foreign-born population - Ecuador (%)
Place of birth for the foreign-born population - Guyana (%)
Place of birth for the foreign-born population - Peru (%)
Place of birth for the foreign-born population - Uruguay (%)
Place of birth for the foreign-born population - Venezuela (%)
Place of birth for the foreign-born population - Other South America (%)
Place of birth for the foreign-born population - Canada (%)
Place of birth for the foreign-born population - Other Northern America (%)
Place of birth for the foreign-born population - Other (%)
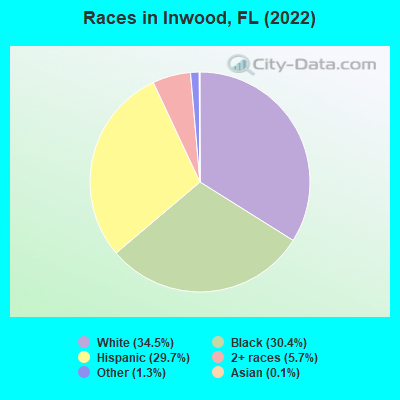
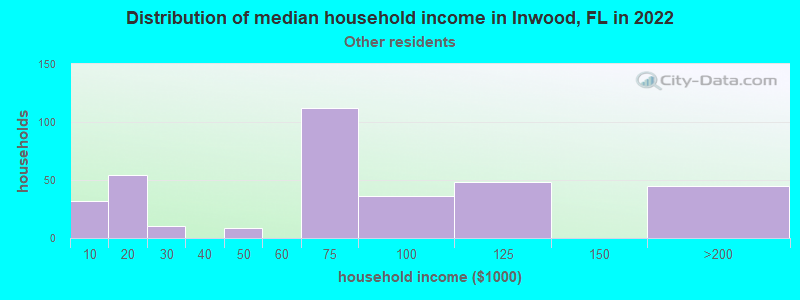
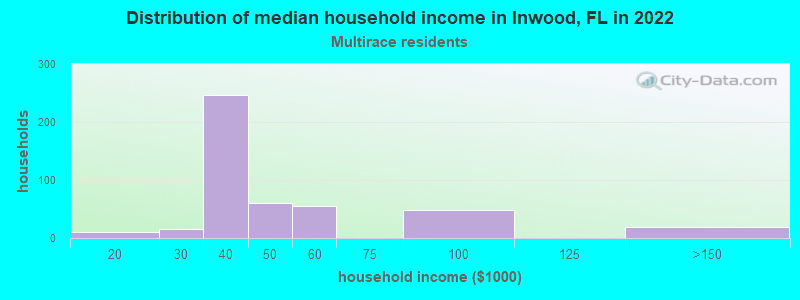
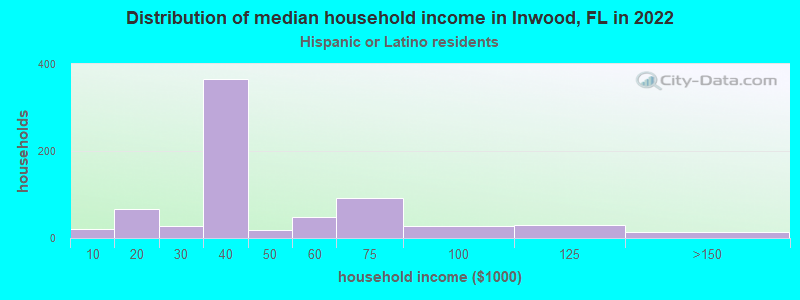
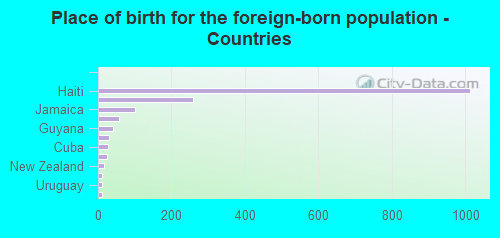
According to 2022 data, the most numerous races in Inwood, FL are White alone (2,606 residents), Hispanic (2,237 residents), and Black alone (2,296 residents). 60.4% of Inwood residents speak English at home. 22.0% of Inwood, FL residents are foreign-born (21.2% born in Latin America), which is 4.3% greater than the foreign-born rate of 21.0% across the entire state of Florida.
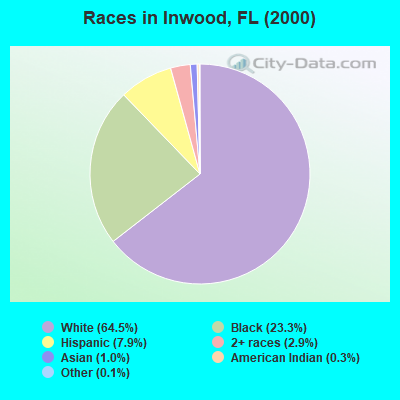
Race distribution in Inwood
2000 2022
10,458,509 65.4% White alone 2,682,715 16.8% Hispanic 2,264,268 14.2% Black alone 261,693 1.6% Asian alone 236,954 1.5% Two or more races 42,358 0.3% American Indian alone 28,994 0.2% Other race alone 6,887 0.04% Native Hawaiian and Other
11,309,403 50.8% White alone 6,025,039 27.1% Hispanic 3,241,015 14.6% Black alone 861,630 3.9% Two or more races 623,692 2.8% Asian alone 152,054 0.7% Other race alone 22,504 0.1% American Indian alone 9,486 0.04% Native Hawaiian and Other
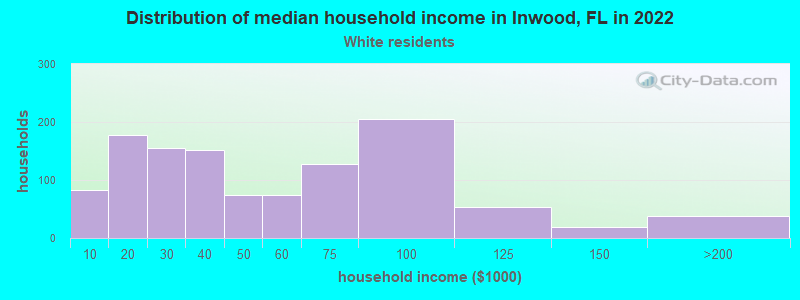
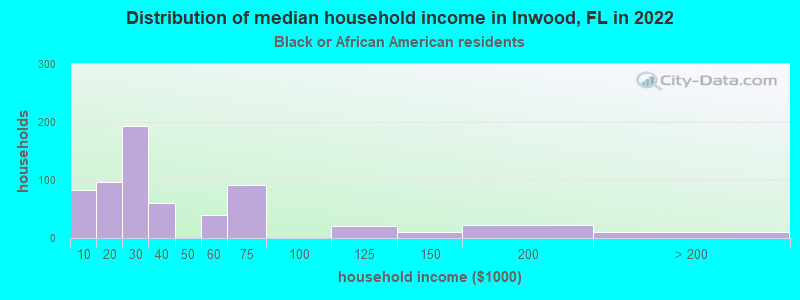
Income and house value in Inwood Median household income in 2022 $43,062 White non-Hispanic householders$26,714 Black householders$74,042 Some other race householders$35,738 Two or more races householders$35,912 Hispanic or Latino race householdersMedian 2022 house value $141,764 White Non-Hispanic householders$163,615 Black or African American householders $78,076 Asian householders$146,560 Some other race householders$174,540 Two or more races householders$148,692 Hispanic or Latino householders
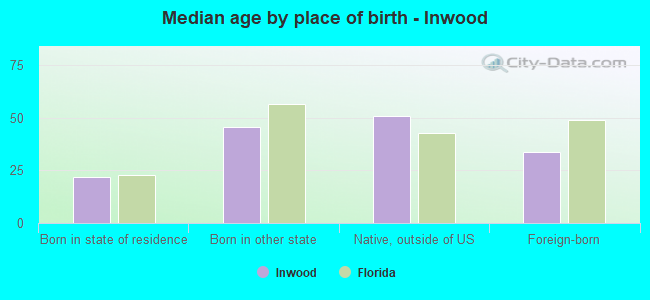
Median age by race in Inwood
37.2 Median age for White residents35.1 38.1 32.8 Median age for Black or African American residents28.0 35.3 -898,856,639.4 Median age for American Indian / Alaska Native residents-899,908,171.7 -834,555,826.4 10.9 Median age for Asian residents-651,924,651.3 10.6 -679,849,340.2 Median age for Native Hawaiian / Pacific Islander residents-858,307,848.3 -443,298,968.6 27.8 Median age for Other race residents18.3 32.2 49.8 Median age for Two or more races residents57.6 45.1 38.3 Median age for White alone residents35.8 43.4 32.8 Median age for Hispanic or Latino residents30.2 35.9
Owner/renter occupied households by race in Inwood
House owners and renters - White residents 829 68.5% Owner occupied381 31.5% Renter occupiedHouse owners and renters - Black or African American residents 362 55.4% Owner occupied291 44.6% Renter occupiedHouse owners and renters - Other race residents 272 74.8% Owner occupied92 25.2% Renter occupiedHouse owners and renters - Two or more races residents 541 86.2% Owner occupied87 13.8% Renter occupiedHouse owners and renters - White alone residents 790 66.2% Owner occupied404 33.8% Renter occupiedHouse owners and renters - Hispanic or Latino residents 613 82.7% Owner occupied128 17.3% Renter occupied
Language usage in Inwood
English speakers - Total 60.4% of residents of Inwood speak English at home.
27.9% of residents speak Spanish at home 822 41.7% Speak English very well1,148 58.3% Speak English less than very well15.0% of residents speak other language at home 307 29.0% Speak English very well753 71.0% Speak English less than very well
English speakers - Born in the United States 85.5% of residents of Inwood speak English at home.
13.5% of residents speak Spanish at home 204 86.4% Speak English very well32 13.6% Speak English less than very well0.6% of residents speak other language at home 11 100.0% Speak English very well
English speakers - Native, born elsewhere 8.2% of residents of Inwood speak English at home.
89.9% of residents speak Spanish at home 192 21.8% Speak English very well687 78.2% Speak English less than very well
English speakers - Foreign-born 27.4% of residents of Inwood speak English at home.
22.5% of residents speak Spanish at home 79 18.5% Speak English very well347 81.5% Speak English less than very well55.1% of residents speak other language at home 219 21.0% Speak English very well823 79.0% Speak English less than very well
White (Caucasian) - Speak only English Native:
93.6% (2,236)Foreign-born:
15.5% (17)
White (Caucasian) - Speak another language Native:
6.2% (147)Foreign-born:
65.7% (71)
Black or African American - Speak only English Native:
95.2% (957)Foreign-born:
28.3% (352)
Black or African American - Speak another language Native:
4.9% (49)Foreign-born:
73.4% (914)
Asian - Speak only English Native:
96.5% (13)Foreign-born:
89.3% (10)
Other race - Speak only English Native:
27.5% (254)Foreign-born:
23.1% (66)
Other race - Speak another language Native:
69.6% (644)Foreign-born:
75.6% (217)
Two or more races - Speak only English Native:
32.1% (478)Foreign-born:
21.4% (48)
Two or more races - Speak another language Native:
69.0% (1,030)Foreign-born:
79.8% (179)
White alone - Speak only English Native:
94.7% (2,214)Foreign-born:
18.2% (18)
White alone - Speak another language Native:
5.3% (123)Foreign-born:
66.7% (67)
Hispanic or Latino - Speak only English Native:
18.6% (311)Foreign-born:
1.1% (4)
Hispanic or Latino - Speak another language Native:
82.0% (1,373)Foreign-born:
98.3% (376)
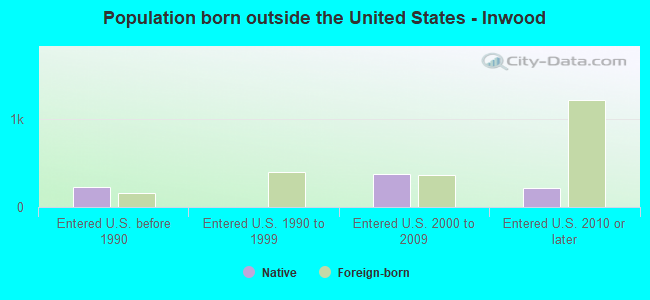
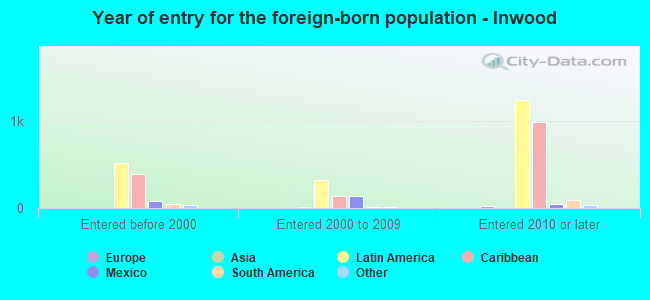
Foreign-born residents in Inwood 1,656 residents are foreign born (21.2% Latin America ).
This city:
22.0%Florida:
21.1%
Marital status for residents in Inwood Marital status - White (Caucasian) population 15 years and over
Males 34.4% Never married38.3% Now married2.2% Separated8.8% Widowed16.2% DivorcedFemales 37.5% Never married38.9% Now married1.5% Separated10.5% Widowed11.6% DivorcedWomen who gave birth in the past 12 months Now married:
70.5% (27)Unmarried:
29.5% (11)
Women who did not give birth in the past 12 months Now married:
30.2% (172)Unmarried:
69.8% (399)
Marital status - Black or African American population 15 years and over
Males 52.9% Never married45.5% Now married0.0% Separated0.0% Widowed1.6% DivorcedFemales 46.6% Never married18.1% Now married4.3% Separated15.0% Widowed16.0% DivorcedWomen who gave birth in the past 12 months Now married:
100.0% (31)Unmarried:
0.0% (0)
Women who did not give birth in the past 12 months Now married:
10.2% (55)Unmarried:
89.8% (485)
Marital status - Other race population 15 years and over
Males 39.0% Never married29.5% Now married6.7% Separated17.3% Widowed7.5% DivorcedFemales 56.6% Never married43.4% Now married0.0% Separated0.0% Widowed0.0% DivorcedWomen who did not give birth in the past 12 months Now married:
42.1% (160)Unmarried:
57.9% (220)
Marital status - Two or more races population 15 years and over
Males 29.5% Never married70.0% Now married0.0% Separated0.4% Widowed0.0% DivorcedFemales 33.7% Never married59.2% Now married0.0% Separated4.4% Widowed2.7% DivorcedWomen who did not give birth in the past 12 months Now married:
22.4% (81)Unmarried:
77.6% (280)
Marital status - White alone, not Hispanic / Latino population 15 years and over
Males 33.2% Never married37.7% Now married2.4% Separated9.1% Widowed17.7% DivorcedFemales 36.6% Never married38.9% Now married1.6% Separated11.4% Widowed11.4% DivorcedWomen who gave birth in the past 12 months Now married:
0.0% (0)Unmarried:
100.0% (13)
Women who did not give birth in the past 12 months Now married:
32.2% (199)Unmarried:
67.8% (419)
Marital status - Hispanic or Latino population 15 years and over
Males 33.2% Never married51.8% Now married3.0% Separated8.6% Widowed3.4% DivorcedFemales 30.3% Never married64.9% Now married0.0% Separated1.4% Widowed3.4% DivorcedWomen who gave birth in the past 12 months Now married:
100.0% (37)Unmarried:
0.0% (0)
Women who did not give birth in the past 12 months Now married:
41.4% (167)Unmarried:
58.6% (236)
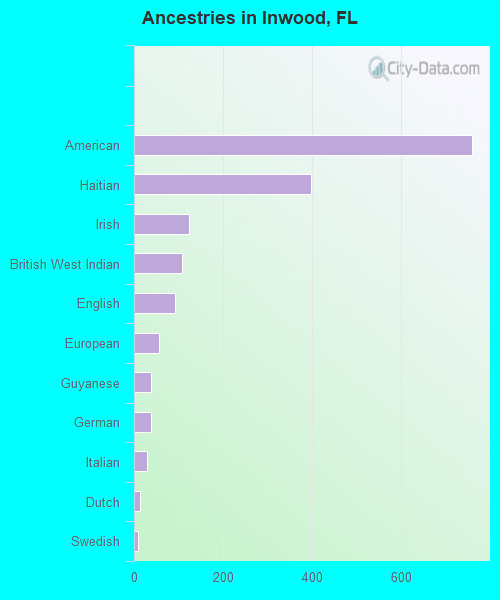
Ancestries in Inwood
759 20.8% American398 10.9% Haitian124 3.4% Irish108 3.0% British West Indian92 2.5% English56 1.5% European39 1.1% Guyanese38 1.0% German30 0.8% Italian14 0.4% Dutch8 0.2% Swedish
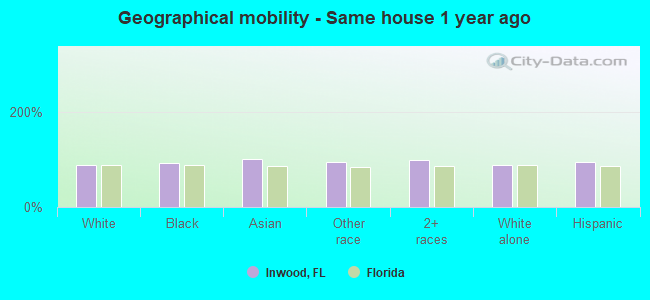
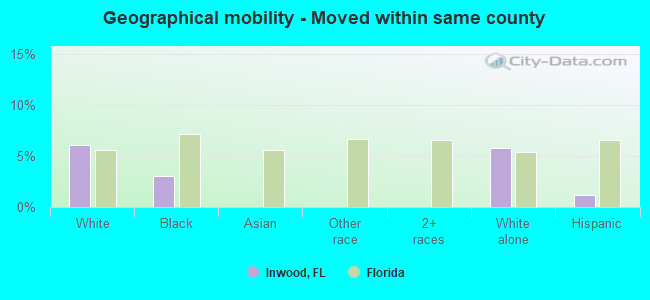
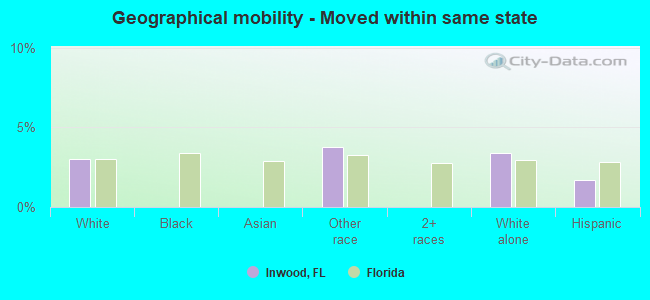
Geographical mobility in Inwood Same house 1 year ago 2,298 87.5% White (Caucasian)2,141 93.4% Black or African American38 100.0% Asian1,292 95.3% Other race1,713 99.2% Two or more races2,239 87.0% White alone, not Hispanic / Latino2,098 95.2% Hispanic or LatinoMoved within same county 159 6.0% White / Caucasian69 3.0% Black or African American148 5.8% White alone, not Hispanic / Latino26 1.2% Hispanic or LatinoMoved within same state 80 3.0% White / Caucasian51 3.8% Other race87 3.4% White alone, not Hispanic / Latino37 1.7% Hispanic or LatinoMoved from different state 90 3.4% White / Caucasian19 0.8% Black or African American12 0.7% Two or more races93 3.6% White alone, not Hispanic / Latino18 0.8% Hispanic or LatinoMoved from abroad 67 2.9% Black or African American
Children Nativity (place of birth) in Inwood
Children under 6 years - Living with two parents Both parents native 189 100.0% NativeBoth parents foreign-born 158 100.0% NativeOne native, one foreign-born parent 15 100.0% NativeChildren under 6 years - Living with one parent Native parent 72 100.0% NativeForeign-born parent 34 53.7% Native30 46.3% Foreign-bornChildren 6 to 17 years - Living with two parents Both parents native 347 99.8% Native1 0.2% Foreign-bornBoth parents foreign-born 105 74.1% Native37 25.9% Foreign-bornOne native, one foreign-born parent 11 100.0% NativeChildren 6 to 17 years - Living with one parent Native parent 462 100.0% NativeForeign-born parent 82 68.9% Native37 31.1% Foreign-born
Grandparents responsible for own grandchildren in Inwood
Grandparents (30 to 59 years) White / Caucasian 18 30.5% Responsible for grandchildren40 69.5% Not responsible for grandchildrenBlack or African American 48 100.0% Not responsible for grandchildrenOther race 39 100.0% Responsible for grandchildrenWhite alone, not Hispanic / Latino 21 48.2% Responsible for grandchildren22 51.8% Not responsible for grandchildrenHispanic or Latino 17 17.3% Responsible for grandchildren82 82.7% Not responsible for grandchildrenGrandparents (60 years and over) White / Caucasian 100 100.0% Not responsible for grandchildrenBlack or African American 130 44.7% Responsible for grandchildren160 55.3% Not responsible for grandchildrenWhite alone, not Hispanic / Latino 104 100.0% Not responsible for grandchildrenHispanic or Latino 9 100.0% Not responsible for grandchildren