Races in Irmo, South Carolina (SC) Detailed Stats
Data:
Races - White alone (%)
Races - White alone (% change since 2000)
Races - Black alone (%)
Races - Black alone (% change since 2000)
Races - American Indian alone (%)
Races - American Indian alone (% change since 2000)
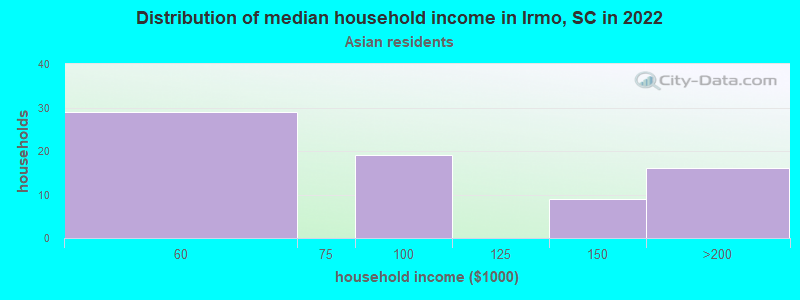
Races - Asian alone (%)
Races - Asian alone (% change since 2000)
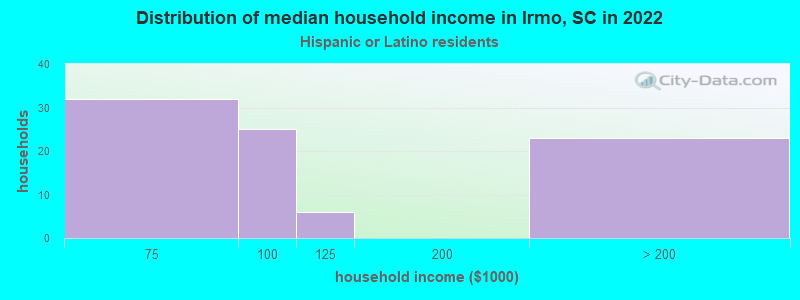
Races - Hispanic (%)
Races - Hispanic (% change since 2000)
Races - Native Hawaiian and Other Pacific Islander alone (%)
Races - Native Hawaiian and Other Pacific Islander alone (% change since 2000)
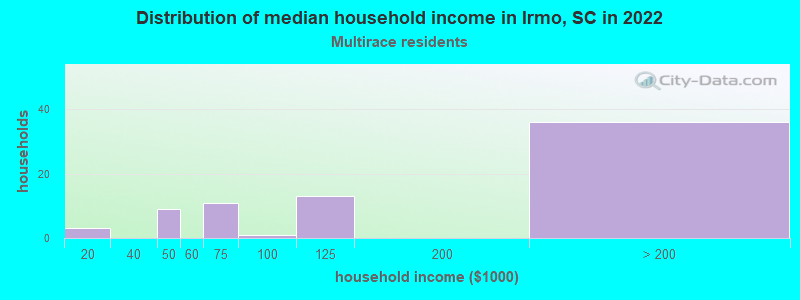
Races - Two or more races(%)
Races - Two or more races(% change since 2000)
Races - Other race alone (%)
Races - Other race alone (% change since 2000)
Racial diversity
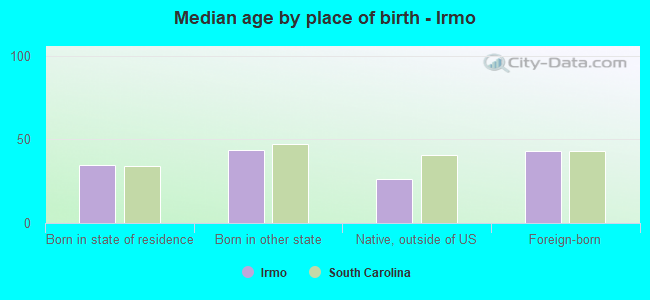
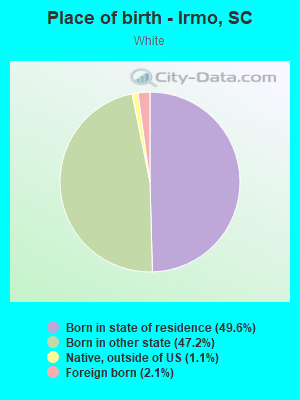
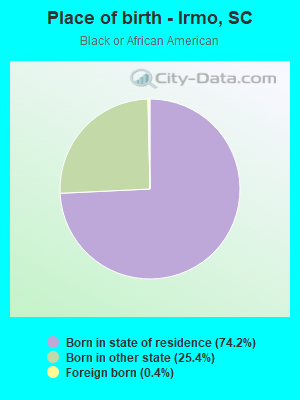
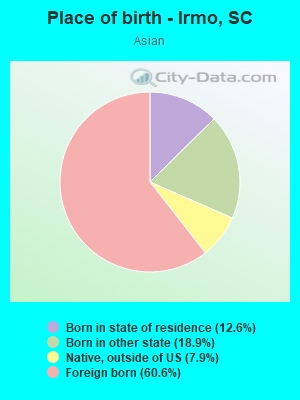
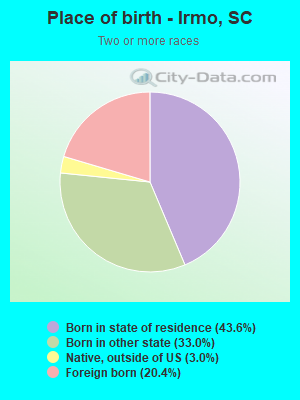
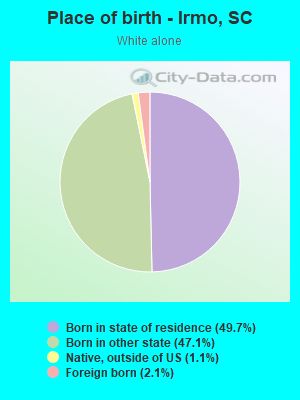
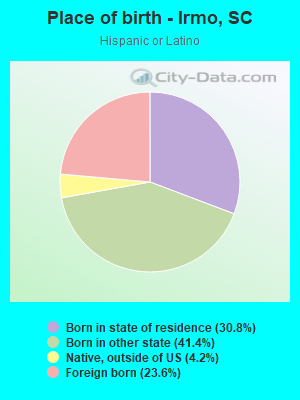
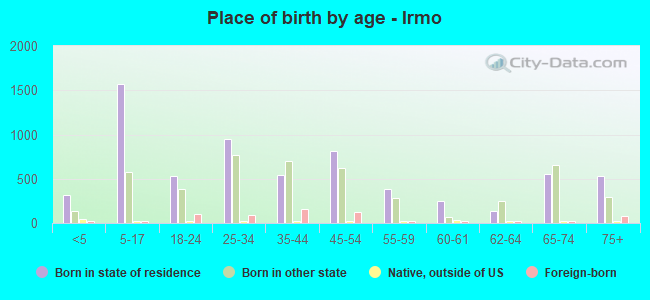
Place of birth - Born in state of residence (%)
Place of birth - Born in state of residence (%) - White
Place of birth - Born in state of residence (%) - Black or African American
Place of birth - Born in state of residence (%) - Asian
Place of birth - Born in state of residence (%) - Hispanic or Latino
Place of birth - Born in state of residence (%) - American Indian and Alaska Native
Place of birth - Born in state of residence (%) - Multirace
Place of birth - Born in state of residence (%) - Other Race
Place of birth - Born in other state (%)
Place of birth - Born in other state (%) - White
Place of birth - Born in other state (%) - Black or African American
Place of birth - Born in other state (%) - Asian
Place of birth - Born in other state (%) - Hispanic or Latino
Place of birth - Born in other state (%) - American Indian and Alaska Native
Place of birth - Born in other state (%) - Multirace
Place of birth - Born in other state (%) - Other Race
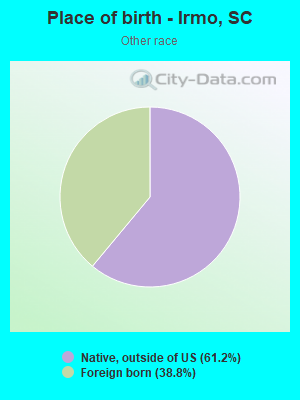
Place of birth - Native, outside of US (%)
Place of birth - Native, outside of US (%) - White
Place of birth - Native, outside of US (%) - Black or African American
Place of birth - Native, outside of US (%) - Asian
Place of birth - Native, outside of US (%) - Hispanic or Latino
Place of birth - Native, outside of US (%) - American Indian and Alaska Native
Place of birth - Native, outside of US (%) - Multirace
Place of birth - Native, outside of US (%) - Other Race
Place of birth - Foreign born (%)
Place of birth - Foreign born (%) - White
Place of birth - Foreign born (%) - Black or African American
Place of birth - Foreign born (%) - Asian
Place of birth - Foreign born (%) - Hispanic or Latino
Place of birth - Foreign born (%) - American Indian and Alaska Native
Place of birth - Foreign born (%) - Multirace
Place of birth - Foreign born (%) - Other Race
Residents speaking English at home (%)
Residents speaking English at home - Born in the United States (%)
Residents speaking English at home - Native, born elsewhere (%)
Residents speaking English at home - Foreign born (%)
Residents speaking Spanish at home (%)
Residents speaking Spanish at home - Born in the United States (%)
Residents speaking Spanish at home - Native, born elsewhere (%)
Residents speaking Spanish at home - Foreign born (%)
Residents speaking other language at home (%)
Residents speaking other language at home - Born in the United States (%)
Residents speaking other language at home - Native, born elsewhere (%)
Residents speaking other language at home - Foreign born (%)
Marital status - Never married (%)
Marital status - Now married (%)
Marital status - Separated (%)
Marital status - Widowed (%)
Marital status - Divorced (%)
Ancestries Reported - Arab (%)
Ancestries Reported - Czech (%)
Ancestries Reported - Danish (%)
Ancestries Reported - Dutch (%)
Ancestries Reported - English (%)
Ancestries Reported - French (%)
Ancestries Reported - French Canadian (%)
Ancestries Reported - German (%)
Ancestries Reported - Greek (%)
Ancestries Reported - Hungarian (%)
Ancestries Reported - Irish (%)
Ancestries Reported - Italian (%)
Ancestries Reported - Lithuanian (%)
Ancestries Reported - Norwegian (%)
Ancestries Reported - Polish (%)
Ancestries Reported - Portuguese (%)
Ancestries Reported - Russian (%)
Ancestries Reported - Scotch-Irish (%)
Ancestries Reported - Scottish (%)
Ancestries Reported - Slovak (%)
Ancestries Reported - Subsaharan African (%)
Ancestries Reported - Swedish (%)
Ancestries Reported - Swiss (%)
Ancestries Reported - Ukrainian (%)
Ancestries Reported - United States (%)
Ancestries Reported - Welsh (%)
Ancestries Reported - West Indian (%)
Ancestries Reported - Other (%)
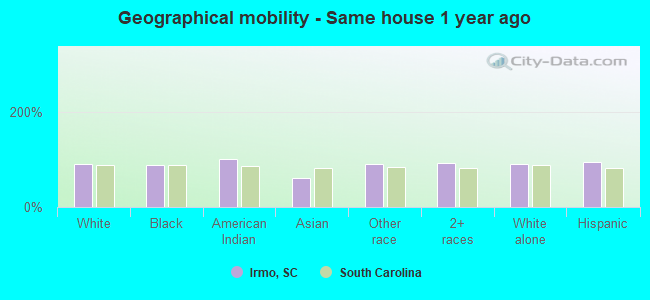
Geographical mobility - Same house 1 year ago (%)
Geographical mobility - Same house 1 year ago (%) - White
Geographical mobility - Same house 1 year ago (%) - Black or African American
Geographical mobility - Same house 1 year ago (%) - Asian
Geographical mobility - Same house 1 year ago (%) - Hispanic or Latino
Geographical mobility - Same house 1 year ago (%) - American Indian and Alaska Native
Geographical mobility - Same house 1 year ago (%) - Multirace
Geographical mobility - Same house 1 year ago (%) - Other Race
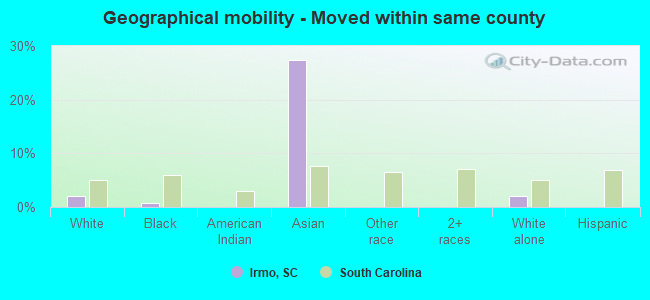
Geographical mobility - Moved within same county (%)
Geographical mobility - Moved within same county (%) - White
Geographical mobility - Moved within same county (%) - Black or African American
Geographical mobility - Moved within same county (%) - Asian
Geographical mobility - Moved within same county (%) - Hispanic or Latino
Geographical mobility - Moved within same county (%) - American Indian and Alaska Native
Geographical mobility - Moved within same county (%) - Multirace
Geographical mobility - Moved within same county (%) - Other Race
Geographical mobility - Moved from different county within same state (%)
Geographical mobility - Moved from different county within same state (%) - White
Geographical mobility - Moved from different county within same state (%) - Black or African American
Geographical mobility - Moved from different county within same state (%) - Asian
Geographical mobility - Moved from different county within same state (%) - Hispanic or Latino
Geographical mobility - Moved from different county within same state (%) - American Indian and Alaska Native
Geographical mobility - Moved from different county within same state (%) - Multirace
Geographical mobility - Moved from different county within same state (%) - Other Race
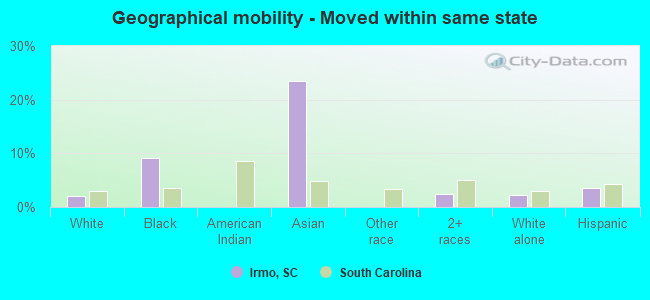
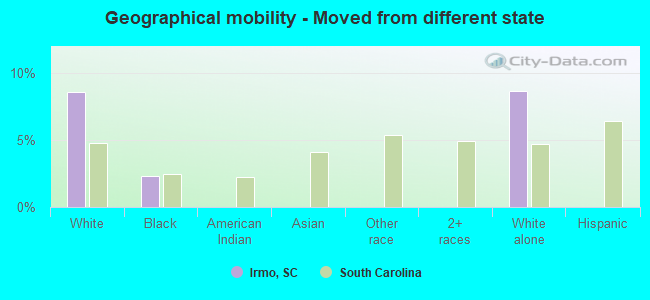
Geographical mobility - Moved from different state (%)
Geographical mobility - Moved from different state (%) - White
Geographical mobility - Moved from different state (%) - Black or African American
Geographical mobility - Moved from different state (%) - Asian
Geographical mobility - Moved from different state (%) - Hispanic or Latino
Geographical mobility - Moved from different state (%) - American Indian and Alaska Native
Geographical mobility - Moved from different state (%) - Multirace
Geographical mobility - Moved from different state (%) - Other Race
Geographical mobility - Moved from abroad (%)
Geographical mobility - Moved from abroad (%) - White
Geographical mobility - Moved from abroad (%) - Black or African American
Geographical mobility - Moved from abroad (%) - Asian
Geographical mobility - Moved from abroad (%) - Hispanic or Latino
Geographical mobility - Moved from abroad (%) - American Indian and Alaska Native
Geographical mobility - Moved from abroad (%) - Multirace
Geographical mobility - Moved from abroad (%) - Other Race
Place of birth for the foreign-born population - Ireland (%)
Place of birth for the foreign-born population - Denmark (%)
Place of birth for the foreign-born population - Norway (%)
Place of birth for the foreign-born population - Sweden (%)
Place of birth for the foreign-born population - United Kingdom (%)
Place of birth for the foreign-born population - England (%)
Place of birth for the foreign-born population - Scotland (%)
Place of birth for the foreign-born population - Other Northern Europe (%)
Place of birth for the foreign-born population - Austria (%)
Place of birth for the foreign-born population - Belgium (%)
Place of birth for the foreign-born population - France (%)
Place of birth for the foreign-born population - Germany (%)
Place of birth for the foreign-born population - Netherlands (%)
Place of birth for the foreign-born population - Switzerland (%)
Place of birth for the foreign-born population - Other Western Europe (%)
Place of birth for the foreign-born population - Greece (%)
Place of birth for the foreign-born population - Italy (%)
Place of birth for the foreign-born population - Portugal (%)
Place of birth for the foreign-born population - Spain (%)
Place of birth for the foreign-born population - Other Southern Europe (%)
Place of birth for the foreign-born population - Albania (%)
Place of birth for the foreign-born population - Belarus (%)
Place of birth for the foreign-born population - Bosnia and Herzegovina (%)
Place of birth for the foreign-born population - Bulgaria (%)
Place of birth for the foreign-born population - Croatia (%)
Place of birth for the foreign-born population - Czechoslovakia (%)
Place of birth for the foreign-born population - Hungary (%)
Place of birth for the foreign-born population - Latvia (%)
Place of birth for the foreign-born population - Lithuania (%)
Place of birth for the foreign-born population - North Macedonia (Macedonia) (%)
Place of birth for the foreign-born population - Moldova (%)
Place of birth for the foreign-born population - Poland (%)
Place of birth for the foreign-born population - Romania (%)
Place of birth for the foreign-born population - Russia (%)
Place of birth for the foreign-born population - Serbia (%)
Place of birth for the foreign-born population - Ukraine (%)
Place of birth for the foreign-born population - Other Eastern Europe (%)
Place of birth for the foreign-born population - China (%)
Place of birth for the foreign-born population - Hong Kong (%)
Place of birth for the foreign-born population - Taiwan (%)
Place of birth for the foreign-born population - Japan (%)
Place of birth for the foreign-born population - Korea (%)
Place of birth for the foreign-born population - Other Eastern Asia (%)
Place of birth for the foreign-born population - Afghanistan (%)
Place of birth for the foreign-born population - Bangladesh (%)
Place of birth for the foreign-born population - India (%)
Place of birth for the foreign-born population - Iran (%)
Place of birth for the foreign-born population - Kazakhstan (%)
Place of birth for the foreign-born population - Nepal (%)
Place of birth for the foreign-born population - Pakistan (%)
Place of birth for the foreign-born population - Sri Lanka (%)
Place of birth for the foreign-born population - Uzbekistan (%)
Place of birth for the foreign-born population - Other South Central Asia (%)
Place of birth for the foreign-born population - Burma (%)
Place of birth for the foreign-born population - Cambodia (%)
Place of birth for the foreign-born population - Indonesia (%)
Place of birth for the foreign-born population - Laos (%)
Place of birth for the foreign-born population - Malaysia (%)
Place of birth for the foreign-born population - Philippines (%)
Place of birth for the foreign-born population - Singapore (%)
Place of birth for the foreign-born population - Thailand (%)
Place of birth for the foreign-born population - Vietnam (%)
Place of birth for the foreign-born population - Other South Eastern Asia (%)
Place of birth for the foreign-born population - Armenia (%)
Place of birth for the foreign-born population - Iraq (%)
Place of birth for the foreign-born population - Israel (%)
Place of birth for the foreign-born population - Jordan (%)
Place of birth for the foreign-born population - Kuwait (%)
Place of birth for the foreign-born population - Lebanon (%)
Place of birth for the foreign-born population - Saudi Arabia (%)
Place of birth for the foreign-born population - Syria (%)
Place of birth for the foreign-born population - Turkey (%)
Place of birth for the foreign-born population - Yemen (%)
Place of birth for the foreign-born population - Other Western Asia (%)
Place of birth for the foreign-born population - Eritrea (%)
Place of birth for the foreign-born population - Ethiopia (%)
Place of birth for the foreign-born population - Kenya (%)
Place of birth for the foreign-born population - Somalia (%)
Place of birth for the foreign-born population - Uganda (%)
Place of birth for the foreign-born population - Zimbabwe (%)
Place of birth for the foreign-born population - Other Eastern Africa (%)
Place of birth for the foreign-born population - Cameroon (%)
Place of birth for the foreign-born population - Congo (%)
Place of birth for the foreign-born population - Democratic Republic of Congo (Zaire) (%)
Place of birth for the foreign-born population - Other Middle Africa (%)
Place of birth for the foreign-born population - Egypt (%)
Place of birth for the foreign-born population - Morocco (%)
Place of birth for the foreign-born population - Sudan (%)
Place of birth for the foreign-born population - Other Northern Africa (%)
Place of birth for the foreign-born population - South Africa (%)
Place of birth for the foreign-born population - Other Southern Africa (%)
Place of birth for the foreign-born population - Cabo Verde (%)
Place of birth for the foreign-born population - Ghana (%)
Place of birth for the foreign-born population - Liberia (%)
Place of birth for the foreign-born population - Nigeria (%)
Place of birth for the foreign-born population - Senegal (%)
Place of birth for the foreign-born population - Sierra Leone (%)
Place of birth for the foreign-born population - Other Western Africa (%)
Place of birth for the foreign-born population - Australia (%)
Place of birth for the foreign-born population - New Zealand (%)
Place of birth for the foreign-born population - Fiji (%)
Place of birth for the foreign-born population - Micronesia (%)
Place of birth for the foreign-born population - Bahamas (%)
Place of birth for the foreign-born population - Barbados (%)
Place of birth for the foreign-born population - Cuba (%)
Place of birth for the foreign-born population - Dominica (%)
Place of birth for the foreign-born population - Dominican Republic (%)
Place of birth for the foreign-born population - Grenada (%)
Place of birth for the foreign-born population - Haiti (%)
Place of birth for the foreign-born population - Jamaica (%)
Place of birth for the foreign-born population - St. Vincent and the Grenadines (%)
Place of birth for the foreign-born population - Trinidad and Tobago (%)
Place of birth for the foreign-born population - West Indies (%)
Place of birth for the foreign-born population - Other Caribbean (%)
Place of birth for the foreign-born population - Belize (%)
Place of birth for the foreign-born population - Costa Rica (%)
Place of birth for the foreign-born population - El Salvador (%)
Place of birth for the foreign-born population - Guatemala (%)
Place of birth for the foreign-born population - Honduras (%)
Place of birth for the foreign-born population - Mexico (%)
Place of birth for the foreign-born population - Nicaragua (%)
Place of birth for the foreign-born population - Panama (%)
Place of birth for the foreign-born population - Other Central America (%)
Place of birth for the foreign-born population - Argentina (%)
Place of birth for the foreign-born population - Bolivia (%)
Place of birth for the foreign-born population - Brazil (%)
Place of birth for the foreign-born population - Chile (%)
Place of birth for the foreign-born population - Colombia (%)
Place of birth for the foreign-born population - Ecuador (%)
Place of birth for the foreign-born population - Guyana (%)
Place of birth for the foreign-born population - Peru (%)
Place of birth for the foreign-born population - Uruguay (%)
Place of birth for the foreign-born population - Venezuela (%)
Place of birth for the foreign-born population - Other South America (%)
Place of birth for the foreign-born population - Canada (%)
Place of birth for the foreign-born population - Other Northern America (%)
Place of birth for the foreign-born population - Other (%)
Latest news about races in Irmo, SC collected exclusively by city-data.com from local newspapers, TV, and radio stations
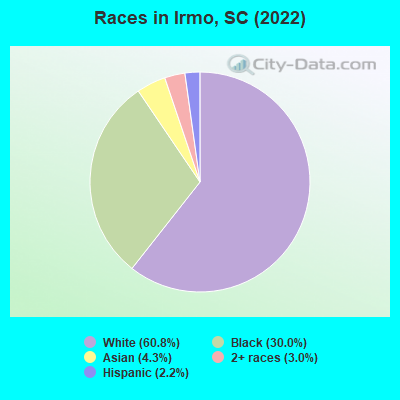
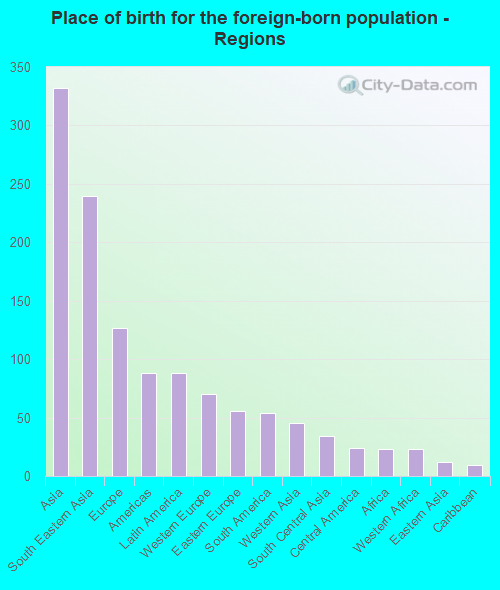
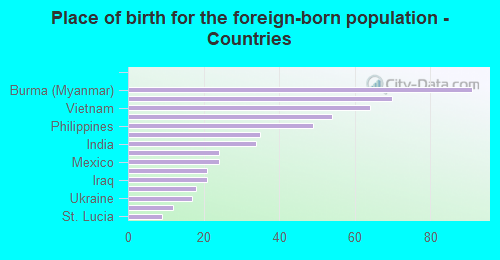
According to 2022 data, the most numerous races in Irmo, SC are White alone (7,312 residents), Black alone (3,609 residents), and Hispanic (269 residents). 91.9% of Irmo residents speak English at home. 4.7% of Irmo, SC residents are foreign-born (2.8% born in Asia, 1.1% born in Europe, 0.7% born in Latin America), which is 5.4% less than the foreign-born rate of 5.0% across the entire state of South Carolina.
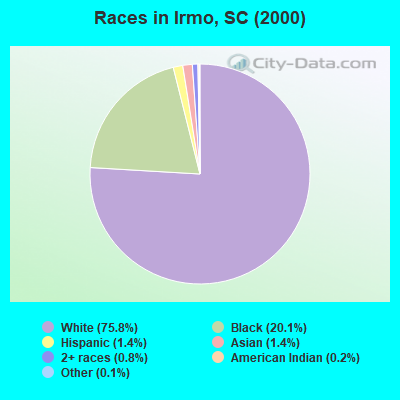
Race distribution in Irmo
2000 2022
2,652,291 66.1% White alone 1,178,486 29.4% Black alone 95,076 2.4% Hispanic 35,568 0.9% Asian alone 33,290 0.8% Two or more races 12,765 0.3% American Indian alone 3,266 0.08% Other race alone 1,270 0.03% Native Hawaiian and Other
3,301,739 62.5% White alone 1,313,290 24.9% Black alone 343,783 6.5% Hispanic 190,508 3.6% Two or more races 89,888 1.7% Asian alone 29,390 0.6% Other race alone 12,112 0.2% American Indian alone 1,924 0.04% Native Hawaiian and Other
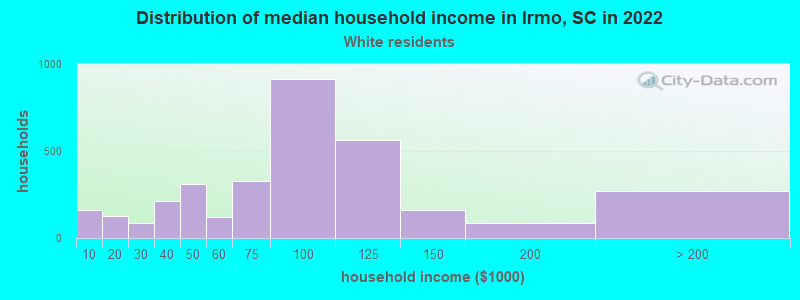
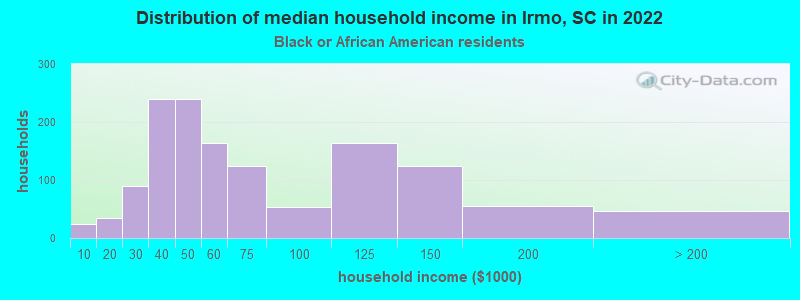
Income and house value in Irmo Median household income in 2022 $84,351 White non-Hispanic householders$56,858 Black householders$96,402 Asian householdersover $200,000 Two or more races householdersMedian 2022 house value $191,558 White Non-Hispanic householders$183,255 Black or African American householders $193,583 Asian householders$329,050 Native Hawaiian and other Pacific Islander householders$111,371 Some other race householders$227,804 Two or more races householders$120,280 Hispanic or Latino householders
Median age by race in Irmo
40.5 Median age for White residents39.5 42.0 37.0 Median age for Black or African American residents32.8 43.3 -984,126,983.1 Median age for American Indian / Alaska Native residents-878,787,877.9 -1,034,343,433.3 25.5 Median age for Asian residents27.8 25.1 -698,412,697.7 Median age for Native Hawaiian / Pacific Islander residents-551,574,375.1 -666,666,666.0 -676,954,731.8 Median age for Other race residents-647,342,994.5 -831,275,719.3 22.6 Median age for Two or more races residents18.5 30.4 40.9 Median age for White alone residents40.0 41.7 29.5 Median age for Hispanic or Latino residents30.3 29.4
Owner/renter occupied households by race in Irmo
House owners and renters - White residents 2,838 87.9% Owner occupied391 12.1% Renter occupiedHouse owners and renters - Black or African American residents 894 61.8% Owner occupied552 38.2% Renter occupiedHouse owners and renters - American Indian / Alaska Native residents 6 100.0% Owner occupiedHouse owners and renters - Asian residents 56 79.5% Owner occupied14 20.5% Renter occupiedHouse owners and renters - Other race residents 4 100.0% Owner occupiedHouse owners and renters - Two or more races residents 76 100.0% Owner occupiedHouse owners and renters - White alone residents 2,824 87.9% Owner occupied390 12.1% Renter occupiedHouse owners and renters - Hispanic or Latino residents 61 100.0% Owner occupied
Language usage in Irmo
English speakers - Total 91.9% of residents of Irmo speak English at home.
1.9% of residents speak Spanish at home 176 81.5% Speak English very well40 18.5% Speak English less than very well5.6% of residents speak other language at home 487 74.7% Speak English very well165 25.3% Speak English less than very well
English speakers - Born in the United States 94.5% of residents of Irmo speak English at home.
0.7% of residents speak Spanish at home 31 100.0% Speak English very well3.7% of residents speak other language at home 105 61.8% Speak English very well65 38.2% Speak English less than very well
English speakers - Native, born elsewhere 61.7% of residents of Irmo speak English at home.
10.3% of residents speak Spanish at home 11 100.0% Speak English very well16.8% of residents speak other language at home 18 100.0% Speak English very well
English speakers - Foreign-born 16.0% of residents of Irmo speak English at home.
17.7% of residents speak Spanish at home 66 63.5% Speak English very well38 36.5% Speak English less than very well62.2% of residents speak other language at home 260 71.2% Speak English very well105 28.8% Speak English less than very well
White (Caucasian) - Speak only English Native:
97.3% (6,855)Foreign-born:
41.2% (64)
White (Caucasian) - Speak another language Native:
2.6% (187)Foreign-born:
56.1% (88)
Black or African American - Speak only English Native:
98.8% (3,388)Foreign-born:
87.3% (12)
Asian - Speak only English Native:
11.3% (20)Foreign-born:
7.1% (21)
Asian - Speak another language Native:
100.0% (173)Foreign-born:
96.3% (283)
Other race - Speak another language Native:
78.8% (7)Foreign-born:
100.0% (6)
Two or more races - Speak another language Native:
13.8% (56)Foreign-born:
100.0% (112)
White alone - Speak only English Native:
97.5% (6,773)Foreign-born:
49.2% (75)
White alone - Speak another language Native:
2.6% (181)Foreign-born:
51.1% (78)
Hispanic or Latino - Speak another language Native:
31.6% (64)Foreign-born:
100.0% (63)
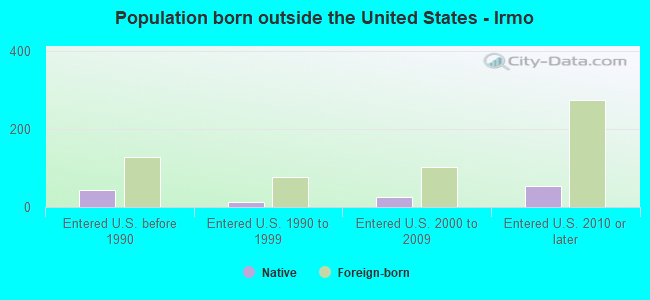
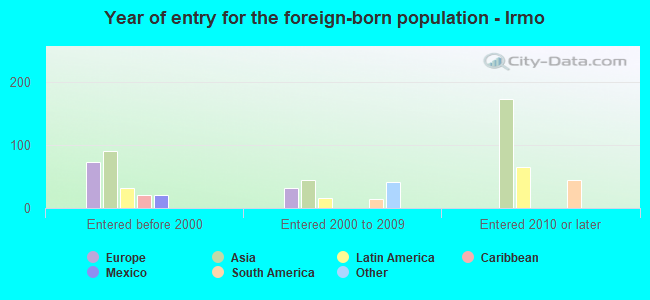
Foreign-born residents in Irmo 571 residents are foreign born (2.8% Asia , 1.1% Europe , 0.7% Latin America ).
This city:
4.7%South Carolina:
5.3%
Marital status for residents in Irmo Marital status - White (Caucasian) population 15 years and over
Males 25.2% Never married65.5% Now married0.3% Separated1.9% Widowed7.1% DivorcedFemales 22.4% Never married55.8% Now married1.5% Separated7.7% Widowed12.6% DivorcedWomen who gave birth in the past 12 months Now married:
100.0% (73)Unmarried:
0.0% (0)
Women who did not give birth in the past 12 months Now married:
53.3% (865)Unmarried:
46.7% (757)
Marital status - Black or African American population 15 years and over
Males 55.2% Never married34.2% Now married0.0% Separated0.0% Widowed10.6% DivorcedFemales 37.8% Never married40.6% Now married2.7% Separated4.2% Widowed14.6% DivorcedWomen who did not give birth in the past 12 months Now married:
32.1% (246)Unmarried:
67.9% (521)
Marital status - Asian population 15 years and over
Males 21.2% Never married78.8% Now married0.0% Separated0.0% Widowed0.0% DivorcedFemales 56.5% Never married38.0% Now married0.0% Separated5.5% Widowed0.0% DivorcedWomen who did not give birth in the past 12 months Now married:
40.2% (84)Unmarried:
59.8% (125)
Marital status - Two or more races population 15 years and over
Males 43.2% Never married51.6% Now married0.0% Separated0.0% Widowed5.3% DivorcedFemales 30.7% Never married61.9% Now married0.0% Separated0.0% Widowed7.4% DivorcedWomen who did not give birth in the past 12 months Now married:
49.7% (74)Unmarried:
50.3% (75)
Marital status - White alone, not Hispanic / Latino population 15 years and over
Males 25.2% Never married66.5% Now married0.3% Separated0.8% Widowed7.2% DivorcedFemales 22.5% Never married56.2% Now married1.5% Separated7.7% Widowed12.1% DivorcedWomen who gave birth in the past 12 months Now married:
100.0% (73)Unmarried:
0.0% (0)
Women who did not give birth in the past 12 months Now married:
53.9% (864)Unmarried:
46.1% (739)
Marital status - Hispanic or Latino population 15 years and over
Males 31.9% Never married40.5% Now married0.0% Separated27.6% Widowed0.0% DivorcedFemales 30.8% Never married46.2% Now married0.0% Separated0.0% Widowed23.1% DivorcedWomen who did not give birth in the past 12 months Now married:
46.2% (41)Unmarried:
53.8% (48)
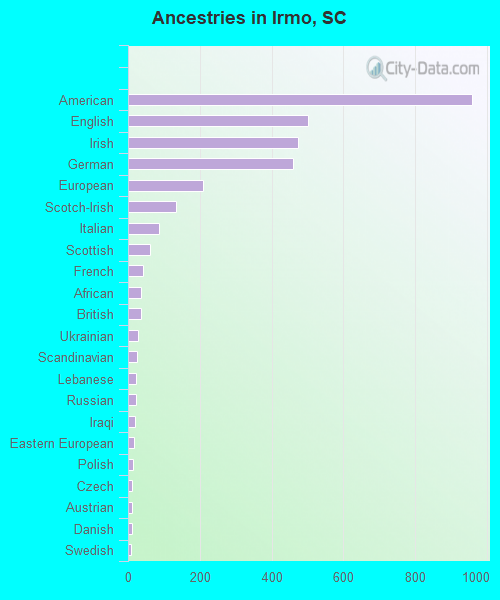
Ancestries in Irmo
958 17.2% American502 9.0% English475 8.5% Irish460 8.3% German209 3.8% European135 2.4% Scotch-Irish86 1.5% Italian62 1.1% Scottish43 0.8% French36 0.6% African35 0.6% British27 0.5% Ukrainian25 0.4% Scandinavian21 0.4% Lebanese21 0.4% Russian20 0.4% Iraqi18 0.3% Eastern European14 0.3% Polish12 0.2% Czech10 0.2% Austrian10 0.2% Danish9 0.2% Swedish
Children Nativity (place of birth) in Irmo
Children under 6 years - Living with two parents Both parents native 390 100.0% NativeBoth parents foreign-born 70 100.0% NativeChildren under 6 years - Living with one parent Native parent 151 100.0% Native
Children 6 to 17 years - Living with two parents Both parents native 895 100.0% NativeBoth parents foreign-born 162 100.0% NativeChildren 6 to 17 years - Living with one parent Native parent 819 100.0% Native
Grandparents responsible for own grandchildren in Irmo
Grandparents (30 to 59 years) White / Caucasian 22 100.0% Not responsible for grandchildrenBlack or African American 64 100.0% Not responsible for grandchildrenAsian 10 44.6% Responsible for grandchildren13 55.4% Not responsible for grandchildrenWhite alone, not Hispanic / Latino 14 100.0% Not responsible for grandchildrenHispanic or Latino 21 100.0% Not responsible for grandchildrenGrandparents (60 years and over) White / Caucasian 61 60.8% Responsible for grandchildren39 39.2% Not responsible for grandchildrenBlack or African American 36 100.0% Not responsible for grandchildrenAsian 12 100.0% Not responsible for grandchildrenWhite alone, not Hispanic / Latino 62 61.9% Responsible for grandchildren39 38.1% Not responsible for grandchildren