Races in Iselin, New Jersey (NJ) Detailed Stats
Data:
Races - White alone (%)
Races - White alone (% change since 2000)
Races - Black alone (%)
Races - Black alone (% change since 2000)
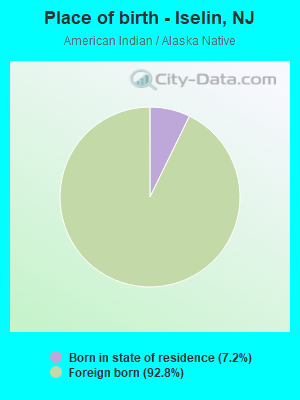
Races - American Indian alone (%)
Races - American Indian alone (% change since 2000)
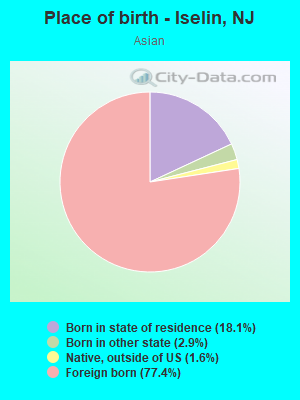
Races - Asian alone (%)
Races - Asian alone (% change since 2000)
Races - Hispanic (%)
Races - Hispanic (% change since 2000)
Races - Native Hawaiian and Other Pacific Islander alone (%)
Races - Native Hawaiian and Other Pacific Islander alone (% change since 2000)
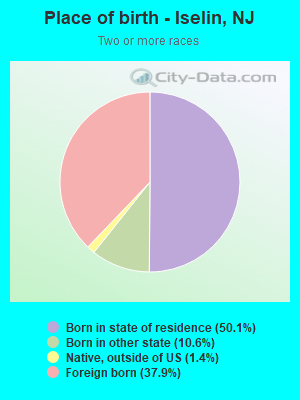
Races - Two or more races(%)
Races - Two or more races(% change since 2000)
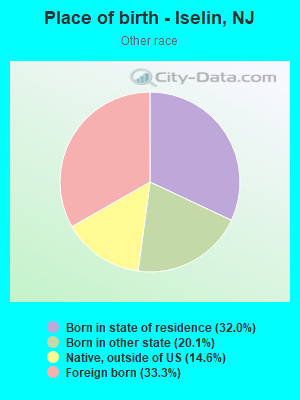
Races - Other race alone (%)
Races - Other race alone (% change since 2000)
Racial diversity
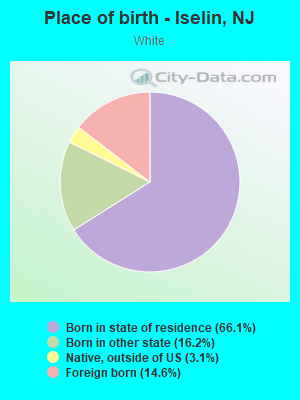
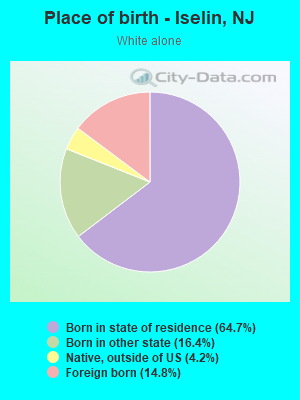
Place of birth - Born in state of residence (%)
Place of birth - Born in state of residence (%) - White
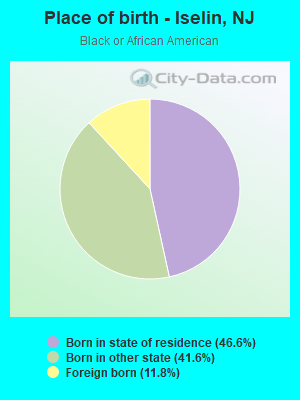
Place of birth - Born in state of residence (%) - Black or African American
Place of birth - Born in state of residence (%) - Asian
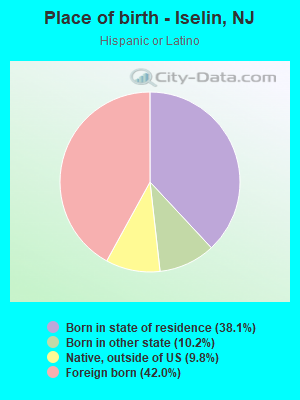
Place of birth - Born in state of residence (%) - Hispanic or Latino
Place of birth - Born in state of residence (%) - American Indian and Alaska Native
Place of birth - Born in state of residence (%) - Multirace
Place of birth - Born in state of residence (%) - Other Race
Place of birth - Born in other state (%)
Place of birth - Born in other state (%) - White
Place of birth - Born in other state (%) - Black or African American
Place of birth - Born in other state (%) - Asian
Place of birth - Born in other state (%) - Hispanic or Latino
Place of birth - Born in other state (%) - American Indian and Alaska Native
Place of birth - Born in other state (%) - Multirace
Place of birth - Born in other state (%) - Other Race
Place of birth - Native, outside of US (%)
Place of birth - Native, outside of US (%) - White
Place of birth - Native, outside of US (%) - Black or African American
Place of birth - Native, outside of US (%) - Asian
Place of birth - Native, outside of US (%) - Hispanic or Latino
Place of birth - Native, outside of US (%) - American Indian and Alaska Native
Place of birth - Native, outside of US (%) - Multirace
Place of birth - Native, outside of US (%) - Other Race
Place of birth - Foreign born (%)
Place of birth - Foreign born (%) - White
Place of birth - Foreign born (%) - Black or African American
Place of birth - Foreign born (%) - Asian
Place of birth - Foreign born (%) - Hispanic or Latino
Place of birth - Foreign born (%) - American Indian and Alaska Native
Place of birth - Foreign born (%) - Multirace
Place of birth - Foreign born (%) - Other Race
Residents speaking English at home (%)
Residents speaking English at home - Born in the United States (%)
Residents speaking English at home - Native, born elsewhere (%)
Residents speaking English at home - Foreign born (%)
Residents speaking Spanish at home (%)
Residents speaking Spanish at home - Born in the United States (%)
Residents speaking Spanish at home - Native, born elsewhere (%)
Residents speaking Spanish at home - Foreign born (%)
Residents speaking other language at home (%)
Residents speaking other language at home - Born in the United States (%)
Residents speaking other language at home - Native, born elsewhere (%)
Residents speaking other language at home - Foreign born (%)
Marital status - Never married (%)
Marital status - Now married (%)
Marital status - Separated (%)
Marital status - Widowed (%)
Marital status - Divorced (%)
Ancestries Reported - Arab (%)
Ancestries Reported - Czech (%)
Ancestries Reported - Danish (%)
Ancestries Reported - Dutch (%)
Ancestries Reported - English (%)
Ancestries Reported - French (%)
Ancestries Reported - French Canadian (%)
Ancestries Reported - German (%)
Ancestries Reported - Greek (%)
Ancestries Reported - Hungarian (%)
Ancestries Reported - Irish (%)
Ancestries Reported - Italian (%)
Ancestries Reported - Lithuanian (%)
Ancestries Reported - Norwegian (%)
Ancestries Reported - Polish (%)
Ancestries Reported - Portuguese (%)
Ancestries Reported - Russian (%)
Ancestries Reported - Scotch-Irish (%)
Ancestries Reported - Scottish (%)
Ancestries Reported - Slovak (%)
Ancestries Reported - Subsaharan African (%)
Ancestries Reported - Swedish (%)
Ancestries Reported - Swiss (%)
Ancestries Reported - Ukrainian (%)
Ancestries Reported - United States (%)
Ancestries Reported - Welsh (%)
Ancestries Reported - West Indian (%)
Ancestries Reported - Other (%)
Geographical mobility - Same house 1 year ago (%)
Geographical mobility - Same house 1 year ago (%) - White
Geographical mobility - Same house 1 year ago (%) - Black or African American
Geographical mobility - Same house 1 year ago (%) - Asian
Geographical mobility - Same house 1 year ago (%) - Hispanic or Latino
Geographical mobility - Same house 1 year ago (%) - American Indian and Alaska Native
Geographical mobility - Same house 1 year ago (%) - Multirace
Geographical mobility - Same house 1 year ago (%) - Other Race
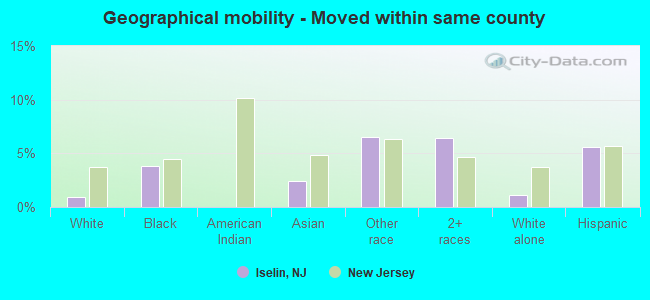
Geographical mobility - Moved within same county (%)
Geographical mobility - Moved within same county (%) - White
Geographical mobility - Moved within same county (%) - Black or African American
Geographical mobility - Moved within same county (%) - Asian
Geographical mobility - Moved within same county (%) - Hispanic or Latino
Geographical mobility - Moved within same county (%) - American Indian and Alaska Native
Geographical mobility - Moved within same county (%) - Multirace
Geographical mobility - Moved within same county (%) - Other Race
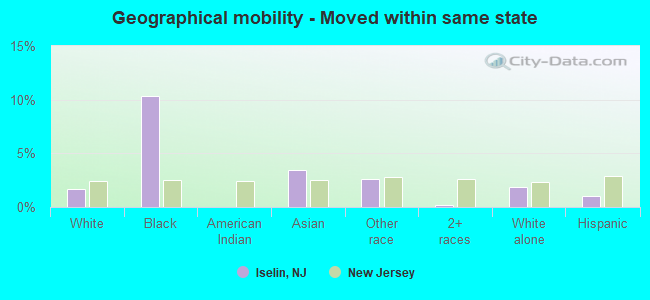
Geographical mobility - Moved from different county within same state (%)
Geographical mobility - Moved from different county within same state (%) - White
Geographical mobility - Moved from different county within same state (%) - Black or African American
Geographical mobility - Moved from different county within same state (%) - Asian
Geographical mobility - Moved from different county within same state (%) - Hispanic or Latino
Geographical mobility - Moved from different county within same state (%) - American Indian and Alaska Native
Geographical mobility - Moved from different county within same state (%) - Multirace
Geographical mobility - Moved from different county within same state (%) - Other Race
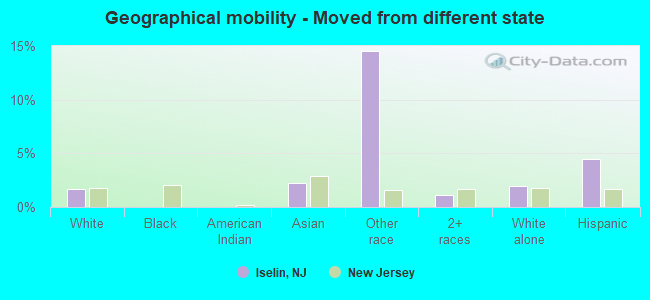
Geographical mobility - Moved from different state (%)
Geographical mobility - Moved from different state (%) - White
Geographical mobility - Moved from different state (%) - Black or African American
Geographical mobility - Moved from different state (%) - Asian
Geographical mobility - Moved from different state (%) - Hispanic or Latino
Geographical mobility - Moved from different state (%) - American Indian and Alaska Native
Geographical mobility - Moved from different state (%) - Multirace
Geographical mobility - Moved from different state (%) - Other Race
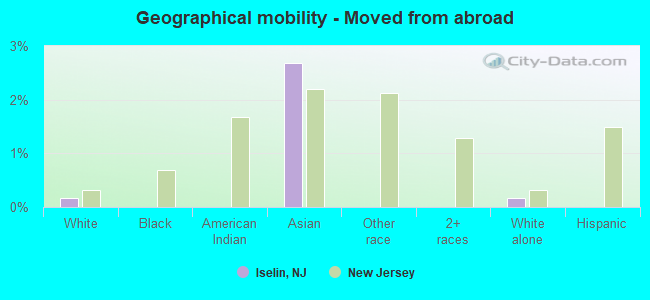
Geographical mobility - Moved from abroad (%)
Geographical mobility - Moved from abroad (%) - White
Geographical mobility - Moved from abroad (%) - Black or African American
Geographical mobility - Moved from abroad (%) - Asian
Geographical mobility - Moved from abroad (%) - Hispanic or Latino
Geographical mobility - Moved from abroad (%) - American Indian and Alaska Native
Geographical mobility - Moved from abroad (%) - Multirace
Geographical mobility - Moved from abroad (%) - Other Race
Place of birth for the foreign-born population - Ireland (%)
Place of birth for the foreign-born population - Denmark (%)
Place of birth for the foreign-born population - Norway (%)
Place of birth for the foreign-born population - Sweden (%)
Place of birth for the foreign-born population - United Kingdom (%)
Place of birth for the foreign-born population - England (%)
Place of birth for the foreign-born population - Scotland (%)
Place of birth for the foreign-born population - Other Northern Europe (%)
Place of birth for the foreign-born population - Austria (%)
Place of birth for the foreign-born population - Belgium (%)
Place of birth for the foreign-born population - France (%)
Place of birth for the foreign-born population - Germany (%)
Place of birth for the foreign-born population - Netherlands (%)
Place of birth for the foreign-born population - Switzerland (%)
Place of birth for the foreign-born population - Other Western Europe (%)
Place of birth for the foreign-born population - Greece (%)
Place of birth for the foreign-born population - Italy (%)
Place of birth for the foreign-born population - Portugal (%)
Place of birth for the foreign-born population - Spain (%)
Place of birth for the foreign-born population - Other Southern Europe (%)
Place of birth for the foreign-born population - Albania (%)
Place of birth for the foreign-born population - Belarus (%)
Place of birth for the foreign-born population - Bosnia and Herzegovina (%)
Place of birth for the foreign-born population - Bulgaria (%)
Place of birth for the foreign-born population - Croatia (%)
Place of birth for the foreign-born population - Czechoslovakia (%)
Place of birth for the foreign-born population - Hungary (%)
Place of birth for the foreign-born population - Latvia (%)
Place of birth for the foreign-born population - Lithuania (%)
Place of birth for the foreign-born population - North Macedonia (Macedonia) (%)
Place of birth for the foreign-born population - Moldova (%)
Place of birth for the foreign-born population - Poland (%)
Place of birth for the foreign-born population - Romania (%)
Place of birth for the foreign-born population - Russia (%)
Place of birth for the foreign-born population - Serbia (%)
Place of birth for the foreign-born population - Ukraine (%)
Place of birth for the foreign-born population - Other Eastern Europe (%)
Place of birth for the foreign-born population - China (%)
Place of birth for the foreign-born population - Hong Kong (%)
Place of birth for the foreign-born population - Taiwan (%)
Place of birth for the foreign-born population - Japan (%)
Place of birth for the foreign-born population - Korea (%)
Place of birth for the foreign-born population - Other Eastern Asia (%)
Place of birth for the foreign-born population - Afghanistan (%)
Place of birth for the foreign-born population - Bangladesh (%)
Place of birth for the foreign-born population - India (%)
Place of birth for the foreign-born population - Iran (%)
Place of birth for the foreign-born population - Kazakhstan (%)
Place of birth for the foreign-born population - Nepal (%)
Place of birth for the foreign-born population - Pakistan (%)
Place of birth for the foreign-born population - Sri Lanka (%)
Place of birth for the foreign-born population - Uzbekistan (%)
Place of birth for the foreign-born population - Other South Central Asia (%)
Place of birth for the foreign-born population - Burma (%)
Place of birth for the foreign-born population - Cambodia (%)
Place of birth for the foreign-born population - Indonesia (%)
Place of birth for the foreign-born population - Laos (%)
Place of birth for the foreign-born population - Malaysia (%)
Place of birth for the foreign-born population - Philippines (%)
Place of birth for the foreign-born population - Singapore (%)
Place of birth for the foreign-born population - Thailand (%)
Place of birth for the foreign-born population - Vietnam (%)
Place of birth for the foreign-born population - Other South Eastern Asia (%)
Place of birth for the foreign-born population - Armenia (%)
Place of birth for the foreign-born population - Iraq (%)
Place of birth for the foreign-born population - Israel (%)
Place of birth for the foreign-born population - Jordan (%)
Place of birth for the foreign-born population - Kuwait (%)
Place of birth for the foreign-born population - Lebanon (%)
Place of birth for the foreign-born population - Saudi Arabia (%)
Place of birth for the foreign-born population - Syria (%)
Place of birth for the foreign-born population - Turkey (%)
Place of birth for the foreign-born population - Yemen (%)
Place of birth for the foreign-born population - Other Western Asia (%)
Place of birth for the foreign-born population - Eritrea (%)
Place of birth for the foreign-born population - Ethiopia (%)
Place of birth for the foreign-born population - Kenya (%)
Place of birth for the foreign-born population - Somalia (%)
Place of birth for the foreign-born population - Uganda (%)
Place of birth for the foreign-born population - Zimbabwe (%)
Place of birth for the foreign-born population - Other Eastern Africa (%)
Place of birth for the foreign-born population - Cameroon (%)
Place of birth for the foreign-born population - Congo (%)
Place of birth for the foreign-born population - Democratic Republic of Congo (Zaire) (%)
Place of birth for the foreign-born population - Other Middle Africa (%)
Place of birth for the foreign-born population - Egypt (%)
Place of birth for the foreign-born population - Morocco (%)
Place of birth for the foreign-born population - Sudan (%)
Place of birth for the foreign-born population - Other Northern Africa (%)
Place of birth for the foreign-born population - South Africa (%)
Place of birth for the foreign-born population - Other Southern Africa (%)
Place of birth for the foreign-born population - Cabo Verde (%)
Place of birth for the foreign-born population - Ghana (%)
Place of birth for the foreign-born population - Liberia (%)
Place of birth for the foreign-born population - Nigeria (%)
Place of birth for the foreign-born population - Senegal (%)
Place of birth for the foreign-born population - Sierra Leone (%)
Place of birth for the foreign-born population - Other Western Africa (%)
Place of birth for the foreign-born population - Australia (%)
Place of birth for the foreign-born population - New Zealand (%)
Place of birth for the foreign-born population - Fiji (%)
Place of birth for the foreign-born population - Micronesia (%)
Place of birth for the foreign-born population - Bahamas (%)
Place of birth for the foreign-born population - Barbados (%)
Place of birth for the foreign-born population - Cuba (%)
Place of birth for the foreign-born population - Dominica (%)
Place of birth for the foreign-born population - Dominican Republic (%)
Place of birth for the foreign-born population - Grenada (%)
Place of birth for the foreign-born population - Haiti (%)
Place of birth for the foreign-born population - Jamaica (%)
Place of birth for the foreign-born population - St. Vincent and the Grenadines (%)
Place of birth for the foreign-born population - Trinidad and Tobago (%)
Place of birth for the foreign-born population - West Indies (%)
Place of birth for the foreign-born population - Other Caribbean (%)
Place of birth for the foreign-born population - Belize (%)
Place of birth for the foreign-born population - Costa Rica (%)
Place of birth for the foreign-born population - El Salvador (%)
Place of birth for the foreign-born population - Guatemala (%)
Place of birth for the foreign-born population - Honduras (%)
Place of birth for the foreign-born population - Mexico (%)
Place of birth for the foreign-born population - Nicaragua (%)
Place of birth for the foreign-born population - Panama (%)
Place of birth for the foreign-born population - Other Central America (%)
Place of birth for the foreign-born population - Argentina (%)
Place of birth for the foreign-born population - Bolivia (%)
Place of birth for the foreign-born population - Brazil (%)
Place of birth for the foreign-born population - Chile (%)
Place of birth for the foreign-born population - Colombia (%)
Place of birth for the foreign-born population - Ecuador (%)
Place of birth for the foreign-born population - Guyana (%)
Place of birth for the foreign-born population - Peru (%)
Place of birth for the foreign-born population - Uruguay (%)
Place of birth for the foreign-born population - Venezuela (%)
Place of birth for the foreign-born population - Other South America (%)
Place of birth for the foreign-born population - Canada (%)
Place of birth for the foreign-born population - Other Northern America (%)
Place of birth for the foreign-born population - Other (%)
Latest news about races in Iselin, NJ collected exclusively by city-data.com from local newspapers, TV, and radio stations
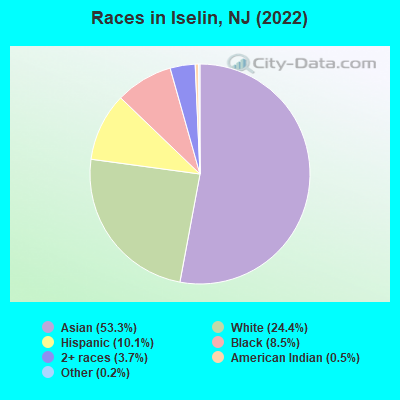
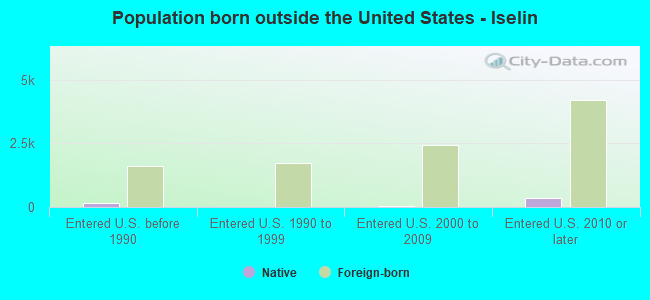
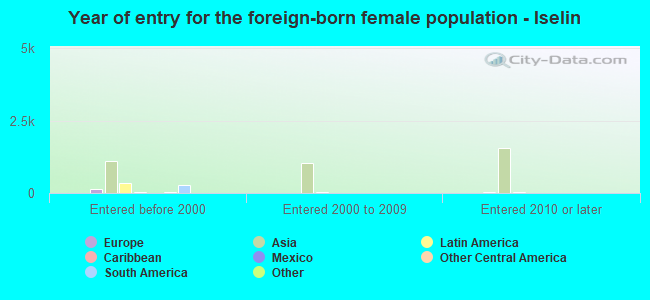
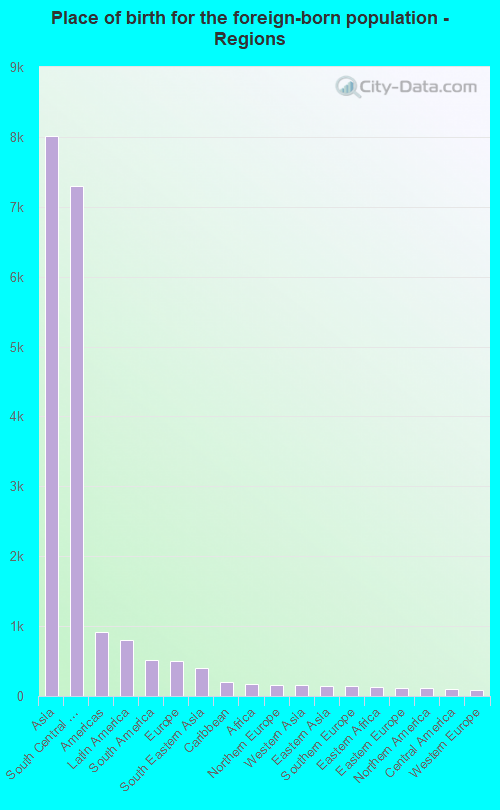
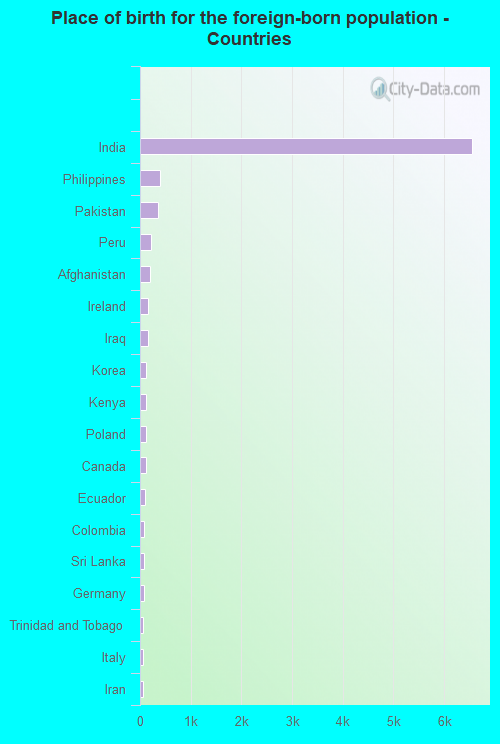
According to 2022 data, the most numerous races in Iselin, NJ are White alone (4,525 residents), Hispanic (1,865 residents), and Black alone (1,572 residents). 39.9% of Iselin residents speak English at home. 51.8% of Iselin, NJ residents are foreign-born (42.6% born in Asia), which is 55.6% greater than the foreign-born rate of 23.0% across the entire state of New Jersey.
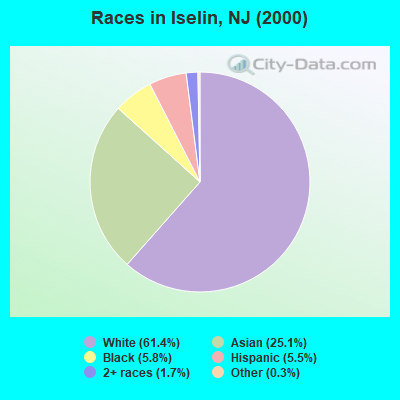
Race distribution in Iselin
2000 2022
5,557,209 66.0% White alone 1,117,191 13.3% Hispanic 1,096,171 13.0% Black alone 477,012 5.7% Asian alone 133,689 1.6% Two or more races 19,565 0.2% Other race alone 11,338 0.1% American Indian alone 2,175 0.03% Native Hawaiian and Other
4,766,476 51.5% White alone 2,028,470 21.9% Hispanic 1,111,632 12.0% Black alone 923,546 10.0% Asian alone 332,237 3.6% Two or more races 89,847 1.0% Other race alone 8,557 0.09% American Indian alone 934 0.01% Native Hawaiian and Other
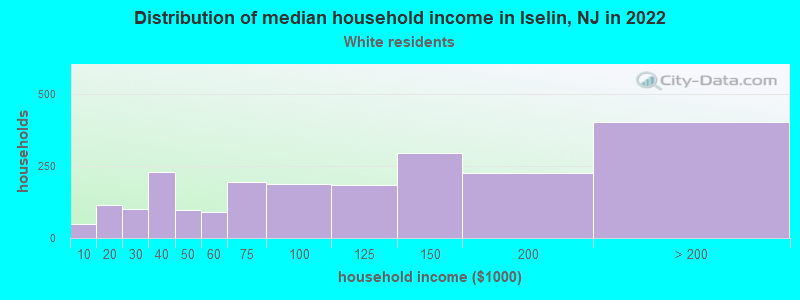
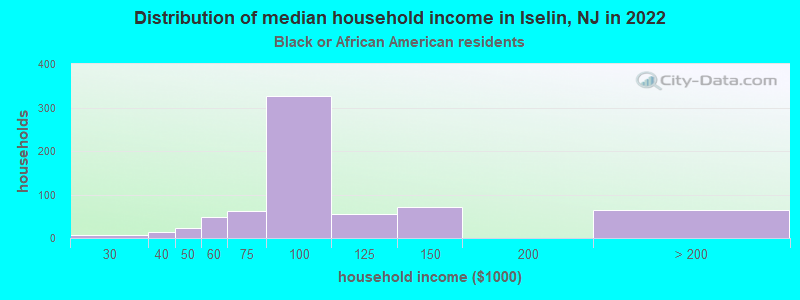
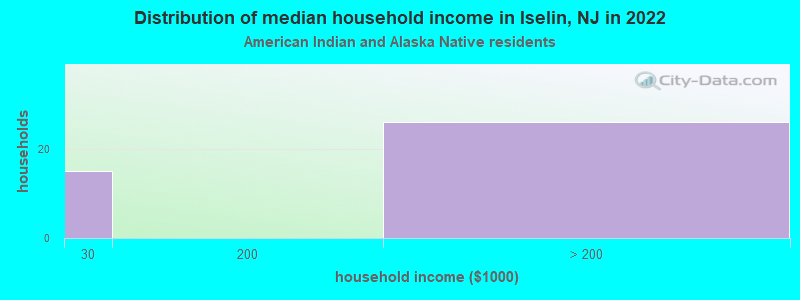
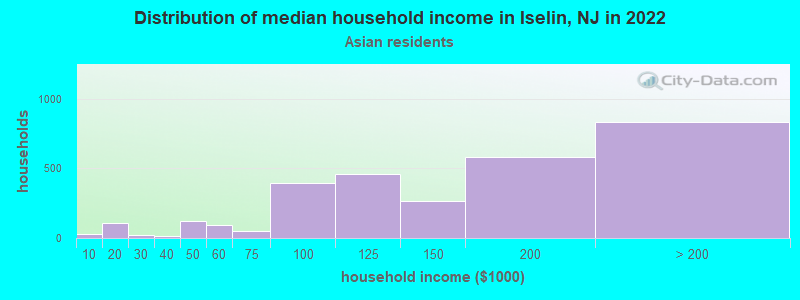
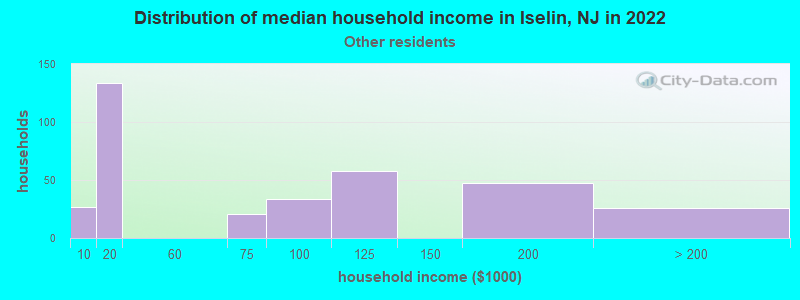
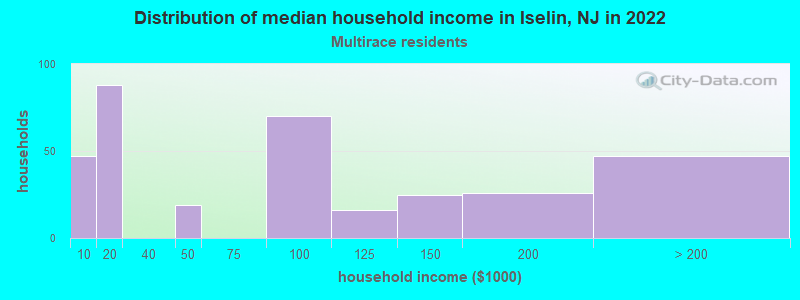
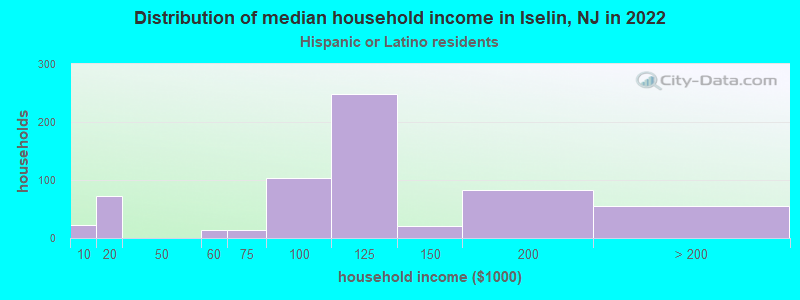
Income and house value in Iselin Median household income in 2022 $77,556 White non-Hispanic householders$82,712 Black householders$144,246 Asian householders$86,711 Some other race householders$73,289 Two or more races householders$101,773 Hispanic or Latino race householdersMedian 2022 house value $399,950 White Non-Hispanic householders$365,540 Black or African American householders $409,214 Asian householders$395,450 Some other race householders$406,302 Two or more races householders$435,419 Hispanic or Latino householders
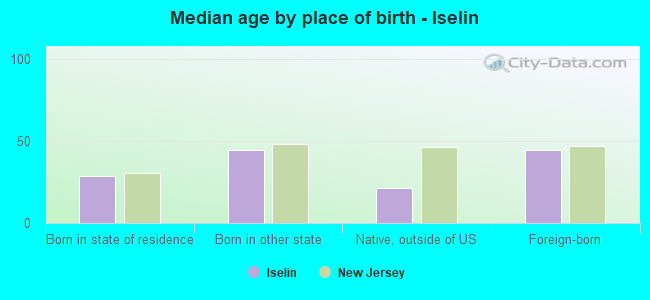
Median age by race in Iselin
59.3 Median age for White residents61.1 55.1 42.8 Median age for Black or African American residents32.3 41.5 50.7 Median age for American Indian / Alaska Native residents39.3 -739,999,999.3 37.7 Median age for Asian residents37.9 37.1 -939,393,938.5 Median age for Native Hawaiian / Pacific Islander residents-860,335,194.7 -713,070,378.3 40.2 Median age for Other race residents36.6 45.9 33.9 Median age for Two or more races residents48.9 28.7 56.9 Median age for White alone residents59.4 52.3 41.0 Median age for Hispanic or Latino residents40.9 45.0
Owner/renter occupied households by race in Iselin
House owners and renters - White residents 1,869 84.6% Owner occupied339 15.4% Renter occupiedHouse owners and renters - Black or African American residents 400 61.2% Owner occupied253 38.8% Renter occupiedHouse owners and renters - American Indian / Alaska Native residents 21 27.5% Owner occupied56 72.5% Renter occupiedHouse owners and renters - Asian residents 1,907 63.5% Owner occupied1,095 36.5% Renter occupiedHouse owners and renters - Other race residents 127 38.6% Owner occupied202 61.4% Renter occupiedHouse owners and renters - Two or more races residents 264 80.2% Owner occupied65 19.8% Renter occupiedHouse owners and renters - White alone residents 1,721 81.7% Owner occupied386 18.3% Renter occupiedHouse owners and renters - Hispanic or Latino residents 527 75.6% Owner occupied170 24.4% Renter occupied
Language usage in Iselin
English speakers - Total 39.9% of residents of Iselin speak English at home.
7.3% of residents speak Spanish at home 722 55.7% Speak English very well575 44.3% Speak English less than very well53.0% of residents speak other language at home 6,609 70.0% Speak English very well2,834 30.0% Speak English less than very well
English speakers - Born in the United States 65.5% of residents of Iselin speak English at home.
8.6% of residents speak Spanish at home 138 83.6% Speak English very well27 16.4% Speak English less than very well24.7% of residents speak other language at home 467 98.5% Speak English very well7 1.5% Speak English less than very well
English speakers - Native, born elsewhere 23.8% of residents of Iselin speak English at home.
30.9% of residents speak Spanish at home 162 100.0% Speak English very well44.2% of residents speak other language at home 232 100.0% Speak English very well
English speakers - Foreign-born 11.5% of residents of Iselin speak English at home.
8.0% of residents speak Spanish at home 251 32.4% Speak English very well523 67.6% Speak English less than very well78.2% of residents speak other language at home 4,969 65.7% Speak English very well2,592 34.3% Speak English less than very well
White (Caucasian) - Speak only English Native:
97.1% (3,732)Foreign-born:
22.7% (144)
White (Caucasian) - Speak another language Native:
5.2% (198)Foreign-born:
78.0% (496)
Black or African American - Speak only English Native:
70.0% (959)Foreign-born:
36.2% (67)
Black or African American - Speak another language Native:
27.3% (374)Foreign-born:
65.6% (121)
American Indian / Alaska Native - Speak only English Native:
69.1% (10)Foreign-born:
87.8% (205)
Asian - Speak only English Native:
25.0% (461)Foreign-born:
7.5% (555)
Asian - Speak another language Native:
75.7% (1,396)Foreign-born:
92.4% (6,887)
Other race - Speak another language Native:
64.6% (301)Foreign-born:
97.4% (279)
Two or more races - Speak only English Native:
78.5% (796)Foreign-born:
30.4% (186)
Two or more races - Speak another language Native:
20.7% (210)Foreign-born:
68.9% (423)
White alone - Speak only English Native:
97.9% (3,778)Foreign-born:
23.7% (157)
White alone - Speak another language Native:
3.0% (116)Foreign-born:
76.4% (506)
Hispanic or Latino - Speak only English Native:
47.7% (461)Foreign-born:
5.3% (41)
Hispanic or Latino - Speak another language Native:
53.3% (514)Foreign-born:
94.0% (732)
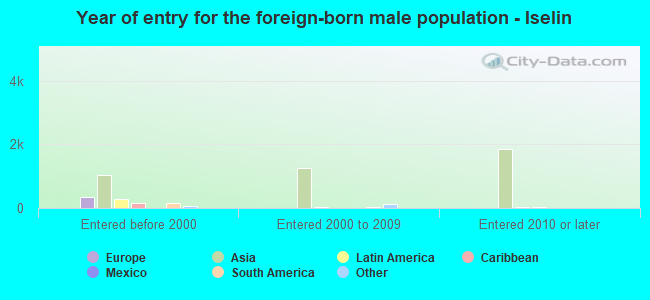
Foreign-born residents in Iselin 9,596 residents are foreign born (42.6% Asia ).
This city:
51.8%New Jersey:
23.2%
Marital status for residents in Iselin Marital status - White (Caucasian) population 15 years and over
Males 31.5% Never married56.6% Now married0.0% Separated7.1% Widowed4.8% DivorcedFemales 30.6% Never married48.2% Now married1.5% Separated14.4% Widowed5.4% DivorcedWomen who gave birth in the past 12 months Now married:
100.0% (29)Unmarried:
0.0% (0)
Women who did not give birth in the past 12 months Now married:
43.4% (316)Unmarried:
56.6% (412)
Marital status - Black or African American population 15 years and over
Males 13.6% Never married49.8% Now married7.0% Separated8.6% Widowed20.9% DivorcedFemales 33.2% Never married49.1% Now married6.2% Separated7.6% Widowed3.8% DivorcedWomen who gave birth in the past 12 months Now married:
100.0% (52)Unmarried:
0.0% (0)
Women who did not give birth in the past 12 months Now married:
46.7% (278)Unmarried:
53.3% (317)
Marital status - American Indian / Alaska Native population 15 years and over
Males 26.6% Never married73.4% Now married0.0% Separated0.0% Widowed0.0% DivorcedFemales 0.0% Never married0.0% Now married0.0% Separated0.0% Widowed100.0% DivorcedMarital status - Asian population 15 years and over
Males 25.4% Never married73.5% Now married0.0% Separated0.5% Widowed0.6% DivorcedFemales 21.0% Never married68.5% Now married0.7% Separated5.9% Widowed3.9% DivorcedWomen who gave birth in the past 12 months Now married:
100.0% (52)Unmarried:
0.0% (0)
Women who did not give birth in the past 12 months Now married:
66.4% (1,627)Unmarried:
33.6% (825)
Marital status - Other race population 15 years and over
Males 23.9% Never married64.0% Now married6.6% Separated0.0% Widowed5.6% DivorcedFemales 14.1% Never married56.7% Now married0.0% Separated0.0% Widowed29.3% DivorcedWomen who did not give birth in the past 12 months Now married:
67.8% (113)Unmarried:
32.2% (53)
Marital status - Two or more races population 15 years and over
Males 18.7% Never married68.3% Now married0.0% Separated13.1% Widowed0.0% DivorcedFemales 49.4% Never married43.8% Now married0.0% Separated2.5% Widowed4.3% DivorcedWomen who did not give birth in the past 12 months Now married:
16.1% (124)Unmarried:
83.9% (646)
Marital status - White alone, not Hispanic / Latino population 15 years and over
Males 34.0% Never married53.4% Now married0.0% Separated8.2% Widowed4.4% DivorcedFemales 31.9% Never married45.2% Now married1.6% Separated15.5% Widowed5.8% DivorcedWomen who gave birth in the past 12 months Now married:
100.0% (9)Unmarried:
0.0% (0)
Women who did not give birth in the past 12 months Now married:
42.1% (340)Unmarried:
57.9% (467)
Marital status - Hispanic or Latino population 15 years and over
Males 20.6% Never married71.5% Now married2.1% Separated0.0% Widowed5.8% DivorcedFemales 29.1% Never married50.8% Now married0.0% Separated8.9% Widowed11.2% DivorcedWomen who gave birth in the past 12 months Now married:
100.0% (27)Unmarried:
0.0% (0)
Women who did not give birth in the past 12 months Now married:
33.5% (132)Unmarried:
66.5% (262)
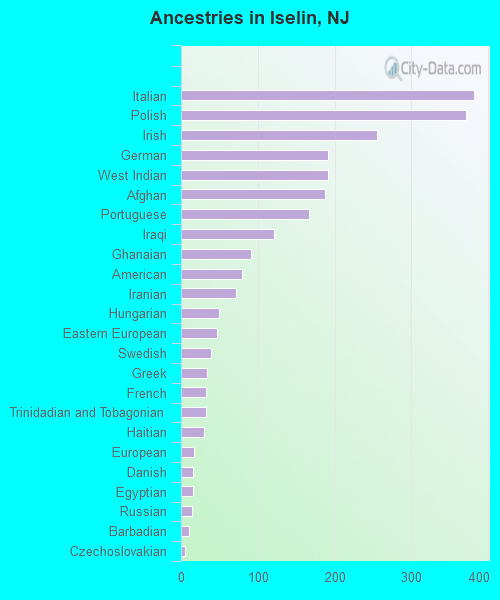
Ancestries in Iselin
382 3.6% Italian371 3.5% Polish255 2.4% Irish191 1.8% German191 1.8% West Indian188 1.8% Afghan167 1.6% Portuguese121 1.1% Iraqi91 0.9% Ghanaian80 0.8% American72 0.7% Iranian49 0.5% Hungarian47 0.4% Eastern European39 0.4% Swedish34 0.3% Greek33 0.3% French33 0.3% Trinidadian and Tobagonian30 0.3% Haitian17 0.2% European16 0.2% Danish15 0.1% Egyptian14 0.1% Russian11 0.1% Barbadian5 0.05% Czechoslovakian
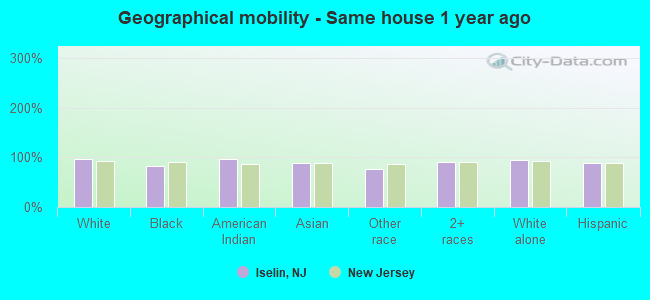
Geographical mobility in Iselin Same house 1 year ago 4,284 96.1% White (Caucasian)1,330 82.4% Black or African American171 96.6% American Indian / Alaska Native8,766 88.4% Asian702 76.9% Other race1,496 90.9% Two or more races4,289 95.1% White alone, not Hispanic / Latino1,627 88.4% Hispanic or LatinoMoved within same county 43 1.0% White / Caucasian62 3.8% Black or African American236 2.4% Asian59 6.5% Other race105 6.4% Two or more races52 1.2% White alone, not Hispanic / Latino103 5.6% Hispanic or LatinoMoved within same state 75 1.7% White / Caucasian168 10.4% Black or African American337 3.4% Asian24 2.6% Other race4 0.2% Two or more races84 1.9% White alone, not Hispanic / Latino19 1.0% Hispanic or LatinoMoved from different state 76 1.7% White / Caucasian220 2.2% Asian133 14.5% Other race18 1.1% Two or more races89 2.0% White alone, not Hispanic / Latino82 4.4% Hispanic or LatinoMoved from abroad 8 0.2% White266 2.7% Asian8 0.2% White alone, not Hispanic / Latino
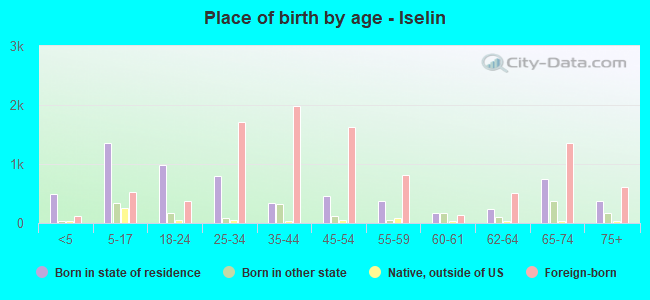
Children Nativity (place of birth) in Iselin
Children under 6 years - Living with two parents Both parents native 67 100.0% NativeBoth parents foreign-born 412 65.0% Native222 35.0% Foreign-bornOne native, one foreign-born parent 111 100.0% NativeChildren under 6 years - Living with one parent Native parent 16 100.0% NativeForeign-born parent 72 92.4% Native6 7.6% Foreign-bornChildren 6 to 17 years - Living with two parents Both parents native 128 100.0% NativeBoth parents foreign-born 1,027 72.2% Native395 27.8% Foreign-bornOne native, one foreign-born parent 161 100.0% NativeChildren 6 to 17 years - Living with one parent Native parent 341 100.0% NativeForeign-born parent 151 57.9% Native110 42.1% Foreign-born
Grandparents responsible for own grandchildren in Iselin
Grandparents (30 to 59 years) White / Caucasian 26 100.0% Not responsible for grandchildrenAsian 45 100.0% Not responsible for grandchildrenHispanic or Latino 50 100.0% Not responsible for grandchildren
Grandparents (60 years and over) White / Caucasian 9 100.0% Not responsible for grandchildrenAsian 222 100.0% Not responsible for grandchildrenHispanic or Latino 31 100.0% Not responsible for grandchildren