Races in Jackson Prairie, Washington (WA) Detailed Stats
Ancestries, Foreign-born residents, place of birth
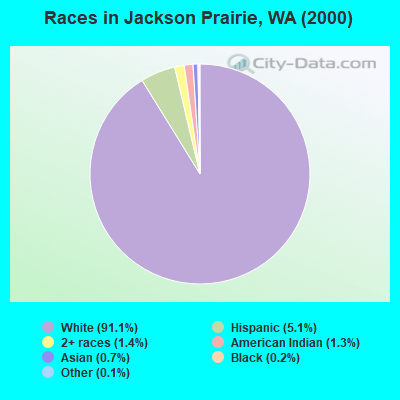
Race distribution in Jackson Prairie

- 4,56291.1%White alone
- 2575.1%Hispanic
- 681.4%Two or more races
- 641.3%American Indian alone
- 350.7%Asian alone
- 100.2%Black alone
- 60.1%Other race alone
- 40.08%Native Hawaiian and Other
Pacific Islander alone
2000
2022
-
- 4,652,49078.9%White alone
- 441,5097.5%Hispanic
- 319,4015.4%Asian alone
- 184,6313.1%Black alone
- 175,9263.0%Two or more races
- 85,3961.4%American Indian alone
- 22,7790.4%Native Hawaiian and Other
Pacific Islander alone - 11,9890.2%Other race alone

-
- 4,941,45663.5%White alone
- 1,093,31314.0%Hispanic
- 755,8329.7%Asian alone
- 523,4486.7%Two or more races
- 299,5373.8%Black alone
- 69,0240.9%American Indian alone
- 52,2310.7%Native Hawaiian and Other
Pacific Islander alone - 50,9450.7%Other race alone

Income and house value in Jackson Prairie
- Median household income in 2022
- $80,822White non-Hispanic householders
- $90,868American Indian and Alaska Native householders
- $50,237Some other race householders
- $128,940Two or more races householders
- $80,432Hispanic or Latino race householders
- Median 2022 house value
- $402,775White Non-Hispanic householders
- $431,663American Indian or Alaska Native householders
- $339,022Some other race householders
- $456,567Two or more races householders
- $290,542Hispanic or Latino householders
Household income for White non-Hispanic householders

Household income for Black householders

Household income for American Indian and Alaska Native householders

Household income for Asian householders

Household income for Two or more races householders

Household income for Hispanic or Latino race householders

Zip code: 98596