Races in Jasmine Estates, Florida (FL) Detailed Stats
Data:
Races - White alone (%)
Races - White alone (% change since 2000)
Races - Black alone (%)
Races - Black alone (% change since 2000)
Races - American Indian alone (%)
Races - American Indian alone (% change since 2000)
Races - Asian alone (%)
Races - Asian alone (% change since 2000)
Races - Hispanic (%)
Races - Hispanic (% change since 2000)
Races - Native Hawaiian and Other Pacific Islander alone (%)
Races - Native Hawaiian and Other Pacific Islander alone (% change since 2000)
Races - Two or more races(%)
Races - Two or more races(% change since 2000)
Races - Other race alone (%)
Races - Other race alone (% change since 2000)
Racial diversity
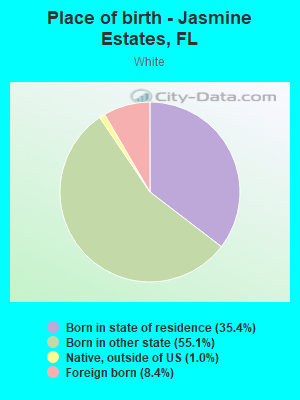
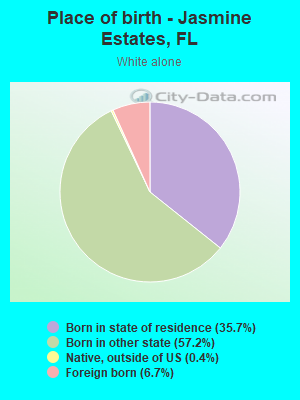
Place of birth - Born in state of residence (%)
Place of birth - Born in state of residence (%) - White
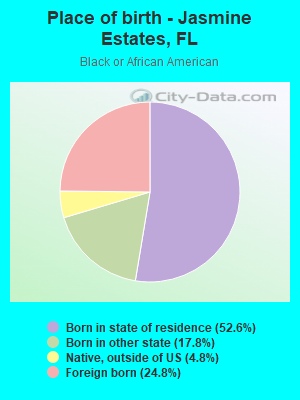
Place of birth - Born in state of residence (%) - Black or African American
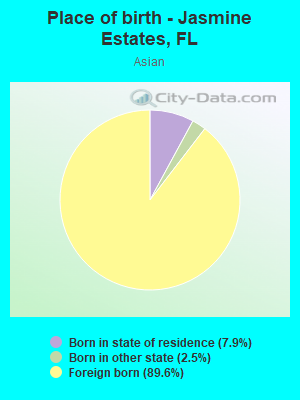
Place of birth - Born in state of residence (%) - Asian
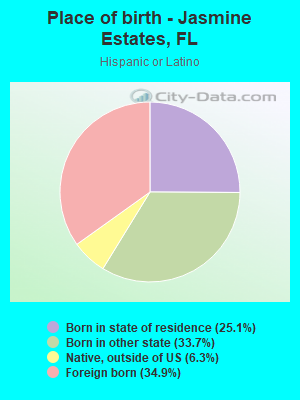
Place of birth - Born in state of residence (%) - Hispanic or Latino
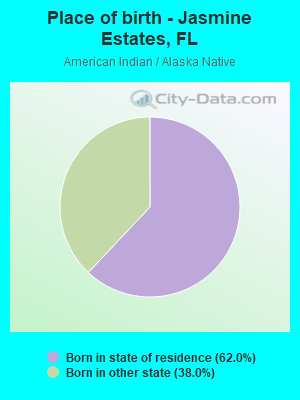
Place of birth - Born in state of residence (%) - American Indian and Alaska Native
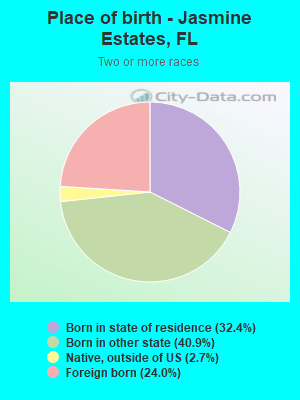
Place of birth - Born in state of residence (%) - Multirace
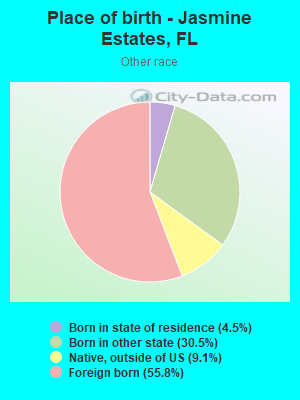
Place of birth - Born in state of residence (%) - Other Race
Place of birth - Born in other state (%)
Place of birth - Born in other state (%) - White
Place of birth - Born in other state (%) - Black or African American
Place of birth - Born in other state (%) - Asian
Place of birth - Born in other state (%) - Hispanic or Latino
Place of birth - Born in other state (%) - American Indian and Alaska Native
Place of birth - Born in other state (%) - Multirace
Place of birth - Born in other state (%) - Other Race
Place of birth - Native, outside of US (%)
Place of birth - Native, outside of US (%) - White
Place of birth - Native, outside of US (%) - Black or African American
Place of birth - Native, outside of US (%) - Asian
Place of birth - Native, outside of US (%) - Hispanic or Latino
Place of birth - Native, outside of US (%) - American Indian and Alaska Native
Place of birth - Native, outside of US (%) - Multirace
Place of birth - Native, outside of US (%) - Other Race
Place of birth - Foreign born (%)
Place of birth - Foreign born (%) - White
Place of birth - Foreign born (%) - Black or African American
Place of birth - Foreign born (%) - Asian
Place of birth - Foreign born (%) - Hispanic or Latino
Place of birth - Foreign born (%) - American Indian and Alaska Native
Place of birth - Foreign born (%) - Multirace
Place of birth - Foreign born (%) - Other Race
Residents speaking English at home (%)
Residents speaking English at home - Born in the United States (%)
Residents speaking English at home - Native, born elsewhere (%)
Residents speaking English at home - Foreign born (%)
Residents speaking Spanish at home (%)
Residents speaking Spanish at home - Born in the United States (%)
Residents speaking Spanish at home - Native, born elsewhere (%)
Residents speaking Spanish at home - Foreign born (%)
Residents speaking other language at home (%)
Residents speaking other language at home - Born in the United States (%)
Residents speaking other language at home - Native, born elsewhere (%)
Residents speaking other language at home - Foreign born (%)
Marital status - Never married (%)
Marital status - Now married (%)
Marital status - Separated (%)
Marital status - Widowed (%)
Marital status - Divorced (%)
Ancestries Reported - Arab (%)
Ancestries Reported - Czech (%)
Ancestries Reported - Danish (%)
Ancestries Reported - Dutch (%)
Ancestries Reported - English (%)
Ancestries Reported - French (%)
Ancestries Reported - French Canadian (%)
Ancestries Reported - German (%)
Ancestries Reported - Greek (%)
Ancestries Reported - Hungarian (%)
Ancestries Reported - Irish (%)
Ancestries Reported - Italian (%)
Ancestries Reported - Lithuanian (%)
Ancestries Reported - Norwegian (%)
Ancestries Reported - Polish (%)
Ancestries Reported - Portuguese (%)
Ancestries Reported - Russian (%)
Ancestries Reported - Scotch-Irish (%)
Ancestries Reported - Scottish (%)
Ancestries Reported - Slovak (%)
Ancestries Reported - Subsaharan African (%)
Ancestries Reported - Swedish (%)
Ancestries Reported - Swiss (%)
Ancestries Reported - Ukrainian (%)
Ancestries Reported - United States (%)
Ancestries Reported - Welsh (%)
Ancestries Reported - West Indian (%)
Ancestries Reported - Other (%)
Geographical mobility - Same house 1 year ago (%)
Geographical mobility - Same house 1 year ago (%) - White
Geographical mobility - Same house 1 year ago (%) - Black or African American
Geographical mobility - Same house 1 year ago (%) - Asian
Geographical mobility - Same house 1 year ago (%) - Hispanic or Latino
Geographical mobility - Same house 1 year ago (%) - American Indian and Alaska Native
Geographical mobility - Same house 1 year ago (%) - Multirace
Geographical mobility - Same house 1 year ago (%) - Other Race
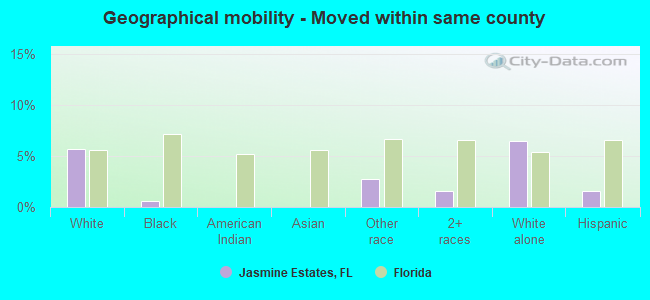
Geographical mobility - Moved within same county (%)
Geographical mobility - Moved within same county (%) - White
Geographical mobility - Moved within same county (%) - Black or African American
Geographical mobility - Moved within same county (%) - Asian
Geographical mobility - Moved within same county (%) - Hispanic or Latino
Geographical mobility - Moved within same county (%) - American Indian and Alaska Native
Geographical mobility - Moved within same county (%) - Multirace
Geographical mobility - Moved within same county (%) - Other Race
Geographical mobility - Moved from different county within same state (%)
Geographical mobility - Moved from different county within same state (%) - White
Geographical mobility - Moved from different county within same state (%) - Black or African American
Geographical mobility - Moved from different county within same state (%) - Asian
Geographical mobility - Moved from different county within same state (%) - Hispanic or Latino
Geographical mobility - Moved from different county within same state (%) - American Indian and Alaska Native
Geographical mobility - Moved from different county within same state (%) - Multirace
Geographical mobility - Moved from different county within same state (%) - Other Race
Geographical mobility - Moved from different state (%)
Geographical mobility - Moved from different state (%) - White
Geographical mobility - Moved from different state (%) - Black or African American
Geographical mobility - Moved from different state (%) - Asian
Geographical mobility - Moved from different state (%) - Hispanic or Latino
Geographical mobility - Moved from different state (%) - American Indian and Alaska Native
Geographical mobility - Moved from different state (%) - Multirace
Geographical mobility - Moved from different state (%) - Other Race
Geographical mobility - Moved from abroad (%)
Geographical mobility - Moved from abroad (%) - White
Geographical mobility - Moved from abroad (%) - Black or African American
Geographical mobility - Moved from abroad (%) - Asian
Geographical mobility - Moved from abroad (%) - Hispanic or Latino
Geographical mobility - Moved from abroad (%) - American Indian and Alaska Native
Geographical mobility - Moved from abroad (%) - Multirace
Geographical mobility - Moved from abroad (%) - Other Race
Place of birth for the foreign-born population - Ireland (%)
Place of birth for the foreign-born population - Denmark (%)
Place of birth for the foreign-born population - Norway (%)
Place of birth for the foreign-born population - Sweden (%)
Place of birth for the foreign-born population - United Kingdom (%)
Place of birth for the foreign-born population - England (%)
Place of birth for the foreign-born population - Scotland (%)
Place of birth for the foreign-born population - Other Northern Europe (%)
Place of birth for the foreign-born population - Austria (%)
Place of birth for the foreign-born population - Belgium (%)
Place of birth for the foreign-born population - France (%)
Place of birth for the foreign-born population - Germany (%)
Place of birth for the foreign-born population - Netherlands (%)
Place of birth for the foreign-born population - Switzerland (%)
Place of birth for the foreign-born population - Other Western Europe (%)
Place of birth for the foreign-born population - Greece (%)
Place of birth for the foreign-born population - Italy (%)
Place of birth for the foreign-born population - Portugal (%)
Place of birth for the foreign-born population - Spain (%)
Place of birth for the foreign-born population - Other Southern Europe (%)
Place of birth for the foreign-born population - Albania (%)
Place of birth for the foreign-born population - Belarus (%)
Place of birth for the foreign-born population - Bosnia and Herzegovina (%)
Place of birth for the foreign-born population - Bulgaria (%)
Place of birth for the foreign-born population - Croatia (%)
Place of birth for the foreign-born population - Czechoslovakia (%)
Place of birth for the foreign-born population - Hungary (%)
Place of birth for the foreign-born population - Latvia (%)
Place of birth for the foreign-born population - Lithuania (%)
Place of birth for the foreign-born population - North Macedonia (Macedonia) (%)
Place of birth for the foreign-born population - Moldova (%)
Place of birth for the foreign-born population - Poland (%)
Place of birth for the foreign-born population - Romania (%)
Place of birth for the foreign-born population - Russia (%)
Place of birth for the foreign-born population - Serbia (%)
Place of birth for the foreign-born population - Ukraine (%)
Place of birth for the foreign-born population - Other Eastern Europe (%)
Place of birth for the foreign-born population - China (%)
Place of birth for the foreign-born population - Hong Kong (%)
Place of birth for the foreign-born population - Taiwan (%)
Place of birth for the foreign-born population - Japan (%)
Place of birth for the foreign-born population - Korea (%)
Place of birth for the foreign-born population - Other Eastern Asia (%)
Place of birth for the foreign-born population - Afghanistan (%)
Place of birth for the foreign-born population - Bangladesh (%)
Place of birth for the foreign-born population - India (%)
Place of birth for the foreign-born population - Iran (%)
Place of birth for the foreign-born population - Kazakhstan (%)
Place of birth for the foreign-born population - Nepal (%)
Place of birth for the foreign-born population - Pakistan (%)
Place of birth for the foreign-born population - Sri Lanka (%)
Place of birth for the foreign-born population - Uzbekistan (%)
Place of birth for the foreign-born population - Other South Central Asia (%)
Place of birth for the foreign-born population - Burma (%)
Place of birth for the foreign-born population - Cambodia (%)
Place of birth for the foreign-born population - Indonesia (%)
Place of birth for the foreign-born population - Laos (%)
Place of birth for the foreign-born population - Malaysia (%)
Place of birth for the foreign-born population - Philippines (%)
Place of birth for the foreign-born population - Singapore (%)
Place of birth for the foreign-born population - Thailand (%)
Place of birth for the foreign-born population - Vietnam (%)
Place of birth for the foreign-born population - Other South Eastern Asia (%)
Place of birth for the foreign-born population - Armenia (%)
Place of birth for the foreign-born population - Iraq (%)
Place of birth for the foreign-born population - Israel (%)
Place of birth for the foreign-born population - Jordan (%)
Place of birth for the foreign-born population - Kuwait (%)
Place of birth for the foreign-born population - Lebanon (%)
Place of birth for the foreign-born population - Saudi Arabia (%)
Place of birth for the foreign-born population - Syria (%)
Place of birth for the foreign-born population - Turkey (%)
Place of birth for the foreign-born population - Yemen (%)
Place of birth for the foreign-born population - Other Western Asia (%)
Place of birth for the foreign-born population - Eritrea (%)
Place of birth for the foreign-born population - Ethiopia (%)
Place of birth for the foreign-born population - Kenya (%)
Place of birth for the foreign-born population - Somalia (%)
Place of birth for the foreign-born population - Uganda (%)
Place of birth for the foreign-born population - Zimbabwe (%)
Place of birth for the foreign-born population - Other Eastern Africa (%)
Place of birth for the foreign-born population - Cameroon (%)
Place of birth for the foreign-born population - Congo (%)
Place of birth for the foreign-born population - Democratic Republic of Congo (Zaire) (%)
Place of birth for the foreign-born population - Other Middle Africa (%)
Place of birth for the foreign-born population - Egypt (%)
Place of birth for the foreign-born population - Morocco (%)
Place of birth for the foreign-born population - Sudan (%)
Place of birth for the foreign-born population - Other Northern Africa (%)
Place of birth for the foreign-born population - South Africa (%)
Place of birth for the foreign-born population - Other Southern Africa (%)
Place of birth for the foreign-born population - Cabo Verde (%)
Place of birth for the foreign-born population - Ghana (%)
Place of birth for the foreign-born population - Liberia (%)
Place of birth for the foreign-born population - Nigeria (%)
Place of birth for the foreign-born population - Senegal (%)
Place of birth for the foreign-born population - Sierra Leone (%)
Place of birth for the foreign-born population - Other Western Africa (%)
Place of birth for the foreign-born population - Australia (%)
Place of birth for the foreign-born population - New Zealand (%)
Place of birth for the foreign-born population - Fiji (%)
Place of birth for the foreign-born population - Micronesia (%)
Place of birth for the foreign-born population - Bahamas (%)
Place of birth for the foreign-born population - Barbados (%)
Place of birth for the foreign-born population - Cuba (%)
Place of birth for the foreign-born population - Dominica (%)
Place of birth for the foreign-born population - Dominican Republic (%)
Place of birth for the foreign-born population - Grenada (%)
Place of birth for the foreign-born population - Haiti (%)
Place of birth for the foreign-born population - Jamaica (%)
Place of birth for the foreign-born population - St. Vincent and the Grenadines (%)
Place of birth for the foreign-born population - Trinidad and Tobago (%)
Place of birth for the foreign-born population - West Indies (%)
Place of birth for the foreign-born population - Other Caribbean (%)
Place of birth for the foreign-born population - Belize (%)
Place of birth for the foreign-born population - Costa Rica (%)
Place of birth for the foreign-born population - El Salvador (%)
Place of birth for the foreign-born population - Guatemala (%)
Place of birth for the foreign-born population - Honduras (%)
Place of birth for the foreign-born population - Mexico (%)
Place of birth for the foreign-born population - Nicaragua (%)
Place of birth for the foreign-born population - Panama (%)
Place of birth for the foreign-born population - Other Central America (%)
Place of birth for the foreign-born population - Argentina (%)
Place of birth for the foreign-born population - Bolivia (%)
Place of birth for the foreign-born population - Brazil (%)
Place of birth for the foreign-born population - Chile (%)
Place of birth for the foreign-born population - Colombia (%)
Place of birth for the foreign-born population - Ecuador (%)
Place of birth for the foreign-born population - Guyana (%)
Place of birth for the foreign-born population - Peru (%)
Place of birth for the foreign-born population - Uruguay (%)
Place of birth for the foreign-born population - Venezuela (%)
Place of birth for the foreign-born population - Other South America (%)
Place of birth for the foreign-born population - Canada (%)
Place of birth for the foreign-born population - Other Northern America (%)
Place of birth for the foreign-born population - Other (%)
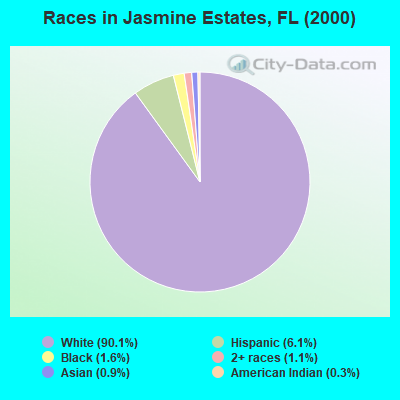
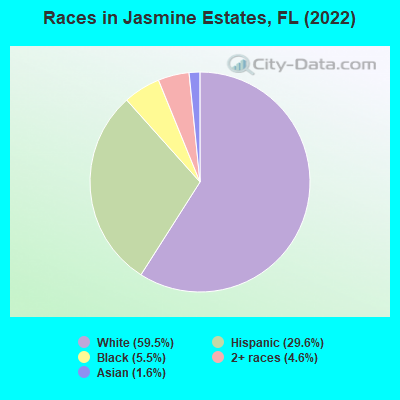
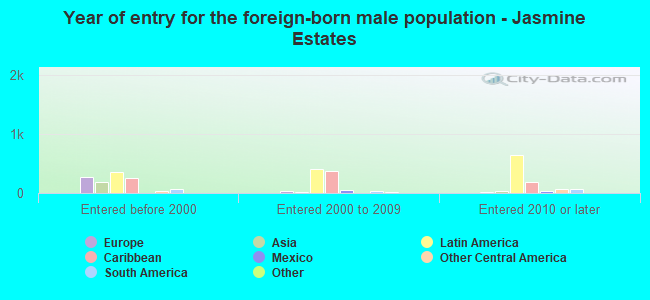
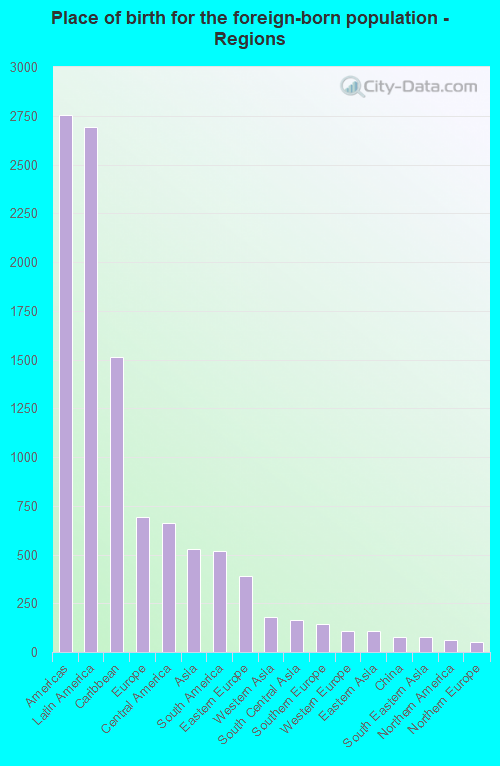
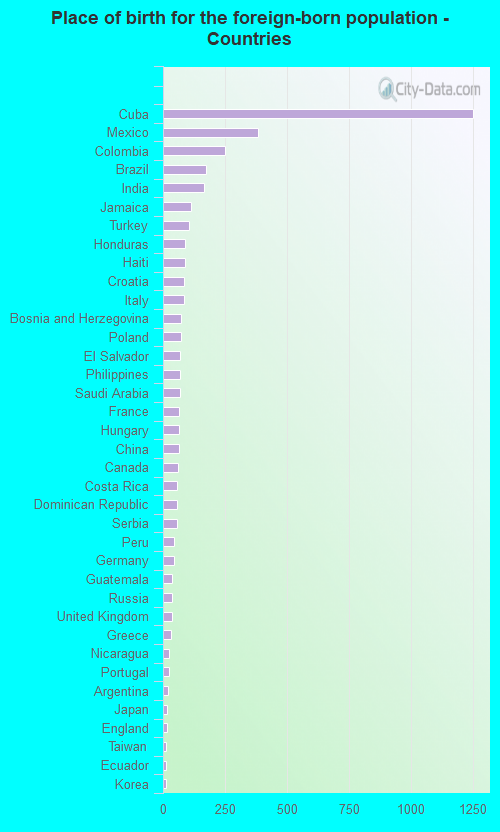
According to 2022 data, the most numerous races in Jasmine Estates, FL are White alone (15,291 residents), Hispanic (7,617 residents), and Black alone (1,418 residents). 76.5% of Jasmine Estates residents speak English at home. 15.5% of Jasmine Estates, FL residents are foreign-born (10.6% born in Latin America, 2.7% born in Europe, 2.1% born in Asia), which is 35.5% less than the foreign-born rate of 21.0% across the entire state of Florida.
Race distribution in Jasmine Estates
2000 2022
10,458,509 65.4% White alone 2,682,715 16.8% Hispanic 2,264,268 14.2% Black alone 261,693 1.6% Asian alone 236,954 1.5% Two or more races 42,358 0.3% American Indian alone 28,994 0.2% Other race alone 6,887 0.04% Native Hawaiian and Other
11,309,403 50.8% White alone 6,025,039 27.1% Hispanic 3,241,015 14.6% Black alone 861,630 3.9% Two or more races 623,692 2.8% Asian alone 152,054 0.7% Other race alone 22,504 0.1% American Indian alone 9,486 0.04% Native Hawaiian and Other
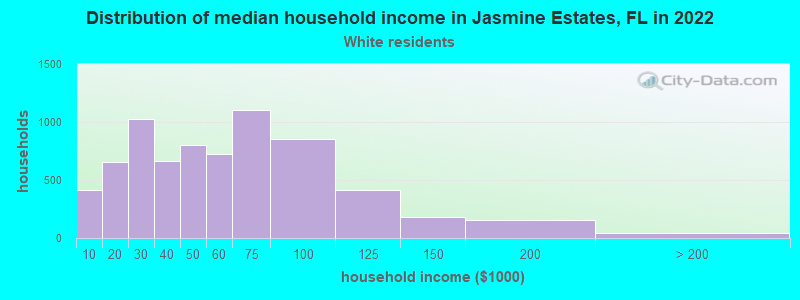
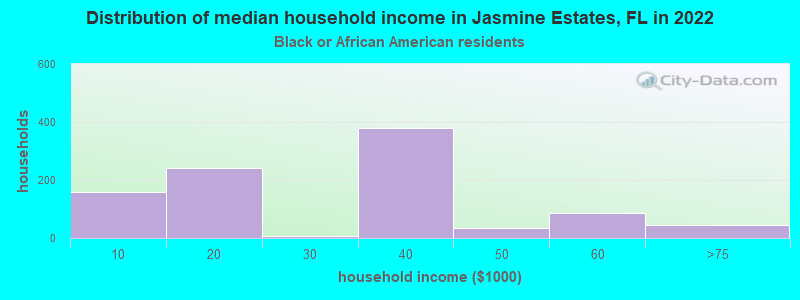
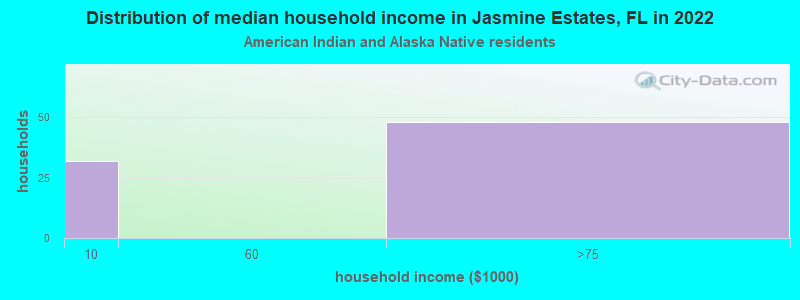
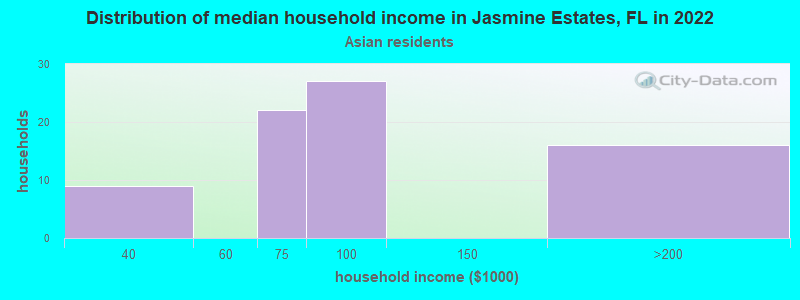
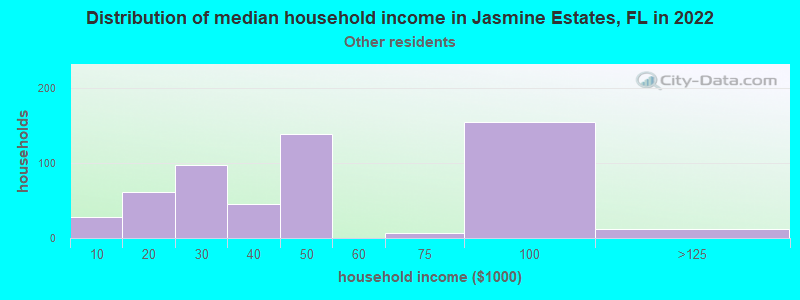
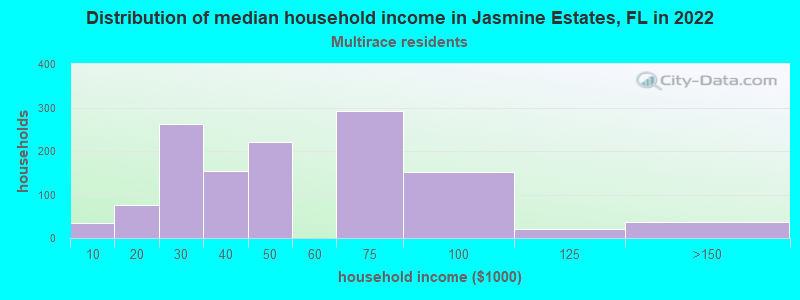
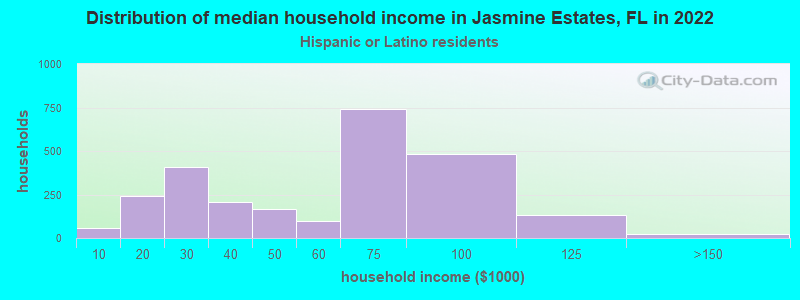
Income and house value in Jasmine Estates Median household income in 2022 $47,959 White non-Hispanic householders$33,774 Black householders$2,583 American Indian and Alaska Native householders$82,205 Asian householders$40,710 Some other race householders$46,586 Two or more races householders$58,237 Hispanic or Latino race householdersMedian 2022 house value $195,498 White Non-Hispanic householders$211,978 Black or African American householders$177,726 American Indian or Alaska Native householders $223,934 Asian householders$214,240 Some other race householders$214,240 Two or more races householders$212,301 Hispanic or Latino householders
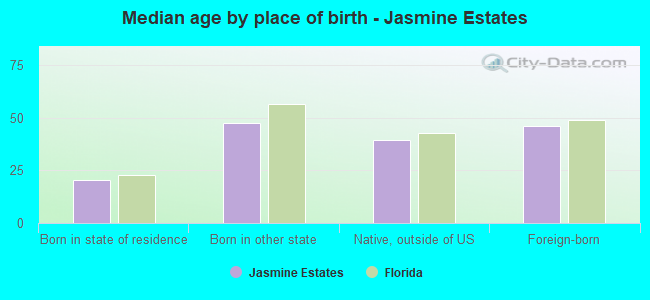
Median age by race in Jasmine Estates
37.9 Median age for White residents35.7 40.4 45.4 Median age for Black or African American residents44.6 47.0 40.0 Median age for American Indian / Alaska Native residents59.5 43.8 62.6 Median age for Asian residents65.4 47.6 -835,555,554.7 Median age for Native Hawaiian / Pacific Islander residents-858,307,848.3 -444,051,825.2 49.6 Median age for Other race residents54.0 46.2 25.4 Median age for Two or more races residents23.1 32.9 40.2 Median age for White alone residents36.9 43.0 32.7 Median age for Hispanic or Latino residents31.7 34.9
Owner/renter occupied households by race in Jasmine Estates
House owners and renters - White residents 4,160 57.4% Owner occupied3,083 42.6% Renter occupiedHouse owners and renters - Black or African American residents 205 26.6% Owner occupied567 73.4% Renter occupiedHouse owners and renters - American Indian / Alaska Native residents 52 74.1% Owner occupied18 25.9% Renter occupiedHouse owners and renters - Asian residents 54 72.7% Owner occupied20 27.3% Renter occupiedHouse owners and renters - Other race residents 498 56.3% Owner occupied387 43.7% Renter occupiedHouse owners and renters - Two or more races residents 782 61.5% Owner occupied489 38.5% Renter occupiedHouse owners and renters - White alone residents 3,785 58.3% Owner occupied2,705 41.7% Renter occupiedHouse owners and renters - Hispanic or Latino residents 1,449 59.4% Owner occupied992 40.6% Renter occupied
Language usage in Jasmine Estates
English speakers - Total 76.5% of residents of Jasmine Estates speak English at home.
17.5% of residents speak Spanish at home 2,459 57.8% Speak English very well1,798 42.2% Speak English less than very well6.7% of residents speak other language at home 1,120 69.1% Speak English very well500 30.9% Speak English less than very well
English speakers - Born in the United States 91.7% of residents of Jasmine Estates speak English at home.
8.1% of residents speak Spanish at home 859 88.6% Speak English very well111 11.4% Speak English less than very well0.3% of residents speak other language at home 31 100.0% Speak English very well
English speakers - Native, born elsewhere 30.5% of residents of Jasmine Estates speak English at home.
62.9% of residents speak Spanish at home 307 82.3% Speak English very well66 17.7% Speak English less than very well5.9% of residents speak other language at home 35 100.0% Speak English very well
English speakers - Foreign-born 16.7% of residents of Jasmine Estates speak English at home.
50.3% of residents speak Spanish at home 714 31.6% Speak English very well1,546 68.4% Speak English less than very well33.0% of residents speak other language at home 953 64.3% Speak English very well529 35.7% Speak English less than very well
White (Caucasian) - Speak only English Native:
96.6% (14,688)Foreign-born:
24.6% (364)
White (Caucasian) - Speak another language Native:
3.8% (572)Foreign-born:
75.3% (1,112)
Black or African American - Speak only English Native:
96.9% (1,023)Foreign-born:
33.5% (123)
Black or African American - Speak another language Native:
2.4% (25)Foreign-born:
61.1% (224)
Asian - Speak only English Native:
100.0% (20)Foreign-born:
8.1% (30)
Other race - Speak only English Native:
19.2% (201)Foreign-born:
9.0% (119)
Other race - Speak another language Native:
84.3% (885)Foreign-born:
90.9% (1,194)
Two or more races - Speak only English Native:
65.1% (1,865)Foreign-born:
5.4% (51)
Two or more races - Speak another language Native:
34.3% (983)Foreign-born:
96.3% (905)
White alone - Speak only English Native:
97.8% (13,359)Foreign-born:
19.3% (198)
White alone - Speak another language Native:
2.2% (296)Foreign-born:
84.4% (865)
Hispanic or Latino - Speak only English Native:
56.6% (2,484)Foreign-born:
10.6% (279)
Hispanic or Latino - Speak another language Native:
42.8% (1,878)Foreign-born:
87.5% (2,290)
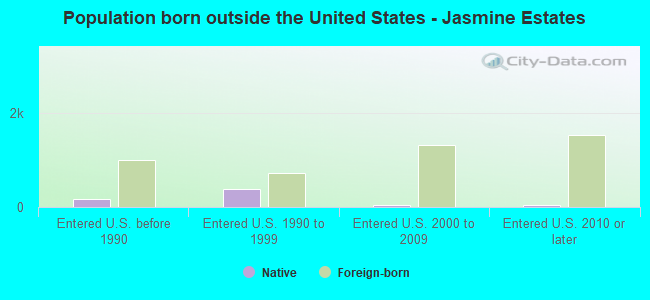
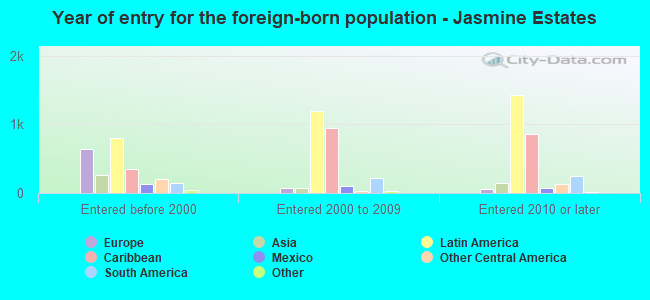
Foreign-born residents in Jasmine Estates 3,983 residents are foreign born (10.6% Latin America , 2.7% Europe , 2.1% Asia ).
This city:
15.5%Florida:
21.1%
Marital status for residents in Jasmine Estates Marital status - White (Caucasian) population 15 years and over
Males 44.0% Never married38.1% Now married2.7% Separated4.9% Widowed10.3% DivorcedFemales 32.1% Never married37.8% Now married4.0% Separated10.5% Widowed15.7% DivorcedWomen who gave birth in the past 12 months Now married:
55.1% (51)Unmarried:
44.9% (42)
Women who did not give birth in the past 12 months Now married:
44.5% (1,881)Unmarried:
55.5% (2,346)
Marital status - Black or African American population 15 years and over
Males 38.8% Never married51.7% Now married0.0% Separated0.0% Widowed9.6% DivorcedFemales 50.1% Never married32.8% Now married7.3% Separated1.1% Widowed8.7% DivorcedWomen who did not give birth in the past 12 months Now married:
38.1% (180)Unmarried:
61.9% (292)
Marital status - American Indian / Alaska Native population 15 years and over
Males 90.7% Never married9.3% Now married0.0% Separated0.0% Widowed0.0% DivorcedFemales 0.0% Never married64.3% Now married0.0% Separated0.0% Widowed35.7% DivorcedMarital status - Asian population 15 years and over
Males 2.4% Never married97.6% Now married0.0% Separated0.0% Widowed0.0% DivorcedFemales 8.5% Never married49.4% Now married0.0% Separated19.3% Widowed22.7% DivorcedWomen who gave birth in the past 12 months Now married:
100.0% (12)Unmarried:
0.0% (0)
Women who did not give birth in the past 12 months Now married:
62.4% (65)Unmarried:
37.6% (39)
Marital status - Other race population 15 years and over
Males 20.5% Never married61.8% Now married0.0% Separated0.0% Widowed17.7% DivorcedFemales 29.3% Never married49.2% Now married0.0% Separated10.3% Widowed11.2% DivorcedWomen who gave birth in the past 12 months Now married:
100.0% (12)Unmarried:
0.0% (0)
Women who did not give birth in the past 12 months Now married:
55.7% (426)Unmarried:
44.3% (339)
Marital status - Two or more races population 15 years and over
Males 52.3% Never married34.8% Now married8.6% Separated1.1% Widowed3.2% DivorcedFemales 46.1% Never married36.8% Now married3.8% Separated4.4% Widowed8.8% DivorcedWomen who gave birth in the past 12 months Now married:
100.0% (37)Unmarried:
0.0% (0)
Women who did not give birth in the past 12 months Now married:
43.6% (344)Unmarried:
56.4% (444)
Marital status - White alone, not Hispanic / Latino population 15 years and over
Males 42.7% Never married37.4% Now married2.7% Separated5.9% Widowed11.3% DivorcedFemales 30.3% Never married37.9% Now married4.0% Separated12.2% Widowed15.7% DivorcedWomen who gave birth in the past 12 months Now married:
55.1% (54)Unmarried:
44.9% (44)
Women who did not give birth in the past 12 months Now married:
44.6% (1,598)Unmarried:
55.4% (1,985)
Marital status - Hispanic or Latino population 15 years and over
Males 43.8% Never married43.5% Now married4.4% Separated0.4% Widowed7.9% DivorcedFemales 39.1% Never married41.4% Now married3.2% Separated2.8% Widowed13.5% DivorcedWomen who gave birth in the past 12 months Now married:
100.0% (36)Unmarried:
0.0% (0)
Women who did not give birth in the past 12 months Now married:
50.5% (958)Unmarried:
49.5% (941)
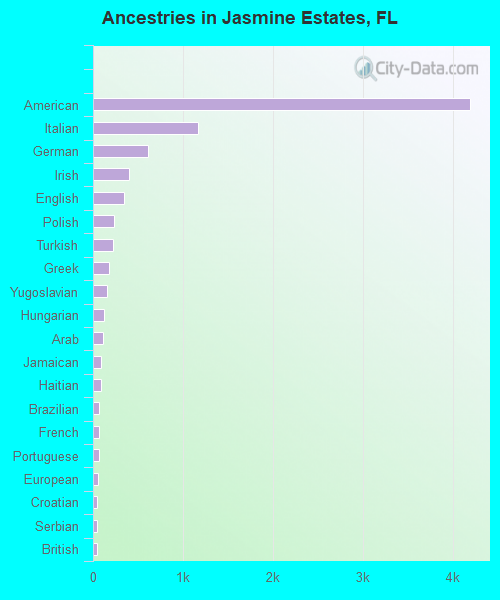
Ancestries in Jasmine Estates
4,196 30.9% American1,168 8.6% Italian612 4.5% German405 3.0% Irish350 2.6% English236 1.7% Polish220 1.6% Turkish180 1.3% Greek161 1.2% Yugoslavian118 0.9% Hungarian114 0.8% Arab93 0.7% Jamaican84 0.6% Haitian72 0.5% Brazilian71 0.5% French69 0.5% Portuguese55 0.4% European49 0.4% Croatian42 0.3% Serbian40 0.3% British35 0.3% Scottish34 0.3% Swedish30 0.2% Dutch21 0.2% Canadian21 0.2% French Canadian21 0.2% Scotch-Irish15 0.1% Austrian14 0.1% Norwegian14 0.1% Ukrainian13 0.10% Russian10 0.07% Romanian6 0.04% Pennsylvania German
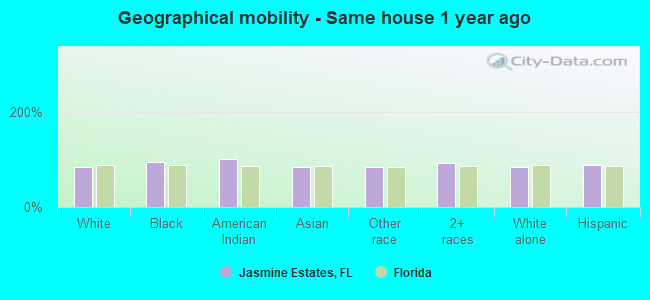
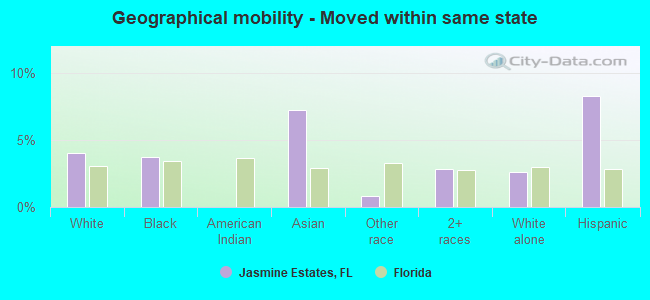
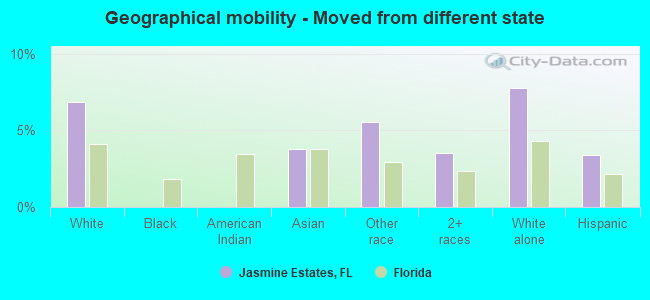
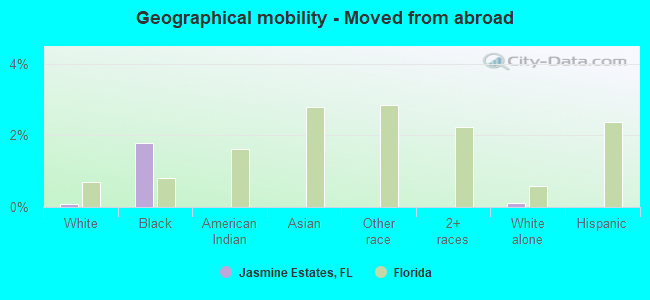
Geographical mobility in Jasmine Estates Same house 1 year ago 14,654 82.9% White (Caucasian)1,374 93.7% Black or African American112 100.0% American Indian / Alaska Native339 83.4% Asian2,023 83.4% Other race3,902 93.2% Two or more races12,567 82.6% White alone, not Hispanic / Latino6,664 87.7% Hispanic or LatinoMoved within same county 1,012 5.7% White / Caucasian8 0.6% Black or African American68 2.8% Other race64 1.5% Two or more races992 6.5% White alone, not Hispanic / Latino121 1.6% Hispanic or LatinoMoved within same state 708 4.0% White / Caucasian54 3.7% Black or African American29 7.2% Asian20 0.8% Other race119 2.8% Two or more races400 2.6% White alone, not Hispanic / Latino628 8.3% Hispanic or LatinoMoved from different state 1,214 6.9% White / Caucasian15 3.8% Asian135 5.6% Other race148 3.5% Two or more races1,182 7.8% White alone, not Hispanic / Latino257 3.4% Hispanic or LatinoMoved from abroad 14 0.1% White26 1.8% Black or African American18 0.1% White alone, not Hispanic / Latino
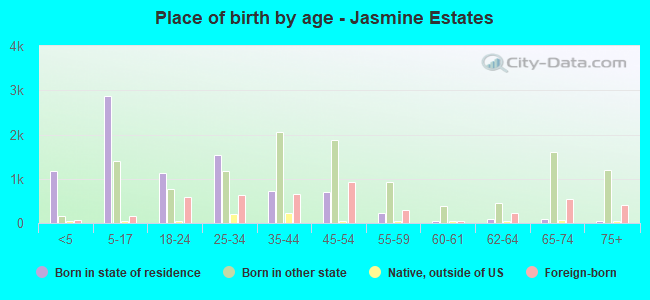
Children Nativity (place of birth) in Jasmine Estates
Children under 6 years - Living with two parents Both parents native 354 100.0% NativeBoth parents foreign-born 135 74.5% Native46 25.5% Foreign-bornOne native, one foreign-born parent 77 100.0% NativeChildren under 6 years - Living with one parent Native parent 666 100.0% NativeForeign-born parent 376 100.0% NativeChildren 6 to 17 years - Living with two parents Both parents native 1,280 99.4% Native7 0.6% Foreign-bornBoth parents foreign-born 136 62.0% Native84 38.0% Foreign-bornOne native, one foreign-born parent 298 100.0% NativeChildren 6 to 17 years - Living with one parent Native parent 2,031 100.0% NativeForeign-born parent 54 50.8% Native52 49.2% Foreign-born
Grandparents responsible for own grandchildren in Jasmine Estates
Grandparents (30 to 59 years) White / Caucasian 4 4.9% Responsible for grandchildren74 95.1% Not responsible for grandchildrenBlack or African American 38 76.4% Responsible for grandchildren12 23.6% Not responsible for grandchildrenAmerican Indian / Alaska Native 14 100.0% Responsible for grandchildrenAsian 26 100.0% Responsible for grandchildrenTwo or more races 121 100.0% Not responsible for grandchildrenWhite alone, not Hispanic / Latino 4 9.8% Responsible for grandchildren37 90.2% Not responsible for grandchildrenHispanic or Latino 9 8.4% Responsible for grandchildren96 91.6% Not responsible for grandchildrenGrandparents (60 years and over) White / Caucasian 92 45.1% Responsible for grandchildren112 54.9% Not responsible for grandchildrenBlack or African American 20 100.0% Responsible for grandchildrenTwo or more races 88 100.0% Not responsible for grandchildrenWhite alone, not Hispanic / Latino 96 62.9% Responsible for grandchildren57 37.1% Not responsible for grandchildrenHispanic or Latino 134 100.0% Not responsible for grandchildren