Races in Jefferson, Georgia (GA) Detailed Stats
Data:
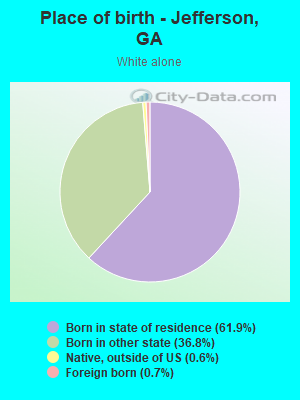
Races - White alone (%)
Races - White alone (% change since 2000)
Races - Black alone (%)
Races - Black alone (% change since 2000)
Races - American Indian alone (%)
Races - American Indian alone (% change since 2000)
Races - Asian alone (%)
Races - Asian alone (% change since 2000)
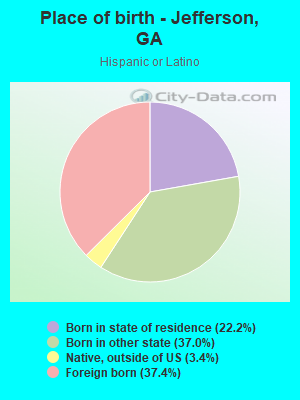
Races - Hispanic (%)
Races - Hispanic (% change since 2000)
Races - Native Hawaiian and Other Pacific Islander alone (%)
Races - Native Hawaiian and Other Pacific Islander alone (% change since 2000)
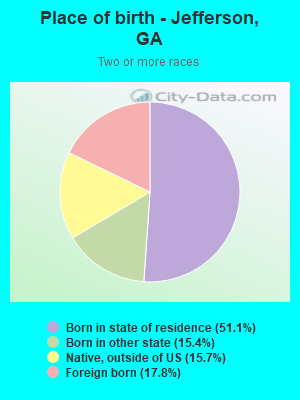
Races - Two or more races(%)
Races - Two or more races(% change since 2000)
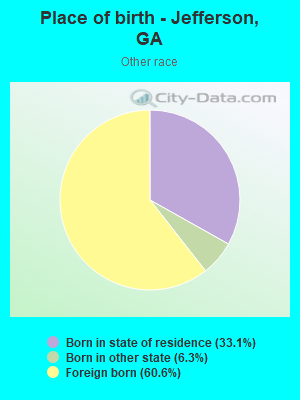
Races - Other race alone (%)
Races - Other race alone (% change since 2000)
Racial diversity
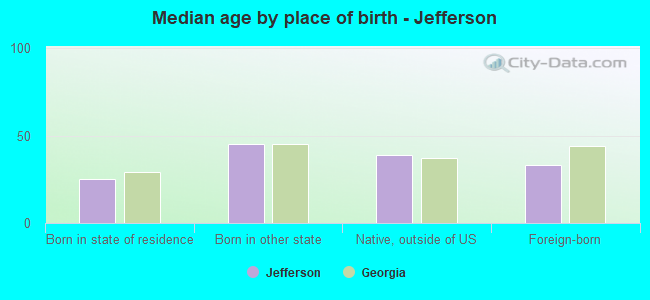
Place of birth - Born in state of residence (%)
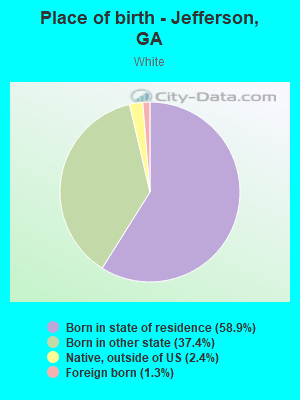
Place of birth - Born in state of residence (%) - White
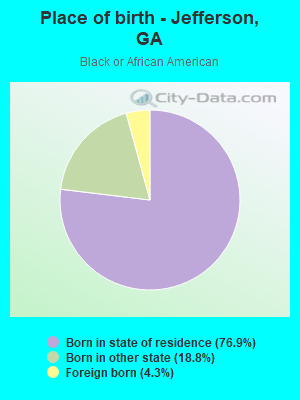
Place of birth - Born in state of residence (%) - Black or African American
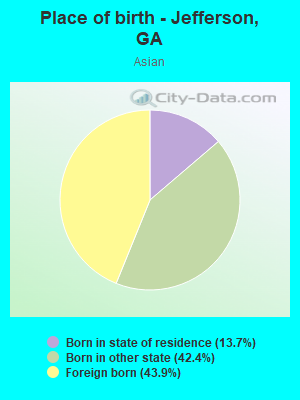
Place of birth - Born in state of residence (%) - Asian
Place of birth - Born in state of residence (%) - Hispanic or Latino
Place of birth - Born in state of residence (%) - American Indian and Alaska Native
Place of birth - Born in state of residence (%) - Multirace
Place of birth - Born in state of residence (%) - Other Race
Place of birth - Born in other state (%)
Place of birth - Born in other state (%) - White
Place of birth - Born in other state (%) - Black or African American
Place of birth - Born in other state (%) - Asian
Place of birth - Born in other state (%) - Hispanic or Latino
Place of birth - Born in other state (%) - American Indian and Alaska Native
Place of birth - Born in other state (%) - Multirace
Place of birth - Born in other state (%) - Other Race
Place of birth - Native, outside of US (%)
Place of birth - Native, outside of US (%) - White
Place of birth - Native, outside of US (%) - Black or African American
Place of birth - Native, outside of US (%) - Asian
Place of birth - Native, outside of US (%) - Hispanic or Latino
Place of birth - Native, outside of US (%) - American Indian and Alaska Native
Place of birth - Native, outside of US (%) - Multirace
Place of birth - Native, outside of US (%) - Other Race
Place of birth - Foreign born (%)
Place of birth - Foreign born (%) - White
Place of birth - Foreign born (%) - Black or African American
Place of birth - Foreign born (%) - Asian
Place of birth - Foreign born (%) - Hispanic or Latino
Place of birth - Foreign born (%) - American Indian and Alaska Native
Place of birth - Foreign born (%) - Multirace
Place of birth - Foreign born (%) - Other Race
Residents speaking English at home (%)
Residents speaking English at home - Born in the United States (%)
Residents speaking English at home - Native, born elsewhere (%)
Residents speaking English at home - Foreign born (%)
Residents speaking Spanish at home (%)
Residents speaking Spanish at home - Born in the United States (%)
Residents speaking Spanish at home - Native, born elsewhere (%)
Residents speaking Spanish at home - Foreign born (%)
Residents speaking other language at home (%)
Residents speaking other language at home - Born in the United States (%)
Residents speaking other language at home - Native, born elsewhere (%)
Residents speaking other language at home - Foreign born (%)
Marital status - Never married (%)
Marital status - Now married (%)
Marital status - Separated (%)
Marital status - Widowed (%)
Marital status - Divorced (%)
Ancestries Reported - Arab (%)
Ancestries Reported - Czech (%)
Ancestries Reported - Danish (%)
Ancestries Reported - Dutch (%)
Ancestries Reported - English (%)
Ancestries Reported - French (%)
Ancestries Reported - French Canadian (%)
Ancestries Reported - German (%)
Ancestries Reported - Greek (%)
Ancestries Reported - Hungarian (%)
Ancestries Reported - Irish (%)
Ancestries Reported - Italian (%)
Ancestries Reported - Lithuanian (%)
Ancestries Reported - Norwegian (%)
Ancestries Reported - Polish (%)
Ancestries Reported - Portuguese (%)
Ancestries Reported - Russian (%)
Ancestries Reported - Scotch-Irish (%)
Ancestries Reported - Scottish (%)
Ancestries Reported - Slovak (%)
Ancestries Reported - Subsaharan African (%)
Ancestries Reported - Swedish (%)
Ancestries Reported - Swiss (%)
Ancestries Reported - Ukrainian (%)
Ancestries Reported - United States (%)
Ancestries Reported - Welsh (%)
Ancestries Reported - West Indian (%)
Ancestries Reported - Other (%)
Geographical mobility - Same house 1 year ago (%)
Geographical mobility - Same house 1 year ago (%) - White
Geographical mobility - Same house 1 year ago (%) - Black or African American
Geographical mobility - Same house 1 year ago (%) - Asian
Geographical mobility - Same house 1 year ago (%) - Hispanic or Latino
Geographical mobility - Same house 1 year ago (%) - American Indian and Alaska Native
Geographical mobility - Same house 1 year ago (%) - Multirace
Geographical mobility - Same house 1 year ago (%) - Other Race
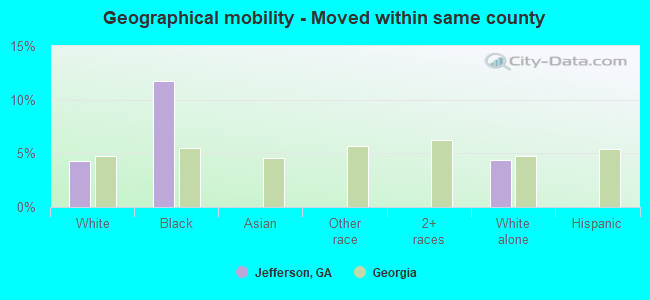
Geographical mobility - Moved within same county (%)
Geographical mobility - Moved within same county (%) - White
Geographical mobility - Moved within same county (%) - Black or African American
Geographical mobility - Moved within same county (%) - Asian
Geographical mobility - Moved within same county (%) - Hispanic or Latino
Geographical mobility - Moved within same county (%) - American Indian and Alaska Native
Geographical mobility - Moved within same county (%) - Multirace
Geographical mobility - Moved within same county (%) - Other Race
Geographical mobility - Moved from different county within same state (%)
Geographical mobility - Moved from different county within same state (%) - White
Geographical mobility - Moved from different county within same state (%) - Black or African American
Geographical mobility - Moved from different county within same state (%) - Asian
Geographical mobility - Moved from different county within same state (%) - Hispanic or Latino
Geographical mobility - Moved from different county within same state (%) - American Indian and Alaska Native
Geographical mobility - Moved from different county within same state (%) - Multirace
Geographical mobility - Moved from different county within same state (%) - Other Race
Geographical mobility - Moved from different state (%)
Geographical mobility - Moved from different state (%) - White
Geographical mobility - Moved from different state (%) - Black or African American
Geographical mobility - Moved from different state (%) - Asian
Geographical mobility - Moved from different state (%) - Hispanic or Latino
Geographical mobility - Moved from different state (%) - American Indian and Alaska Native
Geographical mobility - Moved from different state (%) - Multirace
Geographical mobility - Moved from different state (%) - Other Race
Geographical mobility - Moved from abroad (%)
Geographical mobility - Moved from abroad (%) - White
Geographical mobility - Moved from abroad (%) - Black or African American
Geographical mobility - Moved from abroad (%) - Asian
Geographical mobility - Moved from abroad (%) - Hispanic or Latino
Geographical mobility - Moved from abroad (%) - American Indian and Alaska Native
Geographical mobility - Moved from abroad (%) - Multirace
Geographical mobility - Moved from abroad (%) - Other Race
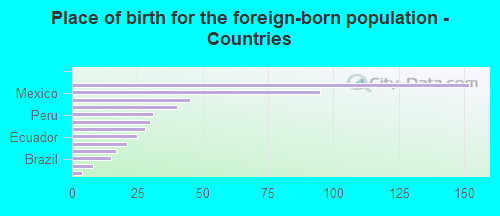
Place of birth for the foreign-born population - Ireland (%)
Place of birth for the foreign-born population - Denmark (%)
Place of birth for the foreign-born population - Norway (%)
Place of birth for the foreign-born population - Sweden (%)
Place of birth for the foreign-born population - United Kingdom (%)
Place of birth for the foreign-born population - England (%)
Place of birth for the foreign-born population - Scotland (%)
Place of birth for the foreign-born population - Other Northern Europe (%)
Place of birth for the foreign-born population - Austria (%)
Place of birth for the foreign-born population - Belgium (%)
Place of birth for the foreign-born population - France (%)
Place of birth for the foreign-born population - Germany (%)
Place of birth for the foreign-born population - Netherlands (%)
Place of birth for the foreign-born population - Switzerland (%)
Place of birth for the foreign-born population - Other Western Europe (%)
Place of birth for the foreign-born population - Greece (%)
Place of birth for the foreign-born population - Italy (%)
Place of birth for the foreign-born population - Portugal (%)
Place of birth for the foreign-born population - Spain (%)
Place of birth for the foreign-born population - Other Southern Europe (%)
Place of birth for the foreign-born population - Albania (%)
Place of birth for the foreign-born population - Belarus (%)
Place of birth for the foreign-born population - Bosnia and Herzegovina (%)
Place of birth for the foreign-born population - Bulgaria (%)
Place of birth for the foreign-born population - Croatia (%)
Place of birth for the foreign-born population - Czechoslovakia (%)
Place of birth for the foreign-born population - Hungary (%)
Place of birth for the foreign-born population - Latvia (%)
Place of birth for the foreign-born population - Lithuania (%)
Place of birth for the foreign-born population - North Macedonia (Macedonia) (%)
Place of birth for the foreign-born population - Moldova (%)
Place of birth for the foreign-born population - Poland (%)
Place of birth for the foreign-born population - Romania (%)
Place of birth for the foreign-born population - Russia (%)
Place of birth for the foreign-born population - Serbia (%)
Place of birth for the foreign-born population - Ukraine (%)
Place of birth for the foreign-born population - Other Eastern Europe (%)
Place of birth for the foreign-born population - China (%)
Place of birth for the foreign-born population - Hong Kong (%)
Place of birth for the foreign-born population - Taiwan (%)
Place of birth for the foreign-born population - Japan (%)
Place of birth for the foreign-born population - Korea (%)
Place of birth for the foreign-born population - Other Eastern Asia (%)
Place of birth for the foreign-born population - Afghanistan (%)
Place of birth for the foreign-born population - Bangladesh (%)
Place of birth for the foreign-born population - India (%)
Place of birth for the foreign-born population - Iran (%)
Place of birth for the foreign-born population - Kazakhstan (%)
Place of birth for the foreign-born population - Nepal (%)
Place of birth for the foreign-born population - Pakistan (%)
Place of birth for the foreign-born population - Sri Lanka (%)
Place of birth for the foreign-born population - Uzbekistan (%)
Place of birth for the foreign-born population - Other South Central Asia (%)
Place of birth for the foreign-born population - Burma (%)
Place of birth for the foreign-born population - Cambodia (%)
Place of birth for the foreign-born population - Indonesia (%)
Place of birth for the foreign-born population - Laos (%)
Place of birth for the foreign-born population - Malaysia (%)
Place of birth for the foreign-born population - Philippines (%)
Place of birth for the foreign-born population - Singapore (%)
Place of birth for the foreign-born population - Thailand (%)
Place of birth for the foreign-born population - Vietnam (%)
Place of birth for the foreign-born population - Other South Eastern Asia (%)
Place of birth for the foreign-born population - Armenia (%)
Place of birth for the foreign-born population - Iraq (%)
Place of birth for the foreign-born population - Israel (%)
Place of birth for the foreign-born population - Jordan (%)
Place of birth for the foreign-born population - Kuwait (%)
Place of birth for the foreign-born population - Lebanon (%)
Place of birth for the foreign-born population - Saudi Arabia (%)
Place of birth for the foreign-born population - Syria (%)
Place of birth for the foreign-born population - Turkey (%)
Place of birth for the foreign-born population - Yemen (%)
Place of birth for the foreign-born population - Other Western Asia (%)
Place of birth for the foreign-born population - Eritrea (%)
Place of birth for the foreign-born population - Ethiopia (%)
Place of birth for the foreign-born population - Kenya (%)
Place of birth for the foreign-born population - Somalia (%)
Place of birth for the foreign-born population - Uganda (%)
Place of birth for the foreign-born population - Zimbabwe (%)
Place of birth for the foreign-born population - Other Eastern Africa (%)
Place of birth for the foreign-born population - Cameroon (%)
Place of birth for the foreign-born population - Congo (%)
Place of birth for the foreign-born population - Democratic Republic of Congo (Zaire) (%)
Place of birth for the foreign-born population - Other Middle Africa (%)
Place of birth for the foreign-born population - Egypt (%)
Place of birth for the foreign-born population - Morocco (%)
Place of birth for the foreign-born population - Sudan (%)
Place of birth for the foreign-born population - Other Northern Africa (%)
Place of birth for the foreign-born population - South Africa (%)
Place of birth for the foreign-born population - Other Southern Africa (%)
Place of birth for the foreign-born population - Cabo Verde (%)
Place of birth for the foreign-born population - Ghana (%)
Place of birth for the foreign-born population - Liberia (%)
Place of birth for the foreign-born population - Nigeria (%)
Place of birth for the foreign-born population - Senegal (%)
Place of birth for the foreign-born population - Sierra Leone (%)
Place of birth for the foreign-born population - Other Western Africa (%)
Place of birth for the foreign-born population - Australia (%)
Place of birth for the foreign-born population - New Zealand (%)
Place of birth for the foreign-born population - Fiji (%)
Place of birth for the foreign-born population - Micronesia (%)
Place of birth for the foreign-born population - Bahamas (%)
Place of birth for the foreign-born population - Barbados (%)
Place of birth for the foreign-born population - Cuba (%)
Place of birth for the foreign-born population - Dominica (%)
Place of birth for the foreign-born population - Dominican Republic (%)
Place of birth for the foreign-born population - Grenada (%)
Place of birth for the foreign-born population - Haiti (%)
Place of birth for the foreign-born population - Jamaica (%)
Place of birth for the foreign-born population - St. Vincent and the Grenadines (%)
Place of birth for the foreign-born population - Trinidad and Tobago (%)
Place of birth for the foreign-born population - West Indies (%)
Place of birth for the foreign-born population - Other Caribbean (%)
Place of birth for the foreign-born population - Belize (%)
Place of birth for the foreign-born population - Costa Rica (%)
Place of birth for the foreign-born population - El Salvador (%)
Place of birth for the foreign-born population - Guatemala (%)
Place of birth for the foreign-born population - Honduras (%)
Place of birth for the foreign-born population - Mexico (%)
Place of birth for the foreign-born population - Nicaragua (%)
Place of birth for the foreign-born population - Panama (%)
Place of birth for the foreign-born population - Other Central America (%)
Place of birth for the foreign-born population - Argentina (%)
Place of birth for the foreign-born population - Bolivia (%)
Place of birth for the foreign-born population - Brazil (%)
Place of birth for the foreign-born population - Chile (%)
Place of birth for the foreign-born population - Colombia (%)
Place of birth for the foreign-born population - Ecuador (%)
Place of birth for the foreign-born population - Guyana (%)
Place of birth for the foreign-born population - Peru (%)
Place of birth for the foreign-born population - Uruguay (%)
Place of birth for the foreign-born population - Venezuela (%)
Place of birth for the foreign-born population - Other South America (%)
Place of birth for the foreign-born population - Canada (%)
Place of birth for the foreign-born population - Other Northern America (%)
Place of birth for the foreign-born population - Other (%)
Latest news about races in Jefferson, GA collected exclusively by city-data.com from local newspapers, TV, and radio stations
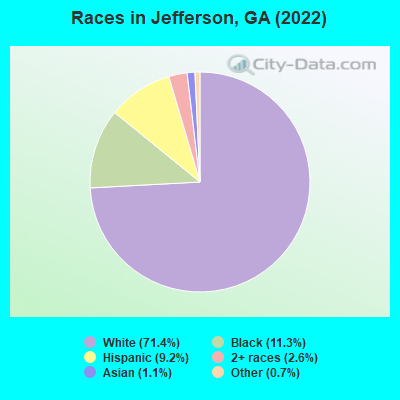
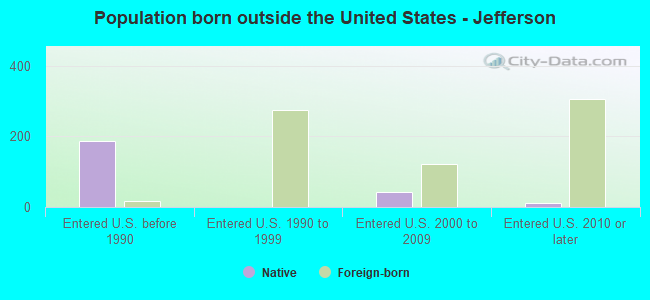
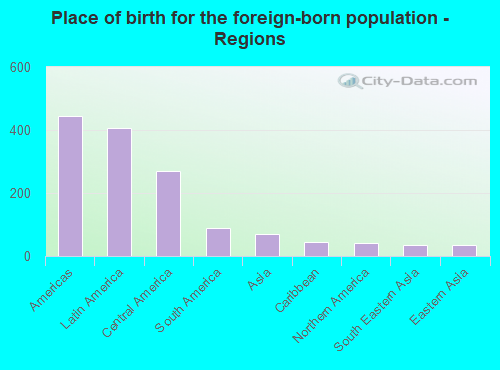
According to 2022 data, the most numerous races in Jefferson, GA are White alone (10,504 residents), Black alone (1,664 residents), and Hispanic (1,357 residents). 91.6% of Jefferson residents speak English at home. 3.5% of Jefferson, GA residents are foreign-born (2.9% born in Latin America, 0.5% born in Asia), which is 184.4% less than the foreign-born rate of 10.0% across the entire state of Georgia.
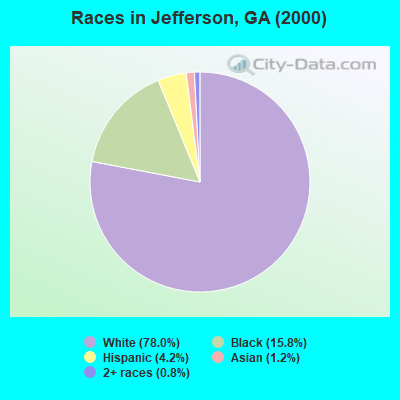
Race distribution in Jefferson
2000 2022
5,128,661 62.6% White alone 2,331,465 28.5% Black alone 435,227 5.3% Hispanic 171,513 2.1% Asian alone 87,364 1.1% Two or more races 17,670 0.2% American Indian alone 11,275 0.1% Other race alone 3,278 0.04% Native Hawaiian and Other
5,415,657 49.6% White alone 3,349,240 30.7% Black alone 1,132,604 10.4% Hispanic 479,156 4.4% Asian alone 462,923 4.2% Two or more races 54,416 0.5% Other race alone 11,923 0.1% American Indian alone 6,957 0.06% Native Hawaiian and Other
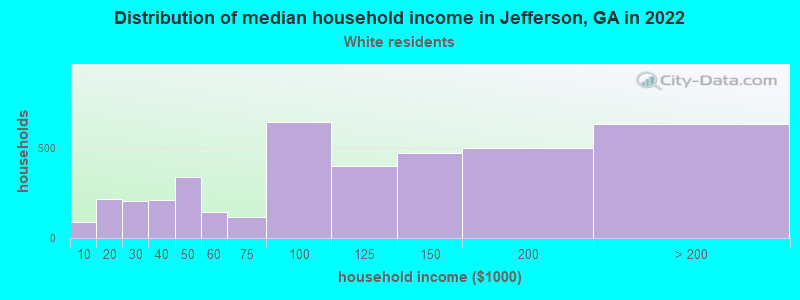
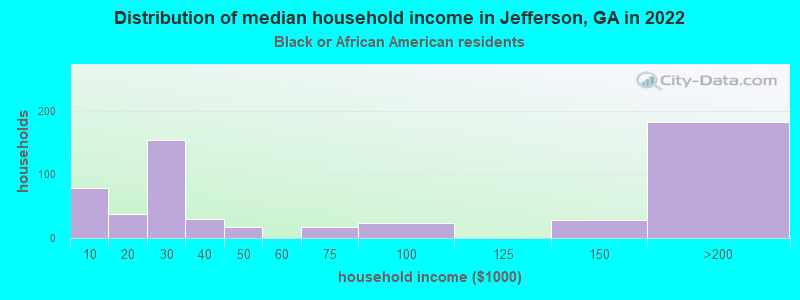
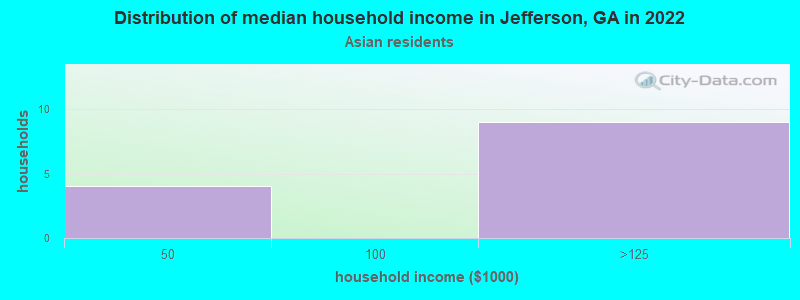
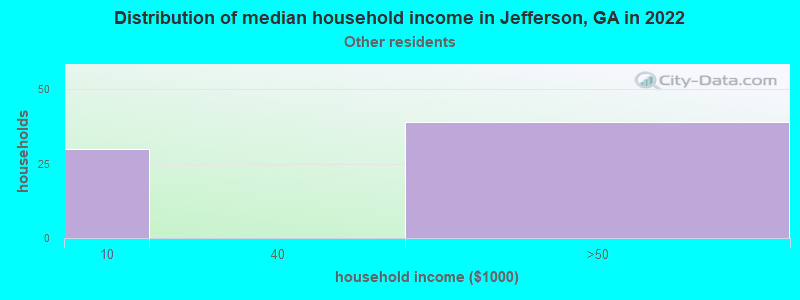
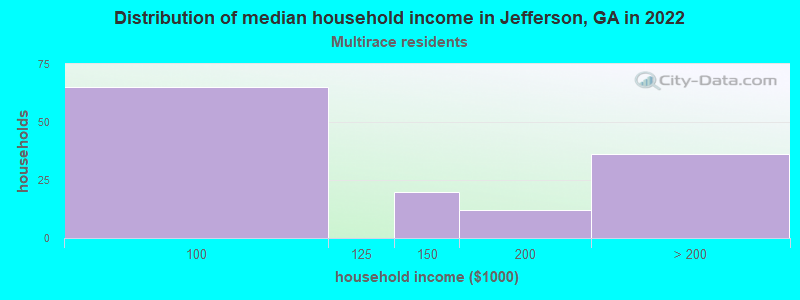
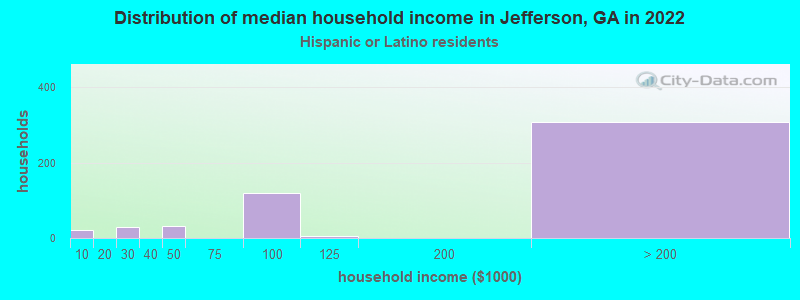
Income and house value in Jefferson Median household income in 2022 $100,666 White non-Hispanic householders$128,396 Two or more races householdersover $200,000 Hispanic or Latino race householdersMedian 2022 house value $404,261 White Non-Hispanic householders$208,640 Black or African American householders $427,629 Asian householders$250,368 Two or more races householders$542,465 Hispanic or Latino householders
Median age by race in Jefferson
35.8 Median age for White residents33.6 38.3 43.3 Median age for Black or African American residents31.5 45.9 -597,462,513.8 Median age for American Indian / Alaska Native residents-666,666,666.0 -666,666,666.0 38.4 Median age for Asian residents26.0 39.0 -666,666,666.0 Median age for Native Hawaiian / Pacific Islander residents-666,666,666.0 -666,666,666.0 28.7 Median age for Other race residents21.2 29.6 14.9 Median age for Two or more races residents41.1 14.7 36.0 Median age for White alone residents33.7 38.8 29.8 Median age for Hispanic or Latino residents23.9 34.2
Owner/renter occupied households by race in Jefferson
House owners and renters - White residents 3,455 87.9% Owner occupied473 12.1% Renter occupiedHouse owners and renters - Black or African American residents 262 57.6% Owner occupied193 42.4% Renter occupiedHouse owners and renters - Asian residents 16 100.0% Owner occupiedHouse owners and renters - Other race residents 64 100.0% Renter occupiedHouse owners and renters - Two or more races residents 133 100.0% Owner occupiedHouse owners and renters - White alone residents 3,112 86.9% Owner occupied469 13.1% Renter occupiedHouse owners and renters - Hispanic or Latino residents 436 89.7% Owner occupied50 10.3% Renter occupied
Language usage in Jefferson
English speakers - Total 91.6% of residents of Jefferson speak English at home.
5.5% of residents speak Spanish at home 476 63.3% Speak English very well276 36.7% Speak English less than very well2.0% of residents speak other language at home 229 82.4% Speak English very well49 17.6% Speak English less than very well
English speakers - Born in the United States 93.0% of residents of Jefferson speak English at home.
3.7% of residents speak Spanish at home 173 100.0% Speak English very well1.1% of residents speak other language at home 32 62.7% Speak English very well19 37.3% Speak English less than very well
English speakers - Native, born elsewhere 38.9% of residents of Jefferson speak English at home.
11.9% of residents speak Spanish at home 32 100.0% Speak English very well
English speakers - Foreign-born 19.8% of residents of Jefferson speak English at home.
56.6% of residents speak Spanish at home 236 51.3% Speak English very well224 48.7% Speak English less than very well22.8% of residents speak other language at home 140 75.7% Speak English very well45 24.3% Speak English less than very well
White (Caucasian) - Speak only English Native:
98.6% (10,039)Foreign-born:
48.0% (68)
White (Caucasian) - Speak another language Native:
1.5% (154)Foreign-born:
26.4% (37)
Black or African American - Speak another language Native:
0.5% (9)Foreign-born:
100.0% (50)
Asian - Speak only English Native:
27.9% (22)Foreign-born:
5.4% (4)
Asian - Speak another language Native:
73.5% (59)Foreign-born:
95.3% (66)
Two or more races - Speak another language Native:
34.5% (157)Foreign-born:
70.5% (82)
White alone - Speak only English Native:
99.2% (9,720)Foreign-born:
59.9% (43)
Hispanic or Latino - Speak only English Native:
51.6% (376)Foreign-born:
6.0% (32)
Hispanic or Latino - Speak another language Native:
35.8% (261)Foreign-born:
92.9% (493)
Foreign-born residents in Jefferson 517 residents are foreign born (2.9% Latin America , 0.5% Asia ).
This city:
3.5%Georgia:
10.4%
Marital status for residents in Jefferson Marital status - White (Caucasian) population 15 years and over
Males 30.2% Never married61.6% Now married0.9% Separated1.3% Widowed6.0% DivorcedFemales 14.4% Never married64.4% Now married0.3% Separated6.9% Widowed14.0% DivorcedWomen who gave birth in the past 12 months Now married:
18.4% (16)Unmarried:
81.6% (71)
Women who did not give birth in the past 12 months Now married:
67.6% (1,530)Unmarried:
32.4% (735)
Marital status - Black or African American population 15 years and over
Males 71.7% Never married27.0% Now married1.3% Separated0.0% Widowed0.0% DivorcedFemales 39.2% Never married27.0% Now married8.8% Separated9.9% Widowed15.1% DivorcedWomen who gave birth in the past 12 months Now married:
0.0% (0)Unmarried:
100.0% (20)
Women who did not give birth in the past 12 months Now married:
39.1% (177)Unmarried:
60.9% (276)
Marital status - Asian population 15 years and over
Males 29.8% Never married70.2% Now married0.0% Separated0.0% Widowed0.0% DivorcedFemales 6.1% Never married77.3% Now married0.0% Separated16.7% Widowed0.0% DivorcedWomen who gave birth in the past 12 months Now married:
100.0% (30)Unmarried:
0.0% (0)
Women who did not give birth in the past 12 months Now married:
75.0% (12)Unmarried:
25.0% (4)
Marital status - Other race population 15 years and over
Males 48.5% Never married51.5% Now married0.0% Separated0.0% Widowed0.0% DivorcedFemales 50.0% Never married50.0% Now married0.0% Separated0.0% Widowed0.0% DivorcedWomen who did not give birth in the past 12 months Now married:
32.0% (31)Unmarried:
68.0% (66)
Marital status - Two or more races population 15 years and over
Males 0.0% Never married82.9% Now married0.0% Separated0.0% Widowed17.1% DivorcedFemales 42.3% Never married57.7% Now married0.0% Separated0.0% Widowed0.0% DivorcedWomen who did not give birth in the past 12 months Now married:
57.7% (89)Unmarried:
42.3% (65)
Marital status - White alone, not Hispanic / Latino population 15 years and over
Males 30.9% Never married60.2% Now married1.0% Separated1.4% Widowed6.5% DivorcedFemales 13.9% Never married64.3% Now married0.3% Separated7.1% Widowed14.4% DivorcedWomen who gave birth in the past 12 months Now married:
18.4% (16)Unmarried:
81.6% (72)
Women who did not give birth in the past 12 months Now married:
68.1% (1,512)Unmarried:
31.9% (709)
Marital status - Hispanic or Latino population 15 years and over
Males 26.4% Never married70.8% Now married0.0% Separated0.0% Widowed2.8% DivorcedFemales 35.6% Never married64.4% Now married0.0% Separated0.0% Widowed0.0% DivorcedWomen who did not give birth in the past 12 months Now married:
48.7% (128)Unmarried:
51.3% (135)
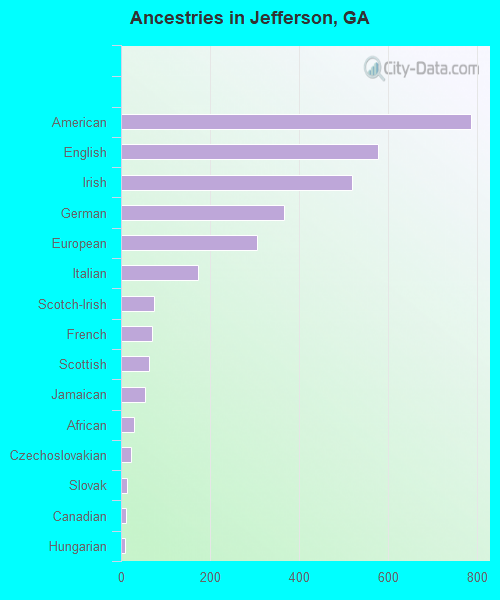
Ancestries in Jefferson
787 13.6% American576 10.0% English519 9.0% Irish365 6.3% German306 5.3% European173 3.0% Italian74 1.3% Scotch-Irish70 1.2% French63 1.1% Scottish53 0.9% Jamaican30 0.5% African22 0.4% Czechoslovakian14 0.2% Slovak12 0.2% Canadian10 0.2% Hungarian6 0.1% Eastern European3 0.05% British
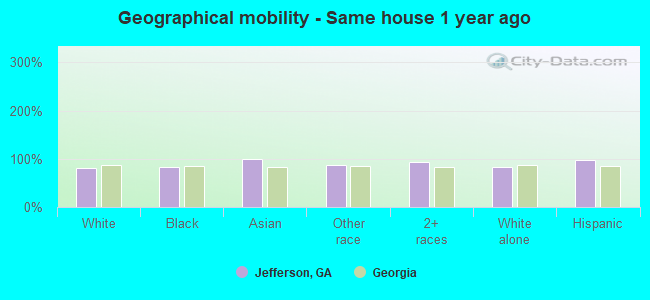
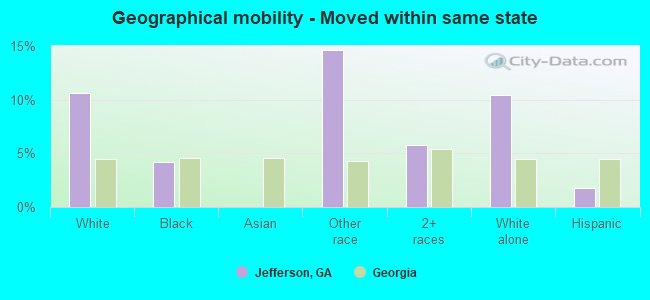
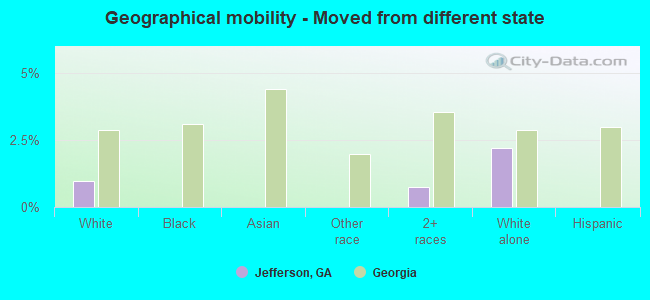
Geographical mobility in Jefferson Same house 1 year ago 8,891 81.3% White (Caucasian)1,641 81.7% Black or African American154 99.9% Asian441 87.5% Other race482 93.6% Two or more races8,548 82.2% White alone, not Hispanic / Latino1,136 98.0% Hispanic or LatinoMoved within same county 467 4.3% White / Caucasian236 11.7% Black or African American458 4.4% White alone, not Hispanic / LatinoMoved within same state 1,159 10.6% White / Caucasian84 4.2% Black or African American74 14.6% Other race30 5.8% Two or more races1,082 10.4% White alone, not Hispanic / Latino21 1.8% Hispanic or LatinoMoved from different state 105 1.0% White / Caucasian4 0.8% Two or more races230 2.2% White alone, not Hispanic / Latino
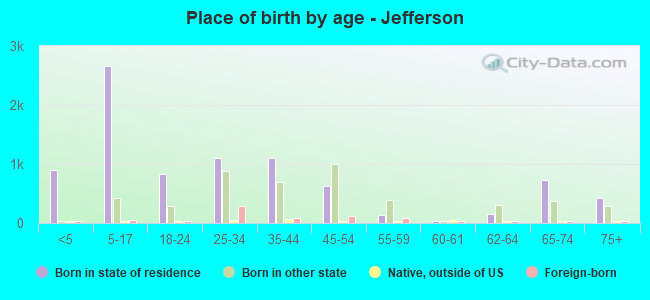
Children Nativity (place of birth) in Jefferson
Children under 6 years - Living with two parents Both parents native 672 100.0% NativeOne native, one foreign-born parent 78 100.0% NativeChildren under 6 years - Living with one parent Native parent 208 100.0% NativeForeign-born parent 49 100.0% NativeChildren 6 to 17 years - Living with two parents Both parents native 2,114 99.8% Native4 0.2% Foreign-bornBoth parents foreign-born 52 100.0% NativeOne native, one foreign-born parent 52 100.0% NativeChildren 6 to 17 years - Living with one parent Native parent 474 100.0% NativeForeign-born parent 85 61.3% Native54 38.7% Foreign-born
Grandparents responsible for own grandchildren in Jefferson
Grandparents (30 to 59 years) Black or African American 14 100.0% Responsible for grandchildren
Grandparents (60 years and over) Black or African American 8 100.0% Not responsible for grandchildren