Races in Jefferson, New Hampshire (NH) Detailed Stats
Ancestries, Foreign-born residents, place of birth

Recent posts about races in Jefferson, New Hampshire on our local forum with over 2,400,000 registered users:

Latest news about races in Jefferson, NH collected exclusively by city-data.com from local newspapers, TV, and radio stations
2.3% of Jefferson, NH residents are foreign-born (2.2% born in North America), which is 118.7% less than the foreign-born rate of 5.0% across the entire state of New Hampshire.
Race distribution in Jefferson

- 98898.2%White alone
- 141.4%Two or more races
- 10.10%Hispanic
- 10.10%Asian alone
- 10.10%American Indian alone
- 10.10%Native Hawaiian and Other
Pacific Islander alone

2000
2022
-
- 1,175,25295.1%White alone
- 20,4891.7%Hispanic
- 15,8031.3%Asian alone
- 11,6060.9%Two or more races
- 8,3540.7%Black alone
- 2,6980.2%American Indian alone
- 1,2540.1%Other race alone
- 3300.03%Native Hawaiian and Other
Pacific Islander alone

-
- 1,208,10186.6%White alone
- 63,4794.5%Hispanic
- 60,7244.4%Two or more races
- 36,5192.6%Asian alone
- 17,9311.3%Black alone
- 6,6150.5%Other race alone
- 1,0140.07%American Indian alone
- 8480.06%Native Hawaiian and Other
Pacific Islander alone

Income and house value in Jefferson
- Median household income in 2022
- $79,639White non-Hispanic householders
- $57,709American Indian and Alaska Native householders
- $33,492Two or more races householders
- Median 2022 house value
- $233,240White Non-Hispanic householders
Household income for White non-Hispanic householders

Household income for American Indian and Alaska Native householders

Household income for Two or more races householders

Foreign-born residents in Jefferson
23 residents are foreign born (2.2% North America).
| This city: | 2.3% |
| New Hampshire: | 4.4% |
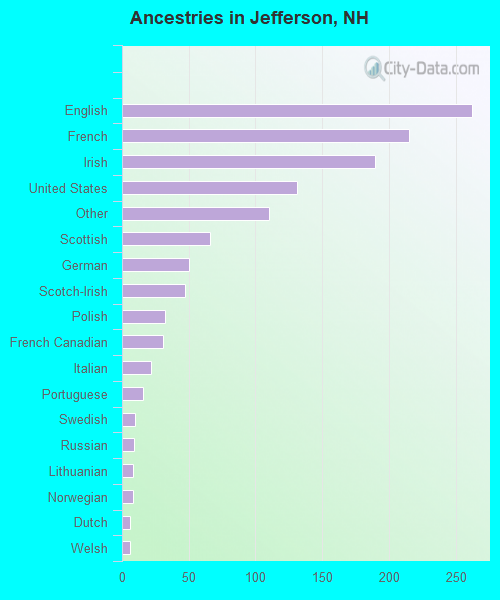
Ancestries in Jefferson

- 26221.3%English
- 21517.5%French
- 19015.5%Irish
- 13110.7%United States
- 1109.0%Other
- 665.4%Scottish
- 504.1%German
- 473.8%Scotch-Irish
- 322.6%Polish
- 312.5%French Canadian
- 221.8%Italian
- 161.3%Portuguese
- 100.8%Swedish
- 90.7%Russian
- 80.7%Lithuanian
- 80.7%Norwegian
- 60.5%Dutch
- 60.5%Welsh
- 20.2%Czech
- 20.2%Danish
- 20.2%Subsaharan African
- 20.2%Ukrainian
- 10.08%Hungarian
Zip codes: 03583.