Races in Jewett, New York (NY) Detailed Stats
Ancestries, Foreign-born residents, place of birth

Recent posts about races in Jewett, New York on our local forum with over 2,400,000 registered users:
 | African American migration to Staten Island! (60 replies) |
| Google Street View Reveals More of Buffalo's Transformation Since 2007 (43 replies) |
| Why do people hate Staten Island? (326 replies) |
| looking for "nature" trip/vacation... (22 replies) |
| What about Graniteville in Staten Island? Ok? (54 replies) |
| NYCHA houses (25 replies) |
11.0% of Jewett, NY residents are foreign-born (8.4% born in Europe, 1.2% born in Asia, 1.1% born in Oceania), which is 99.4% less than the foreign-born rate of 22.0% across the entire state of New York.
Race distribution in Jewett

- 93095.9%White alone
- 293.0%Hispanic
- 60.6%Two or more races
- 40.4%Asian alone
- 10.1%Black alone

2000
2022
-
- 11,760,98162.0%White alone
- 2,867,58315.1%Hispanic
- 2,812,62314.8%Black alone
- 1,035,9265.5%Asian alone
- 366,1161.9%Two or more races
- 75,4990.4%Other race alone
- 52,4990.3%American Indian alone
- 5,2300.03%Native Hawaiian and Other
Pacific Islander alone

-
- 10,408,93352.9%White alone
- 3,867,29919.7%Hispanic
- 2,633,84013.4%Black alone
- 1,776,2869.0%Asian alone
- 732,6703.7%Two or more races
- 216,1101.1%Other race alone
- 35,0820.2%American Indian alone
- 6,9310.04%Native Hawaiian and Other
Pacific Islander alone

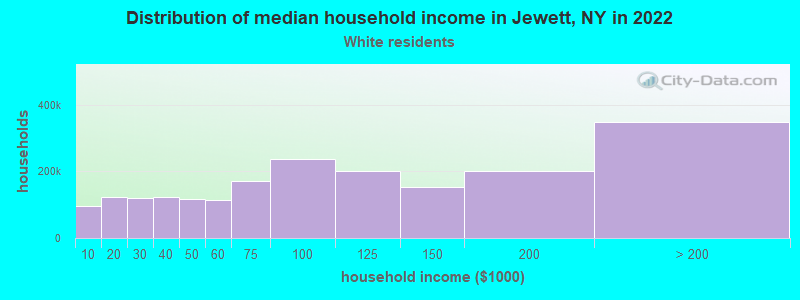
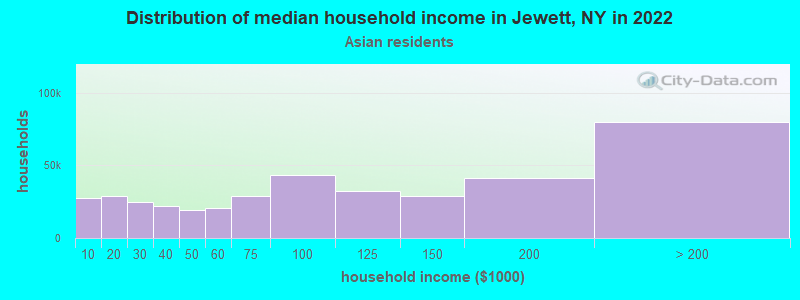
Income and house value in Jewett
- Median household income in 2022
- $73,605White non-Hispanic householders
- $92,000Asian householders
- Median 2022 house value
- $317,336White Non-Hispanic householders
- $221,276Asian householders
Household income for White non-Hispanic householders
Household income for Asian householders
Foreign-born residents in Jewett
107 residents are foreign born (8.4% Europe, 1.2% Asia, 1.1% Oceania).
| This city: | 11.0% |
| New York: | 20.4% |
Ancestries in Jewett

- 23220.1%Irish
- 19116.5%German
- 16314.1%Italian
- 14512.5%English
- 827.1%Other
- 534.6%Polish
- 494.2%Dutch
- 484.2%United States
- 262.2%Russian
- 221.9%French
- 211.8%Swedish
- 191.6%Norwegian
- 181.6%Scotch-Irish
- 151.3%Scottish
- 151.3%Ukrainian
- 90.8%French Canadian
- 80.7%Greek
- 80.7%Portuguese
- 60.5%Danish
- 60.5%Lithuanian
- 50.4%Czech
- 50.4%Slovak
- 50.4%Welsh
- 30.3%Swiss
- 20.2%Hungarian

Zip codes: 12442.