Races in John Sam Lake, Washington (WA) Detailed Stats
Ancestries, Foreign-born residents, place of birth

Discuss John Sam Lake, Washington races on our local forum with over 2,400,000 registered users
5.2% of John Sam Lake, WA residents are foreign-born (1.9% born in Asia, 1.7% born in Europe, 1.6% born in North America), which is 189.6% less than the foreign-born rate of 15.0% across the entire state of Washington.
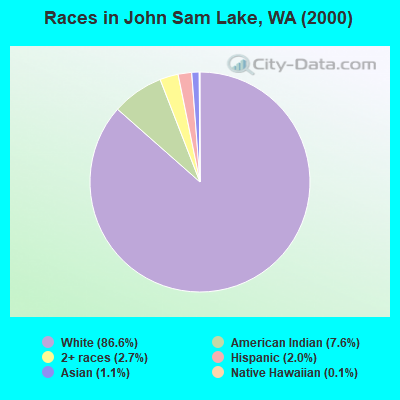
Race distribution in John Sam Lake

- 65286.6%White alone
- 577.6%American Indian alone
- 202.7%Two or more races
- 152.0%Hispanic
- 81.1%Asian alone
- 10.1%Native Hawaiian and Other
Pacific Islander alone
2000
2022
-
- 4,652,49078.9%White alone
- 441,5097.5%Hispanic
- 319,4015.4%Asian alone
- 184,6313.1%Black alone
- 175,9263.0%Two or more races
- 85,3961.4%American Indian alone
- 22,7790.4%Native Hawaiian and Other
Pacific Islander alone - 11,9890.2%Other race alone

-
- 4,941,45663.5%White alone
- 1,093,31314.0%Hispanic
- 755,8329.7%Asian alone
- 523,4486.7%Two or more races
- 299,5373.8%Black alone
- 69,0240.9%American Indian alone
- 52,2310.7%Native Hawaiian and Other
Pacific Islander alone - 50,9450.7%Other race alone

Income and house value in John Sam Lake
- Median household income in 2022
- $96,204White non-Hispanic householders
- over $200,000American Indian and Alaska Native householders
- $143,936Asian householders
- $139,897Two or more races householders
- $128,687Hispanic or Latino race householders
- Median 2022 house value
- $733,620White Non-Hispanic householders
- $726,813American Indian or Alaska Native householders
- $519,962Asian householders
- $850,848Two or more races householders
- $709,040Hispanic or Latino householders
Household income for White non-Hispanic householders

Household income for American Indian and Alaska Native householders

Household income for Asian householders

Household income for Two or more races householders

Household income for Hispanic or Latino race householders

Foreign-born residents in John Sam Lake
39 residents are foreign born (1.9% Asia, 1.7% Europe, 1.6% North America).
| This city: | 5.2% |
| Washington: | 10.4% |
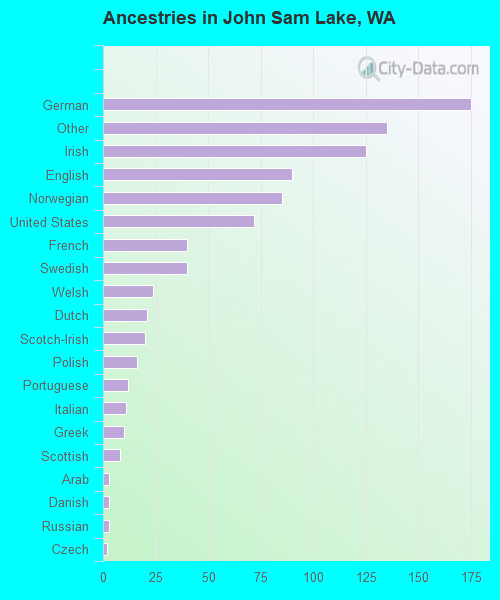
Ancestries in John Sam Lake

- 17519.6%German
- 13515.1%Other
- 12514.0%Irish
- 9010.1%English
- 859.5%Norwegian
- 728.0%United States
- 404.5%French
- 404.5%Swedish
- 242.7%Welsh
- 212.3%Dutch
- 202.2%Scotch-Irish
- 161.8%Polish
- 121.3%Portuguese
- 111.2%Italian
- 101.1%Greek
- 80.9%Scottish
- 30.3%Arab
- 30.3%Danish
- 30.3%Russian
- 20.2%Czech
Zip codes: 98271.