Races in Johnson City, Tennessee (TN) Detailed Stats
Data:
Races - White alone (%)
Races - White alone (% change since 2000)
Races - Black alone (%)
Races - Black alone (% change since 2000)
Races - American Indian alone (%)
Races - American Indian alone (% change since 2000)
Races - Asian alone (%)
Races - Asian alone (% change since 2000)
Races - Hispanic (%)
Races - Hispanic (% change since 2000)
Races - Native Hawaiian and Other Pacific Islander alone (%)
Races - Native Hawaiian and Other Pacific Islander alone (% change since 2000)
Races - Two or more races(%)
Races - Two or more races(% change since 2000)
Races - Other race alone (%)
Races - Other race alone (% change since 2000)
Racial diversity
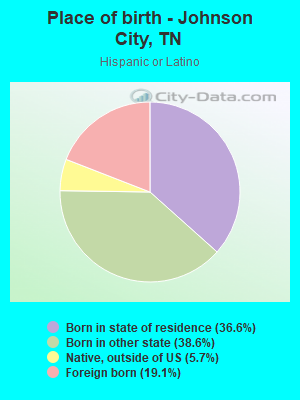
Place of birth - Born in state of residence (%)
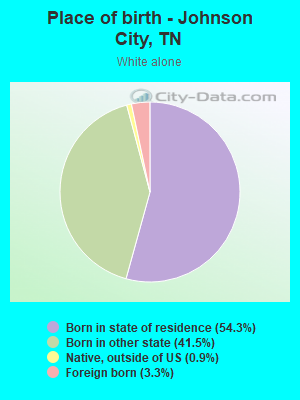
Place of birth - Born in state of residence (%) - White
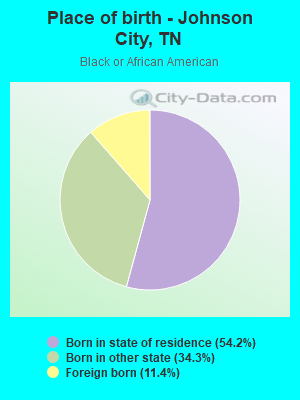
Place of birth - Born in state of residence (%) - Black or African American
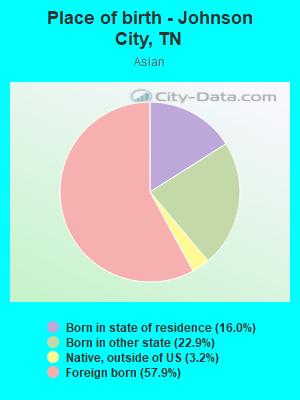
Place of birth - Born in state of residence (%) - Asian
Place of birth - Born in state of residence (%) - Hispanic or Latino
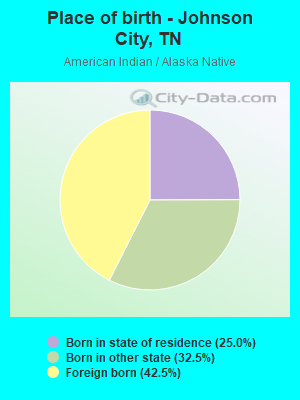
Place of birth - Born in state of residence (%) - American Indian and Alaska Native
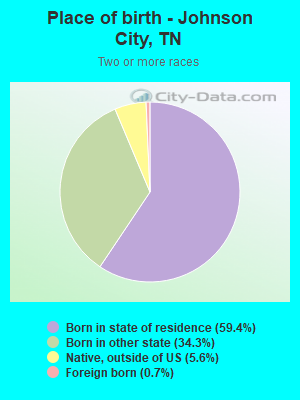
Place of birth - Born in state of residence (%) - Multirace
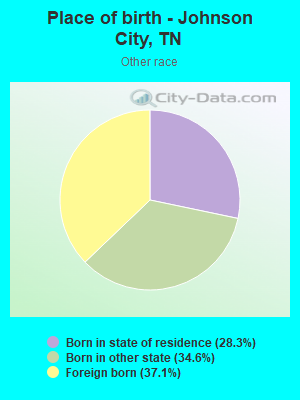
Place of birth - Born in state of residence (%) - Other Race
Place of birth - Born in other state (%)
Place of birth - Born in other state (%) - White
Place of birth - Born in other state (%) - Black or African American
Place of birth - Born in other state (%) - Asian
Place of birth - Born in other state (%) - Hispanic or Latino
Place of birth - Born in other state (%) - American Indian and Alaska Native
Place of birth - Born in other state (%) - Multirace
Place of birth - Born in other state (%) - Other Race
Place of birth - Native, outside of US (%)
Place of birth - Native, outside of US (%) - White
Place of birth - Native, outside of US (%) - Black or African American
Place of birth - Native, outside of US (%) - Asian
Place of birth - Native, outside of US (%) - Hispanic or Latino
Place of birth - Native, outside of US (%) - American Indian and Alaska Native
Place of birth - Native, outside of US (%) - Multirace
Place of birth - Native, outside of US (%) - Other Race
Place of birth - Foreign born (%)
Place of birth - Foreign born (%) - White
Place of birth - Foreign born (%) - Black or African American
Place of birth - Foreign born (%) - Asian
Place of birth - Foreign born (%) - Hispanic or Latino
Place of birth - Foreign born (%) - American Indian and Alaska Native
Place of birth - Foreign born (%) - Multirace
Place of birth - Foreign born (%) - Other Race
Residents speaking English at home (%)
Residents speaking English at home - Born in the United States (%)
Residents speaking English at home - Native, born elsewhere (%)
Residents speaking English at home - Foreign born (%)
Residents speaking Spanish at home (%)
Residents speaking Spanish at home - Born in the United States (%)
Residents speaking Spanish at home - Native, born elsewhere (%)
Residents speaking Spanish at home - Foreign born (%)
Residents speaking other language at home (%)
Residents speaking other language at home - Born in the United States (%)
Residents speaking other language at home - Native, born elsewhere (%)
Residents speaking other language at home - Foreign born (%)
Marital status - Never married (%)
Marital status - Now married (%)
Marital status - Separated (%)
Marital status - Widowed (%)
Marital status - Divorced (%)
Ancestries Reported - Arab (%)
Ancestries Reported - Czech (%)
Ancestries Reported - Danish (%)
Ancestries Reported - Dutch (%)
Ancestries Reported - English (%)
Ancestries Reported - French (%)
Ancestries Reported - French Canadian (%)
Ancestries Reported - German (%)
Ancestries Reported - Greek (%)
Ancestries Reported - Hungarian (%)
Ancestries Reported - Irish (%)
Ancestries Reported - Italian (%)
Ancestries Reported - Lithuanian (%)
Ancestries Reported - Norwegian (%)
Ancestries Reported - Polish (%)
Ancestries Reported - Portuguese (%)
Ancestries Reported - Russian (%)
Ancestries Reported - Scotch-Irish (%)
Ancestries Reported - Scottish (%)
Ancestries Reported - Slovak (%)
Ancestries Reported - Subsaharan African (%)
Ancestries Reported - Swedish (%)
Ancestries Reported - Swiss (%)
Ancestries Reported - Ukrainian (%)
Ancestries Reported - United States (%)
Ancestries Reported - Welsh (%)
Ancestries Reported - West Indian (%)
Ancestries Reported - Other (%)
Geographical mobility - Same house 1 year ago (%)
Geographical mobility - Same house 1 year ago (%) - White
Geographical mobility - Same house 1 year ago (%) - Black or African American
Geographical mobility - Same house 1 year ago (%) - Asian
Geographical mobility - Same house 1 year ago (%) - Hispanic or Latino
Geographical mobility - Same house 1 year ago (%) - American Indian and Alaska Native
Geographical mobility - Same house 1 year ago (%) - Multirace
Geographical mobility - Same house 1 year ago (%) - Other Race
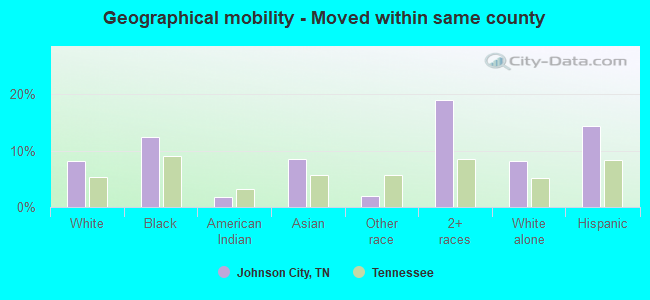
Geographical mobility - Moved within same county (%)
Geographical mobility - Moved within same county (%) - White
Geographical mobility - Moved within same county (%) - Black or African American
Geographical mobility - Moved within same county (%) - Asian
Geographical mobility - Moved within same county (%) - Hispanic or Latino
Geographical mobility - Moved within same county (%) - American Indian and Alaska Native
Geographical mobility - Moved within same county (%) - Multirace
Geographical mobility - Moved within same county (%) - Other Race
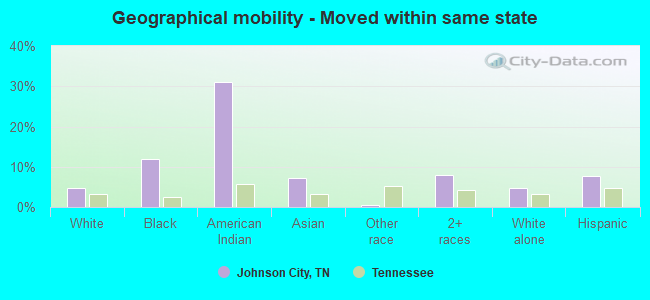
Geographical mobility - Moved from different county within same state (%)
Geographical mobility - Moved from different county within same state (%) - White
Geographical mobility - Moved from different county within same state (%) - Black or African American
Geographical mobility - Moved from different county within same state (%) - Asian
Geographical mobility - Moved from different county within same state (%) - Hispanic or Latino
Geographical mobility - Moved from different county within same state (%) - American Indian and Alaska Native
Geographical mobility - Moved from different county within same state (%) - Multirace
Geographical mobility - Moved from different county within same state (%) - Other Race
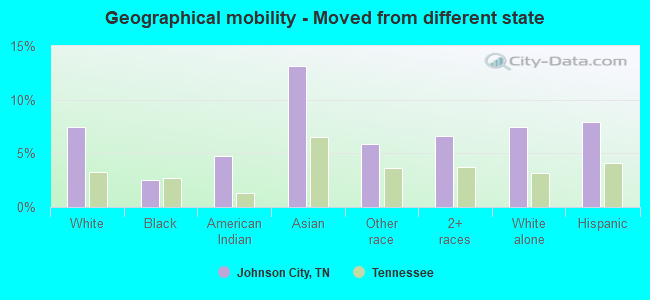
Geographical mobility - Moved from different state (%)
Geographical mobility - Moved from different state (%) - White
Geographical mobility - Moved from different state (%) - Black or African American
Geographical mobility - Moved from different state (%) - Asian
Geographical mobility - Moved from different state (%) - Hispanic or Latino
Geographical mobility - Moved from different state (%) - American Indian and Alaska Native
Geographical mobility - Moved from different state (%) - Multirace
Geographical mobility - Moved from different state (%) - Other Race
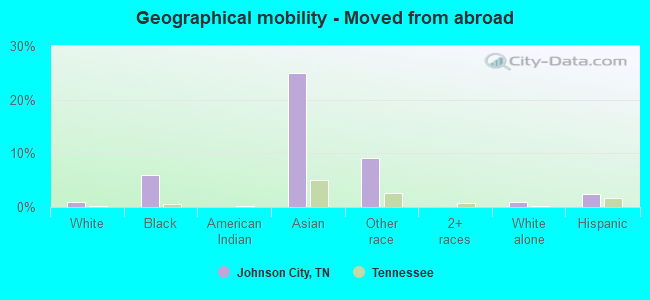
Geographical mobility - Moved from abroad (%)
Geographical mobility - Moved from abroad (%) - White
Geographical mobility - Moved from abroad (%) - Black or African American
Geographical mobility - Moved from abroad (%) - Asian
Geographical mobility - Moved from abroad (%) - Hispanic or Latino
Geographical mobility - Moved from abroad (%) - American Indian and Alaska Native
Geographical mobility - Moved from abroad (%) - Multirace
Geographical mobility - Moved from abroad (%) - Other Race
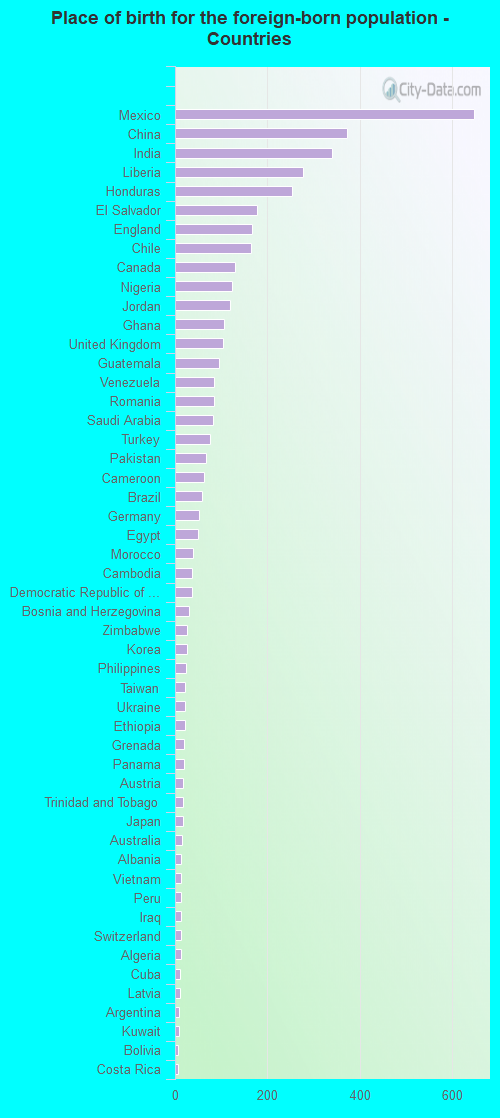
Place of birth for the foreign-born population - Ireland (%)
Place of birth for the foreign-born population - Denmark (%)
Place of birth for the foreign-born population - Norway (%)
Place of birth for the foreign-born population - Sweden (%)
Place of birth for the foreign-born population - United Kingdom (%)
Place of birth for the foreign-born population - England (%)
Place of birth for the foreign-born population - Scotland (%)
Place of birth for the foreign-born population - Other Northern Europe (%)
Place of birth for the foreign-born population - Austria (%)
Place of birth for the foreign-born population - Belgium (%)
Place of birth for the foreign-born population - France (%)
Place of birth for the foreign-born population - Germany (%)
Place of birth for the foreign-born population - Netherlands (%)
Place of birth for the foreign-born population - Switzerland (%)
Place of birth for the foreign-born population - Other Western Europe (%)
Place of birth for the foreign-born population - Greece (%)
Place of birth for the foreign-born population - Italy (%)
Place of birth for the foreign-born population - Portugal (%)
Place of birth for the foreign-born population - Spain (%)
Place of birth for the foreign-born population - Other Southern Europe (%)
Place of birth for the foreign-born population - Albania (%)
Place of birth for the foreign-born population - Belarus (%)
Place of birth for the foreign-born population - Bosnia and Herzegovina (%)
Place of birth for the foreign-born population - Bulgaria (%)
Place of birth for the foreign-born population - Croatia (%)
Place of birth for the foreign-born population - Czechoslovakia (%)
Place of birth for the foreign-born population - Hungary (%)
Place of birth for the foreign-born population - Latvia (%)
Place of birth for the foreign-born population - Lithuania (%)
Place of birth for the foreign-born population - North Macedonia (Macedonia) (%)
Place of birth for the foreign-born population - Moldova (%)
Place of birth for the foreign-born population - Poland (%)
Place of birth for the foreign-born population - Romania (%)
Place of birth for the foreign-born population - Russia (%)
Place of birth for the foreign-born population - Serbia (%)
Place of birth for the foreign-born population - Ukraine (%)
Place of birth for the foreign-born population - Other Eastern Europe (%)
Place of birth for the foreign-born population - China (%)
Place of birth for the foreign-born population - Hong Kong (%)
Place of birth for the foreign-born population - Taiwan (%)
Place of birth for the foreign-born population - Japan (%)
Place of birth for the foreign-born population - Korea (%)
Place of birth for the foreign-born population - Other Eastern Asia (%)
Place of birth for the foreign-born population - Afghanistan (%)
Place of birth for the foreign-born population - Bangladesh (%)
Place of birth for the foreign-born population - India (%)
Place of birth for the foreign-born population - Iran (%)
Place of birth for the foreign-born population - Kazakhstan (%)
Place of birth for the foreign-born population - Nepal (%)
Place of birth for the foreign-born population - Pakistan (%)
Place of birth for the foreign-born population - Sri Lanka (%)
Place of birth for the foreign-born population - Uzbekistan (%)
Place of birth for the foreign-born population - Other South Central Asia (%)
Place of birth for the foreign-born population - Burma (%)
Place of birth for the foreign-born population - Cambodia (%)
Place of birth for the foreign-born population - Indonesia (%)
Place of birth for the foreign-born population - Laos (%)
Place of birth for the foreign-born population - Malaysia (%)
Place of birth for the foreign-born population - Philippines (%)
Place of birth for the foreign-born population - Singapore (%)
Place of birth for the foreign-born population - Thailand (%)
Place of birth for the foreign-born population - Vietnam (%)
Place of birth for the foreign-born population - Other South Eastern Asia (%)
Place of birth for the foreign-born population - Armenia (%)
Place of birth for the foreign-born population - Iraq (%)
Place of birth for the foreign-born population - Israel (%)
Place of birth for the foreign-born population - Jordan (%)
Place of birth for the foreign-born population - Kuwait (%)
Place of birth for the foreign-born population - Lebanon (%)
Place of birth for the foreign-born population - Saudi Arabia (%)
Place of birth for the foreign-born population - Syria (%)
Place of birth for the foreign-born population - Turkey (%)
Place of birth for the foreign-born population - Yemen (%)
Place of birth for the foreign-born population - Other Western Asia (%)
Place of birth for the foreign-born population - Eritrea (%)
Place of birth for the foreign-born population - Ethiopia (%)
Place of birth for the foreign-born population - Kenya (%)
Place of birth for the foreign-born population - Somalia (%)
Place of birth for the foreign-born population - Uganda (%)
Place of birth for the foreign-born population - Zimbabwe (%)
Place of birth for the foreign-born population - Other Eastern Africa (%)
Place of birth for the foreign-born population - Cameroon (%)
Place of birth for the foreign-born population - Congo (%)
Place of birth for the foreign-born population - Democratic Republic of Congo (Zaire) (%)
Place of birth for the foreign-born population - Other Middle Africa (%)
Place of birth for the foreign-born population - Egypt (%)
Place of birth for the foreign-born population - Morocco (%)
Place of birth for the foreign-born population - Sudan (%)
Place of birth for the foreign-born population - Other Northern Africa (%)
Place of birth for the foreign-born population - South Africa (%)
Place of birth for the foreign-born population - Other Southern Africa (%)
Place of birth for the foreign-born population - Cabo Verde (%)
Place of birth for the foreign-born population - Ghana (%)
Place of birth for the foreign-born population - Liberia (%)
Place of birth for the foreign-born population - Nigeria (%)
Place of birth for the foreign-born population - Senegal (%)
Place of birth for the foreign-born population - Sierra Leone (%)
Place of birth for the foreign-born population - Other Western Africa (%)
Place of birth for the foreign-born population - Australia (%)
Place of birth for the foreign-born population - New Zealand (%)
Place of birth for the foreign-born population - Fiji (%)
Place of birth for the foreign-born population - Micronesia (%)
Place of birth for the foreign-born population - Bahamas (%)
Place of birth for the foreign-born population - Barbados (%)
Place of birth for the foreign-born population - Cuba (%)
Place of birth for the foreign-born population - Dominica (%)
Place of birth for the foreign-born population - Dominican Republic (%)
Place of birth for the foreign-born population - Grenada (%)
Place of birth for the foreign-born population - Haiti (%)
Place of birth for the foreign-born population - Jamaica (%)
Place of birth for the foreign-born population - St. Vincent and the Grenadines (%)
Place of birth for the foreign-born population - Trinidad and Tobago (%)
Place of birth for the foreign-born population - West Indies (%)
Place of birth for the foreign-born population - Other Caribbean (%)
Place of birth for the foreign-born population - Belize (%)
Place of birth for the foreign-born population - Costa Rica (%)
Place of birth for the foreign-born population - El Salvador (%)
Place of birth for the foreign-born population - Guatemala (%)
Place of birth for the foreign-born population - Honduras (%)
Place of birth for the foreign-born population - Mexico (%)
Place of birth for the foreign-born population - Nicaragua (%)
Place of birth for the foreign-born population - Panama (%)
Place of birth for the foreign-born population - Other Central America (%)
Place of birth for the foreign-born population - Argentina (%)
Place of birth for the foreign-born population - Bolivia (%)
Place of birth for the foreign-born population - Brazil (%)
Place of birth for the foreign-born population - Chile (%)
Place of birth for the foreign-born population - Colombia (%)
Place of birth for the foreign-born population - Ecuador (%)
Place of birth for the foreign-born population - Guyana (%)
Place of birth for the foreign-born population - Peru (%)
Place of birth for the foreign-born population - Uruguay (%)
Place of birth for the foreign-born population - Venezuela (%)
Place of birth for the foreign-born population - Other South America (%)
Place of birth for the foreign-born population - Canada (%)
Place of birth for the foreign-born population - Other Northern America (%)
Place of birth for the foreign-born population - Other (%)
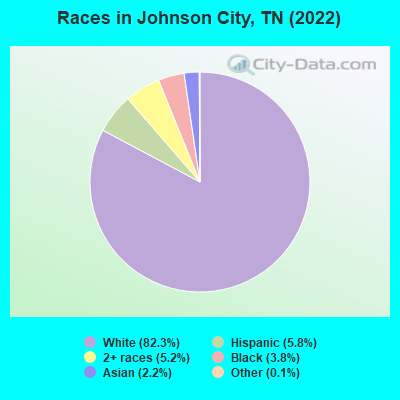
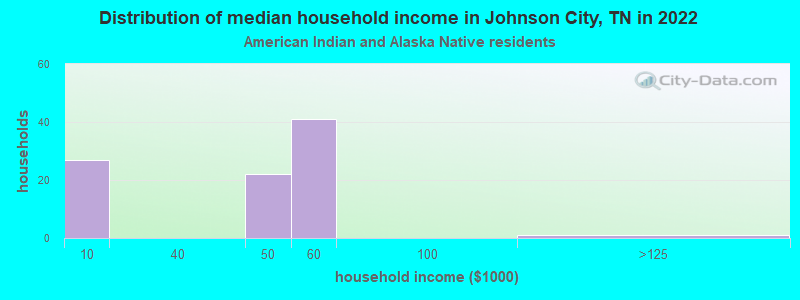
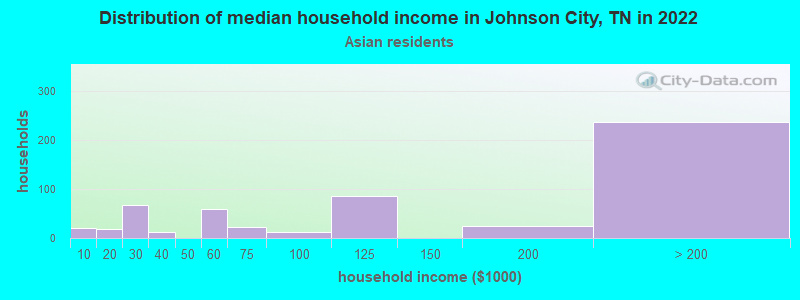
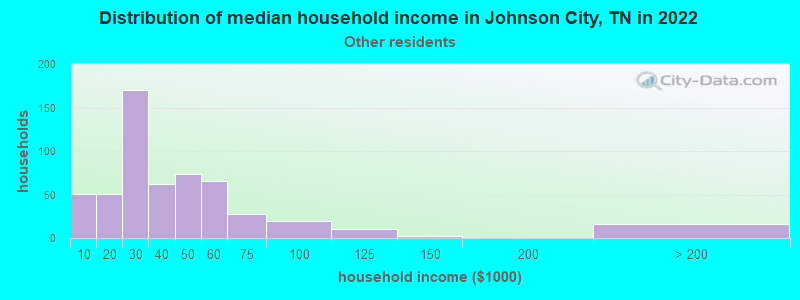
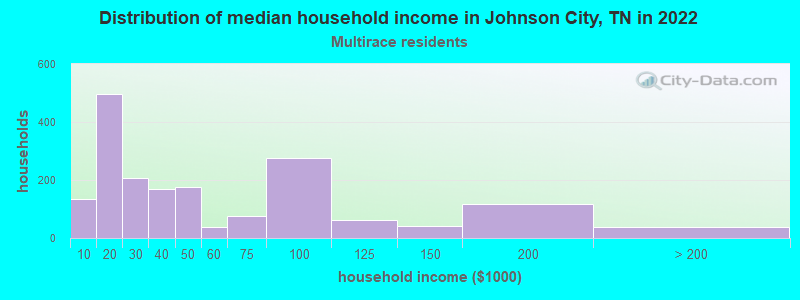
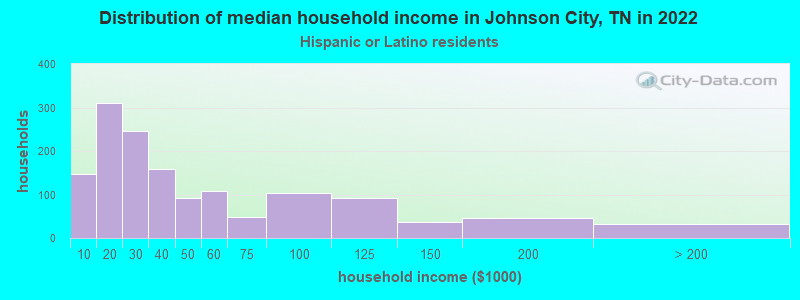
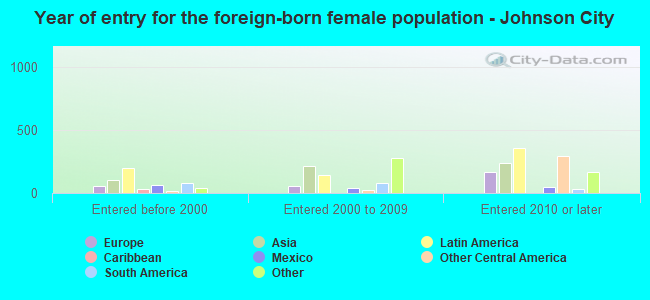
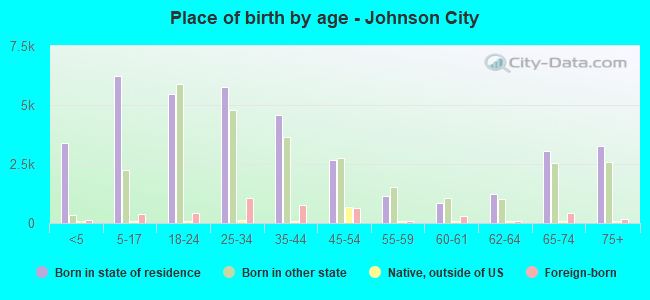
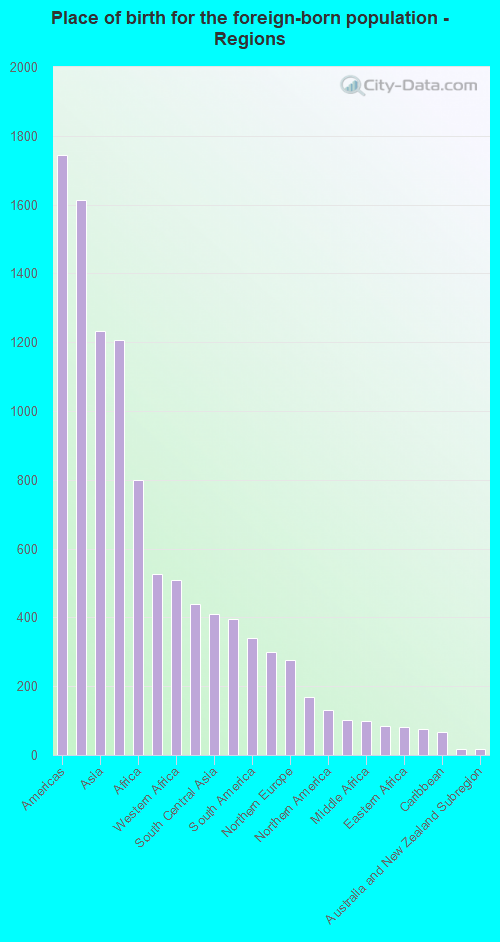
According to 2022 data, the most numerous races in Johnson City, TN are White alone (59,491 residents), Black alone (2,778 residents), and Hispanic (4,158 residents). 92.6% of Johnson City residents speak English at home. 6.0% of Johnson City, TN residents are foreign-born (2.2% born in Latin America, 1.7% born in Asia, 1.1% born in Africa, 0.7% born in Europe), which is 16.4% greater than the foreign-born rate of 5.0% across the entire state of Tennessee.
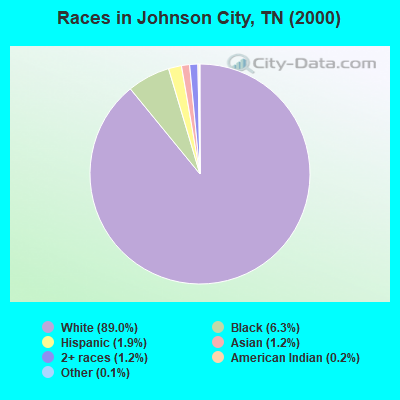
Race distribution in Johnson City
2000 2022
4,505,930 79.2% White alone 928,204 16.3% Black alone 123,838 2.2% Hispanic 54,824 1.0% Two or more races 56,077 1.0% Asian alone 13,820 0.2% American Indian alone 4,780 0.08% Other race alone 1,810 0.03% Native Hawaiian and Other
5,070,026 71.9% White alone 1,089,738 15.5% Black alone 442,629 6.3% Hispanic 279,381 4.0% Two or more races 131,817 1.9% Asian alone 26,972 0.4% Other race alone 6,387 0.09% American Indian alone 4,389 0.06% Native Hawaiian and Other
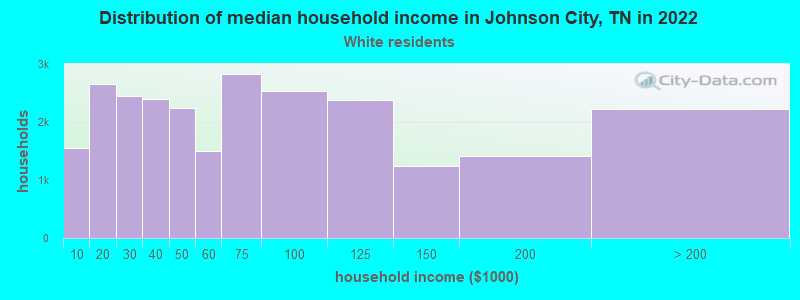
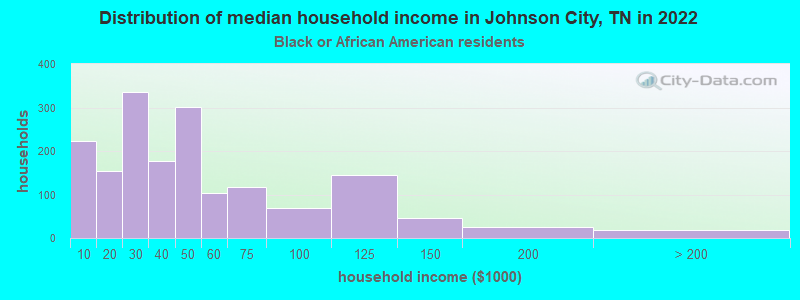
Income and house value in Johnson City Median household income in 2022 $60,665 White non-Hispanic householders$43,983 Black householders$107,087 Asian householders$65,252 Two or more races householders$57,624 Hispanic or Latino race householdersMedian 2022 house value $267,810 White Non-Hispanic householders$186,199 Black or African American householders$284,450 American Indian or Alaska Native householders $468,008 Asian householders$128,887 Some other race householders$201,782 Two or more races householders$250,907 Hispanic or Latino householders
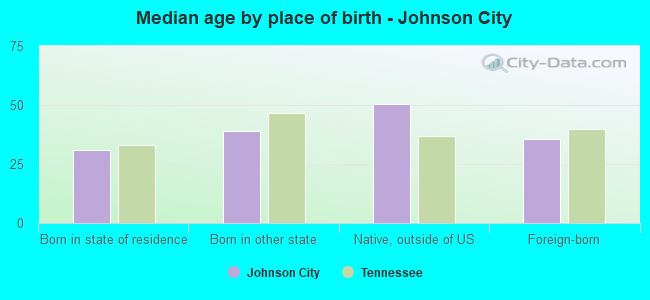
Median age by race in Johnson City
36.1 Median age for White residents34.6 38.9 33.5 Median age for Black or African American residents24.5 36.3 -666,666,666.0 Median age for American Indian / Alaska Native residents-666,666,666.0 -666,666,666.0 46.1 Median age for Asian residents46.9 36.7 -666,666,666.0 Median age for Native Hawaiian / Pacific Islander residents-666,666,666.0 -666,666,666.0 27.8 Median age for Other race residents28.4 24.9 23.4 Median age for Two or more races residents30.6 23.1 36.6 Median age for White alone residents34.8 39.0 23.8 Median age for Hispanic or Latino residents28.5 21.4
Owner/renter occupied households by race in Johnson City
House owners and renters - White residents 14,199 55.9% Owner occupied11,223 44.1% Renter occupiedHouse owners and renters - Black or African American residents 277 21.0% Owner occupied1,044 79.0% Renter occupiedHouse owners and renters - American Indian / Alaska Native residents 32 55.3% Owner occupied26 44.7% Renter occupiedHouse owners and renters - Asian residents 310 54.7% Owner occupied257 45.3% Renter occupiedHouse owners and renters - Other race residents 182 32.8% Owner occupied372 67.2% Renter occupiedHouse owners and renters - Two or more races residents 735 34.6% Owner occupied1,391 65.4% Renter occupiedHouse owners and renters - White alone residents 14,095 56.1% Owner occupied11,014 43.9% Renter occupiedHouse owners and renters - Hispanic or Latino residents 476 38.8% Owner occupied752 61.2% Renter occupied
Language usage in Johnson City
English speakers - Total 92.6% of residents of Johnson City speak English at home.
3.6% of residents speak Spanish at home 1,000 40.4% Speak English very well1,476 59.6% Speak English less than very well3.9% of residents speak other language at home 2,054 77.8% Speak English very well585 22.2% Speak English less than very well
English speakers - Born in the United States 96.8% of residents of Johnson City speak English at home.
2.0% of residents speak Spanish at home 404 69.5% Speak English very well177 30.5% Speak English less than very well1.3% of residents speak other language at home 347 96.4% Speak English very well13 3.6% Speak English less than very well
English speakers - Native, born elsewhere 79.2% of residents of Johnson City speak English at home.
19.3% of residents speak Spanish at home 62 63.3% Speak English very well36 36.7% Speak English less than very well1.0% of residents speak other language at home 5 100.0% Speak English very well
English speakers - Foreign-born 21.8% of residents of Johnson City speak English at home.
30.3% of residents speak Spanish at home 356 27.4% Speak English very well945 72.6% Speak English less than very well48.2% of residents speak other language at home 1,527 73.7% Speak English very well546 26.3% Speak English less than very well
White (Caucasian) - Speak only English Native:
99.2% (54,349)Foreign-born:
42.9% (886)
White (Caucasian) - Speak another language Native:
0.8% (432)Foreign-born:
57.1% (1,179)
Black or African American - Speak only English Native:
97.4% (3,053)Foreign-born:
24.9% (184)
Black or African American - Speak another language Native:
2.6% (82)Foreign-born:
74.3% (550)
American Indian / Alaska Native - Speak another language Native:
89.9% (82)Foreign-born:
100.0% (77)
Asian - Speak only English Native:
82.2% (552)Foreign-born:
13.0% (122)
Asian - Speak another language Native:
16.3% (109)Foreign-born:
87.0% (813)
Other race - Speak only English Native:
30.8% (232)Foreign-born:
11.6% (94)
Other race - Speak another language Native:
67.9% (511)Foreign-born:
85.8% (695)
Two or more races - Speak only English Native:
97.1% (3,926)Foreign-born:
20.0% (37)
Two or more races - Speak another language Native:
1.3% (55)Foreign-born:
80.2% (150)
White alone - Speak only English Native:
99.2% (53,742)Foreign-born:
43.0% (838)
White alone - Speak another language Native:
0.8% (432)Foreign-born:
57.0% (1,113)
Hispanic or Latino - Speak only English Native:
65.6% (1,361)Foreign-born:
15.9% (252)
Hispanic or Latino - Speak another language Native:
35.5% (736)Foreign-born:
83.2% (1,313)
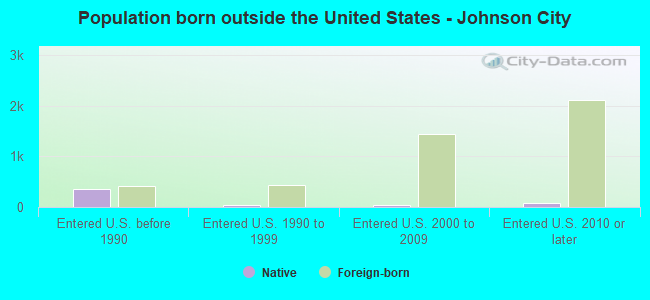
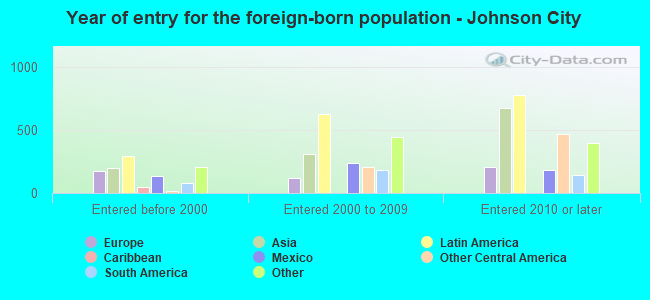
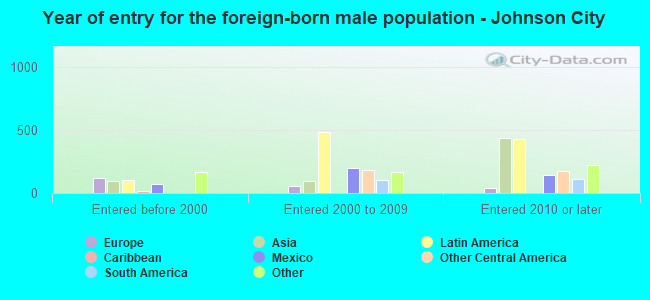
Foreign-born residents in Johnson City 4,322 residents are foreign born (2.2% Latin America , 1.7% Asia , 1.1% Africa , 0.7% Europe ).
This city:
6.0%Tennessee:
5.4%
Marital status for residents in Johnson City Marital status - White (Caucasian) population 15 years and over
Males 36.5% Never married48.1% Now married0.8% Separated3.5% Widowed11.1% DivorcedFemales 34.9% Never married38.2% Now married1.6% Separated10.4% Widowed14.9% DivorcedWomen who gave birth in the past 12 months Now married:
100.0% (458)Unmarried:
0.0% (0)
Women who did not give birth in the past 12 months Now married:
41.5% (7,312)Unmarried:
58.5% (10,312)
Marital status - Black or African American population 15 years and over
Males 54.3% Never married31.3% Now married0.4% Separated2.5% Widowed11.5% DivorcedFemales 55.0% Never married20.6% Now married6.5% Separated6.7% Widowed11.3% DivorcedWomen who gave birth in the past 12 months Now married:
100.0% (81)Unmarried:
0.0% (0)
Women who did not give birth in the past 12 months Now married:
12.3% (110)Unmarried:
87.7% (782)
Marital status - American Indian / Alaska Native population 15 years and over
Males 26.7% Never married58.7% Now married0.0% Separated0.0% Widowed14.7% DivorcedFemales 96.3% Never married0.0% Now married0.0% Separated3.7% Widowed0.0% DivorcedWomen who did not give birth in the past 12 months Now married:
0.0% (0)Unmarried:
100.0% (31)
Marital status - Asian population 15 years and over
Males 37.8% Never married62.2% Now married0.0% Separated0.0% Widowed0.0% DivorcedFemales 38.6% Never married44.9% Now married3.8% Separated7.8% Widowed4.9% DivorcedWomen who did not give birth in the past 12 months Now married:
39.6% (227)Unmarried:
60.4% (346)
Marital status - Other race population 15 years and over
Males 29.4% Never married59.6% Now married0.0% Separated0.0% Widowed11.0% DivorcedFemales 50.3% Never married42.7% Now married0.0% Separated2.7% Widowed4.2% DivorcedWomen who did not give birth in the past 12 months Now married:
43.7% (232)Unmarried:
56.3% (299)
Marital status - Two or more races population 15 years and over
Males 63.9% Never married31.6% Now married0.0% Separated1.5% Widowed3.1% DivorcedFemales 68.9% Never married21.5% Now married0.1% Separated3.1% Widowed6.3% DivorcedWomen who gave birth in the past 12 months Now married:
71.1% (48)Unmarried:
28.9% (19)
Women who did not give birth in the past 12 months Now married:
18.4% (283)Unmarried:
81.6% (1,251)
Marital status - White alone, not Hispanic / Latino population 15 years and over
Males 36.6% Never married48.1% Now married0.8% Separated3.2% Widowed11.2% DivorcedFemales 34.8% Never married38.4% Now married1.7% Separated10.3% Widowed14.9% DivorcedWomen who gave birth in the past 12 months Now married:
100.0% (458)Unmarried:
0.0% (0)
Women who did not give birth in the past 12 months Now married:
41.9% (7,312)Unmarried:
58.1% (10,143)
Marital status - Hispanic or Latino population 15 years and over
Males 34.3% Never married53.0% Now married0.0% Separated2.0% Widowed10.7% DivorcedFemales 51.0% Never married37.2% Now married0.0% Separated3.3% Widowed8.6% DivorcedWomen who gave birth in the past 12 months Now married:
100.0% (16)Unmarried:
0.0% (0)
Women who did not give birth in the past 12 months Now married:
37.0% (406)Unmarried:
63.0% (692)
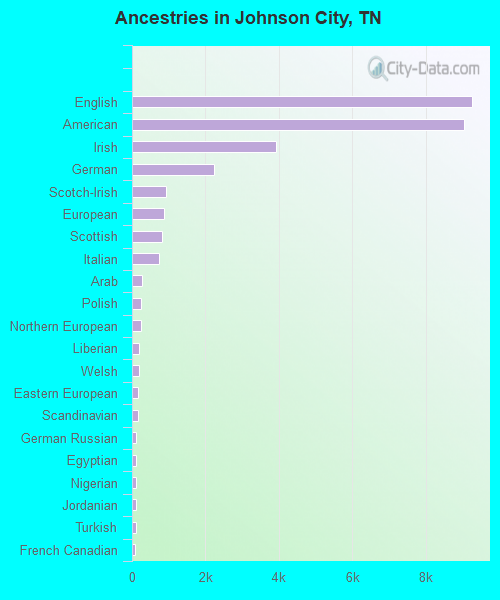
Ancestries in Johnson City
9,261 23.5% English9,047 23.0% American3,934 10.0% Irish2,236 5.7% German932 2.4% Scotch-Irish873 2.2% European807 2.1% Scottish735 1.9% Italian263 0.7% Arab258 0.7% Polish243 0.6% Northern European180 0.5% Liberian178 0.5% Welsh169 0.4% Eastern European157 0.4% Scandinavian112 0.3% German Russian110 0.3% Egyptian107 0.3% Nigerian105 0.3% Jordanian99 0.3% Turkish90 0.2% French Canadian83 0.2% Dutch82 0.2% Ghanaian82 0.2% Romanian81 0.2% Norwegian67 0.2% French62 0.2% British49 0.1% Swedish47 0.1% Canadian46 0.1% African38 0.10% Swiss37 0.09% Danish36 0.09% Austrian35 0.09% Lebanese35 0.09% Zimbabwean32 0.08% Yugoslavian25 0.06% Australian22 0.06% Hungarian22 0.06% Greek21 0.05% Albanian21 0.05% Ukrainian17 0.04% Haitian16 0.04% Brazilian14 0.04% Bulgarian12 0.03% Portuguese11 0.03% Czechoslovakian10 0.03% West Indian8 0.02% Russian8 0.02% Iranian7 0.02% Slovene
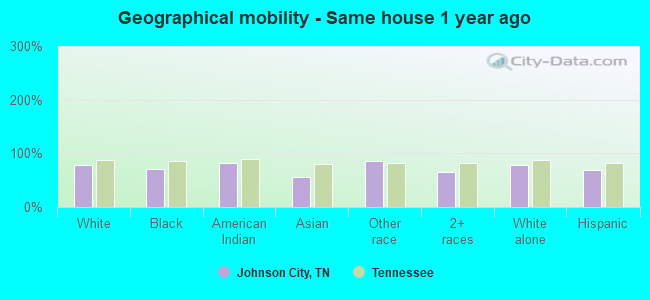
Geographical mobility in Johnson City Same house 1 year ago 47,031 78.8% White (Caucasian)1,969 71.1% Black or African American124 82.2% American Indian / Alaska Native932 56.6% Asian1,320 85.5% Other race3,328 66.2% Two or more races46,390 78.8% White alone, not Hispanic / Latino2,714 68.5% Hispanic or LatinoMoved within same county 4,834 8.1% White / Caucasian344 12.4% Black or African American3 1.8% American Indian / Alaska Native139 8.4% Asian30 2.0% Other race956 19.0% Two or more races4,794 8.1% White alone, not Hispanic / Latino568 14.3% Hispanic or LatinoMoved within same state 2,830 4.7% White / Caucasian332 12.0% Black or African American47 31.1% American Indian / Alaska Native120 7.3% Asian9 0.6% Other race401 8.0% Two or more races2,747 4.7% White alone, not Hispanic / Latino303 7.6% Hispanic or LatinoMoved from different state 4,433 7.4% White / Caucasian69 2.5% Black or African American7 4.8% American Indian / Alaska Native216 13.1% Asian90 5.8% Other race330 6.6% Two or more races4,387 7.5% White alone, not Hispanic / Latino314 7.9% Hispanic or LatinoMoved from abroad 543 0.9% White164 5.9% Black or African American411 24.9% Asian140 9.1% Other race543 0.9% White alone, not Hispanic / Latino95 2.4% Hispanic or Latino
Children Nativity (place of birth) in Johnson City
Children under 6 years - Living with two parents Both parents native 2,237 100.0% NativeBoth parents foreign-born 136 100.0% NativeOne native, one foreign-born parent 108 100.0% NativeChildren under 6 years - Living with one parent Native parent 1,583 100.0% NativeForeign-born parent 116 100.0% NativeChildren 6 to 17 years - Living with two parents Both parents native 3,940 100.0% Native1 0.0% Foreign-bornBoth parents foreign-born 427 72.2% Native164 27.8% Foreign-bornOne native, one foreign-born parent 235 85.2% Native41 14.8% Foreign-bornChildren 6 to 17 years - Living with one parent Native parent 2,616 100.0% NativeForeign-born parent 407 63.4% Native235 36.6% Foreign-born
Grandparents responsible for own grandchildren in Johnson City
Grandparents (30 to 59 years) White / Caucasian 326 90.6% Responsible for grandchildren34 9.4% Not responsible for grandchildrenBlack or African American 61 74.7% Responsible for grandchildren21 25.3% Not responsible for grandchildrenAmerican Indian / Alaska Native 17 100.0% Responsible for grandchildrenTwo or more races 21 100.0% Responsible for grandchildrenWhite alone, not Hispanic / Latino 326 90.4% Responsible for grandchildren35 9.6% Not responsible for grandchildrenGrandparents (60 years and over) White / Caucasian 288 52.8% Responsible for grandchildren258 47.2% Not responsible for grandchildrenBlack or African American 70 100.0% Responsible for grandchildrenTwo or more races 6 10.0% Responsible for grandchildren57 90.0% Not responsible for grandchildrenWhite alone, not Hispanic / Latino 288 52.8% Responsible for grandchildren258 47.2% Not responsible for grandchildren