Races in Johnstown, Pennsylvania (PA) Detailed Stats
Ancestries, Foreign-born residents, place of birth
Settings
X


Recent posts about races in Johnstown, Pennsylvania on our local forum with over 2,400,000 registered users:
 | Future of Johnstown/Cambria County (42 replies) |
| Lancaster/Eastern PA or Johnstown area? (23 replies) |
| What are the chances of Trump winning Pennsylvania again in 2020 Election? (267 replies) |
| The Rest of PA's opinions on Philly? (87 replies) |
| Relocating family to Johnstown area, looking for recommendations (7 replies) |
| What PA County is the best microcosm of the state as a whole? (26 replies) |
Latest news about races in Johnstown, PA collected exclusively by city-data.com from local newspapers, TV, and radio stations
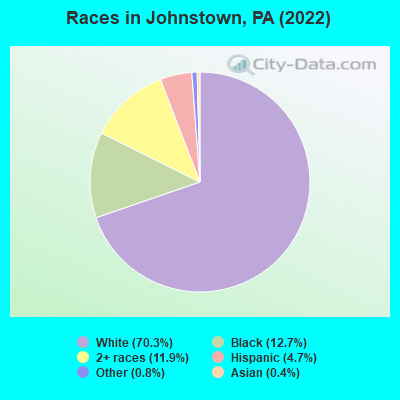
According to 2022 data, the most numerous races in Johnstown, PA are White alone (12,784 residents), Black alone (2,307 residents), and Hispanic (851 residents). 96.2% of Johnstown residents speak English at home. 1.3% of Johnstown, PA residents are foreign-born , which is 453.2% less than the foreign-born rate of 7.0% across the entire state of Pennsylvania.
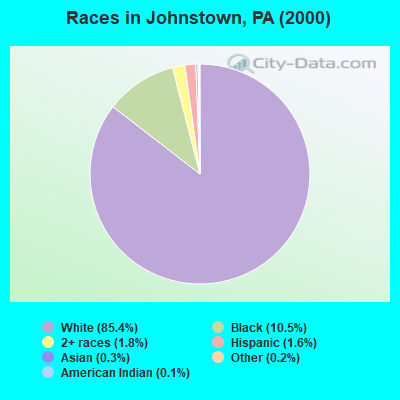
Race distribution in Johnstown
2000
2022

- 20,41785.4%White alone
- 2,52010.5%Black alone
- 4261.8%Two or more races
- 3801.6%Hispanic
- 670.3%Asian alone
- 560.2%Other race alone
- 280.1%American Indian alone
- 120.05%Native Hawaiian and Other
Pacific Islander alone
-
- 12,78470.3%White alone
- 2,30712.7%Black alone
- 2,17111.9%Two or more races
- 8514.7%Hispanic
- 1480.8%Other race alone
- 810.4%Asian alone
- 80.04%American Indian alone
2000
2022
-
- 10,322,45584.1%White alone
- 1,202,4379.8%Black alone
- 394,0883.2%Hispanic
- 218,2961.8%Asian alone
- 113,0970.9%Two or more races
- 13,0860.1%Other race alone
- 14,9040.1%American Indian alone
- 2,6910.02%Native Hawaiian and Other
Pacific Islander alone

-
- 9,487,22873.1%White alone
- 1,311,58110.1%Black alone
- 1,115,9978.6%Hispanic
- 493,9423.8%Two or more races
- 487,1243.8%Asian alone
- 63,5820.5%Other race alone
- 10,1300.08%American Indian alone
- 2,4240.02%Native Hawaiian and Other
Pacific Islander alone

Income and house value in Johnstown
- Median household income in 2022
- $35,403White non-Hispanic householders
- $19,206Black householders
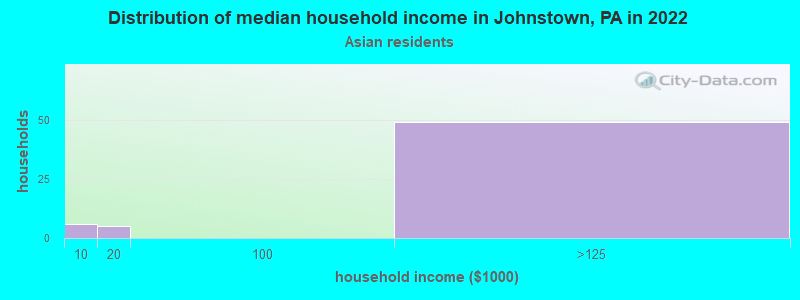
- $141,298Asian householders
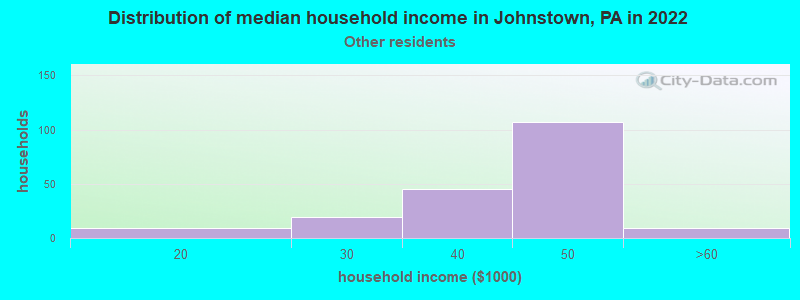
- $49,094Some other race householders
- $22,465Hispanic or Latino race householders
- Median 2022 house value
- $41,036White Non-Hispanic householders
- $37,757Black or African American householders
- $155,440American Indian or Alaska Native householders
- $96,090Asian householders
- $155,440Some other race householders
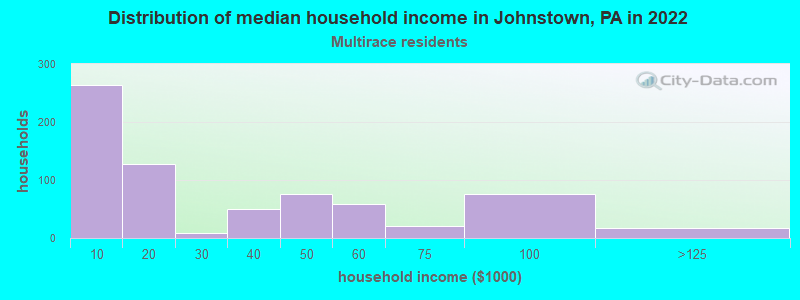
- $116,552Two or more races householders
- $54,375Hispanic or Latino householders
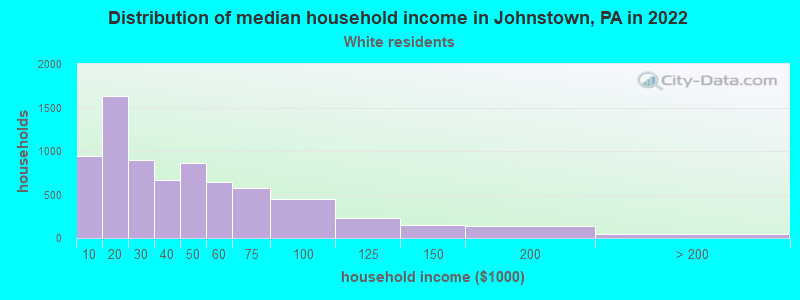
Household income for White non-Hispanic householders
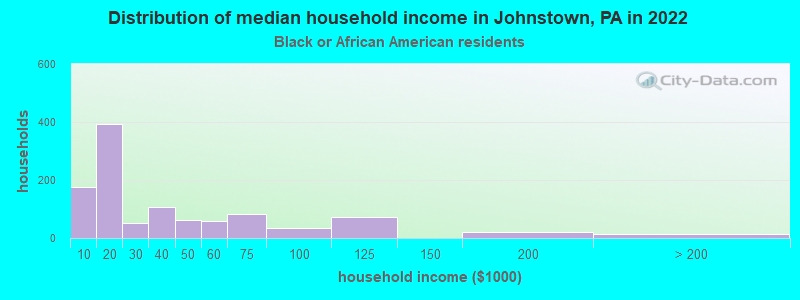
Household income for Black householders
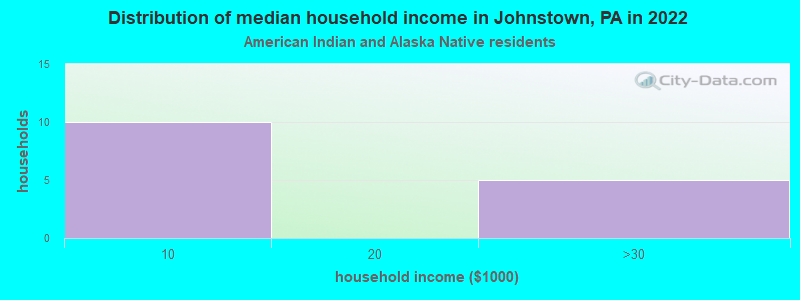
Household income for American Indian and Alaska Native householders
Household income for Asian householders
Household income for Some other race householders
Household income for Two or more races householders
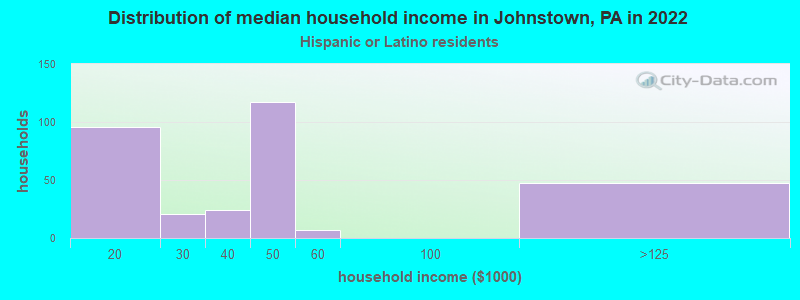
Household income for Hispanic or Latino race householders
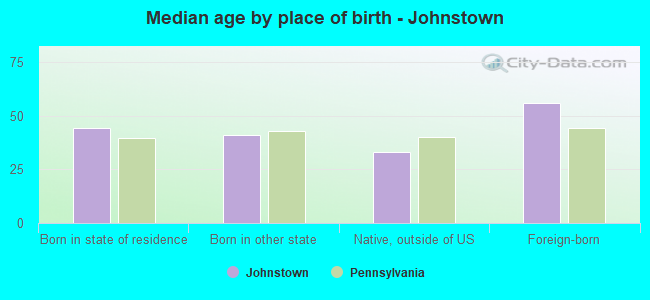
Median age by race in Johnstown
- 50.6Median age for White residents
- 49.7Males
- 51.9Females
- 33.2Median age for Black or African American residents
- 26.4Males
- 32.4Females
- 32.2Median age for American Indian / Alaska Native residents
- -714,583,332.6Males
- -577,519,379.3Females
- 35.1Median age for Asian residents
- -596,638,654.9Males
- 94.3Females
- -680,432,644.4Median age for Native Hawaiian / Pacific Islander residents
- -666,666,666.0Males
- -747,474,746.7Females
- 49.3Median age for Other race residents
- 19.0Males
- 47.8Females
- 16.2Median age for Two or more races residents
- 15.9Males
- 14.5Females
- 50.4Median age for White alone residents
- 49.6Males
- 51.4Females
- 32.5Median age for Hispanic or Latino residents
- 18.5Males
- 48.5Females
Owner/renter occupied households by race in Johnstown
- House owners and renters - White residents
- 4,00855.9%Owner occupied
- 3,16344.1%Renter occupied
- House owners and renters - Black or African American residents
- 19925.1%Owner occupied
- 59274.9%Renter occupied
- House owners and renters - American Indian / Alaska Native residents
- 19100.0%Renter occupied
- House owners and renters - Asian residents
- 6289.7%Owner occupied
- 710.3%Renter occupied
- House owners and renters - Other race residents
- 10564.3%Owner occupied
- 5835.7%Renter occupied
- House owners and renters - Two or more races residents
- 33545.1%Owner occupied
- 40754.9%Renter occupied
- House owners and renters - White alone residents
- 3,91955.2%Owner occupied
- 3,17544.8%Renter occupied
- House owners and renters - Hispanic or Latino residents
- 23454.2%Owner occupied
- 19845.8%Renter occupied
Language usage in Johnstown
- English speakers - Total
- 96.2% of residents of Johnstown speak English at home.
- 2.5% of residents speak Spanish at home
- 21949.8%Speak English very well
- 22150.2%Speak English less than very well
- 1.2% of residents speak other language at home
- 16578.6%Speak English very well
- 4521.4%Speak English less than very well
- English speakers - Born in the United States
- 94.6% of residents of Johnstown speak English at home.
- 4.5% of residents speak Spanish at home
- 13196.3%Speak English very well
- 53.7%Speak English less than very well
- 2.5% of residents speak other language at home
- 76100.0%Speak English very well
- English speakers - Native, born elsewhere
- 18.8% of residents of Johnstown speak English at home.
- 77.3% of residents speak Spanish at home
- 3535.4%Speak English very well
- 6464.6%Speak English less than very well
- English speakers - Foreign-born
- 21.7% of residents of Johnstown speak English at home.
- 18.8% of residents speak Spanish at home
- 1426.9%Speak English very well
- 3873.1%Speak English less than very well
- 52.3% of residents speak other language at home
- 9867.6%Speak English very well
- 4732.4%Speak English less than very well
White (Caucasian) - Speak only English
| Native: | 99.0% (12,405) |
| Foreign-born: | 20.0% (14) |
White (Caucasian) - Speak another language
| Native: | 0.9% (108) |
| Foreign-born: | 100.0% (70) |
Black or African American - Speak only English
| Native: | 97.8% (2,714) |
| Foreign-born: | 100.0% (11) |
Asian - Speak another language
| Native: | 100.0% (58) |
| Foreign-born: | 99.9% (20) |
Two or more races - Speak only English
| Native: | 91.8% (1,816) |
| Foreign-born: | 27.9% (45) |
Two or more races - Speak another language
| Native: | 6.4% (127) |
| Foreign-born: | 98.9% (159) |
White alone - Speak only English
| Native: | 99.3% (12,302) |
| Foreign-born: | 19.0% (14) |
White alone - Speak another language
| Native: | 0.7% (81) |
| Foreign-born: | 100.0% (76) |
Hispanic or Latino - Speak another language
| Native: | 31.7% (246) |
| Foreign-born: | 100.0% (72) |
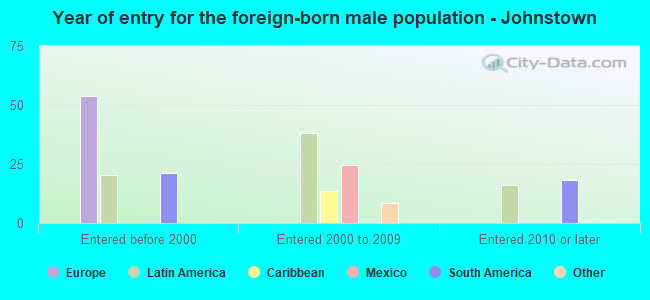
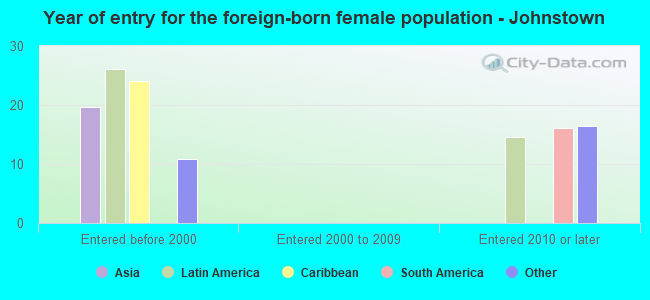
Foreign-born residents in Johnstown
230 residents are foreign born
| This city: | 1.3% |
| Pennsylvania: | 7.3% |
Marital status for residents in Johnstown
Marital status - White (Caucasian) population 15 years and over
- Males
- 38.6%Never married
- 36.4%Now married
- 4.1%Separated
- 3.7%Widowed
- 17.1%Divorced
- Females
- 35.3%Never married
- 31.4%Now married
- 4.3%Separated
- 13.9%Widowed
- 15.1%Divorced
Women who gave birth in the past 12 months
| Now married: | 51.8% (98) |
| Unmarried: | 48.2% (91) |
Women who did not give birth in the past 12 months
| Now married: | 29.1% (705) |
| Unmarried: | 70.9% (1,719) |
Marital status - Black or African American population 15 years and over
- Males
- 61.0%Never married
- 23.8%Now married
- 1.9%Separated
- 2.6%Widowed
- 10.7%Divorced
- Females
- 60.8%Never married
- 13.8%Now married
- 2.5%Separated
- 7.7%Widowed
- 15.1%Divorced
Women who gave birth in the past 12 months
| Now married: | 0.0% (0) |
| Unmarried: | 100.0% (34) |
Women who did not give birth in the past 12 months
| Now married: | 14.7% (92) |
| Unmarried: | 85.3% (537) |
Marital status - American Indian / Alaska Native population 15 years and over
- Males
- 100.0%Never married
- 0.0%Now married
- 0.0%Separated
- 0.0%Widowed
- 0.0%Divorced
- Females
- 0.0%Never married
- 53.3%Now married
- 46.7%Separated
- 0.0%Widowed
- 0.0%Divorced
Women who did not give birth in the past 12 months
| Now married: | 100.0% (13) |
| Unmarried: | 0.0% (0) |
Marital status - Asian population 15 years and over
- Males
- 0.0%Never married
- 100.0%Now married
- 0.0%Separated
- 0.0%Widowed
- 0.0%Divorced
- Females
- 0.0%Never married
- 35.0%Now married
- 0.0%Separated
- 65.0%Widowed
- 0.0%Divorced
Women who did not give birth in the past 12 months
| Now married: | 100.0% (7) |
| Unmarried: | 0.0% (0) |
Marital status - Other race population 15 years and over
- Males
- 60.9%Never married
- 25.0%Now married
- 0.0%Separated
- 0.0%Widowed
- 14.1%Divorced
- Females
- 76.7%Never married
- 1.7%Now married
- 0.0%Separated
- 21.5%Widowed
- 0.0%Divorced
Women who did not give birth in the past 12 months
| Now married: | 2.2% (4) |
| Unmarried: | 97.8% (165) |
Marital status - Two or more races population 15 years and over
- Males
- 52.8%Never married
- 34.9%Now married
- 7.4%Separated
- 0.0%Widowed
- 4.8%Divorced
- Females
- 58.0%Never married
- 19.4%Now married
- 7.5%Separated
- 1.1%Widowed
- 13.9%Divorced
Women who gave birth in the past 12 months
| Now married: | 0.0% (0) |
| Unmarried: | 100.0% (12) |
Women who did not give birth in the past 12 months
| Now married: | 25.6% (137) |
| Unmarried: | 74.4% (397) |
Marital status - White alone, not Hispanic / Latino population 15 years and over
- Males
- 38.4%Never married
- 36.6%Now married
- 4.2%Separated
- 3.5%Widowed
- 17.3%Divorced
- Females
- 34.9%Never married
- 31.7%Now married
- 4.3%Separated
- 14.1%Widowed
- 15.1%Divorced
Women who gave birth in the past 12 months
| Now married: | 51.8% (98) |
| Unmarried: | 48.2% (91) |
Women who did not give birth in the past 12 months
| Now married: | 29.2% (708) |
| Unmarried: | 70.8% (1,713) |
Marital status - Hispanic or Latino population 15 years and over
- Males
- 52.2%Never married
- 36.2%Now married
- 4.0%Separated
- 4.7%Widowed
- 3.0%Divorced
- Females
- 75.7%Never married
- 9.0%Now married
- 7.0%Separated
- 0.0%Widowed
- 8.3%Divorced
Women who did not give birth in the past 12 months
| Now married: | 1.5% (3) |
| Unmarried: | 98.5% (211) |
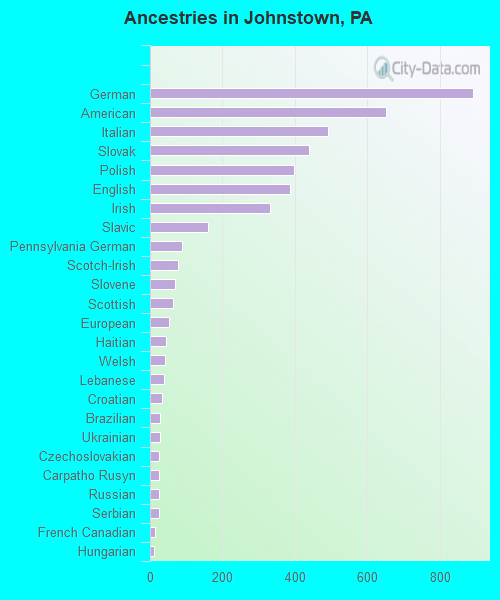
Ancestries in Johnstown

- 89212.3%German
- 6539.0%American
- 4916.8%Italian
- 4406.1%Slovak
- 3975.5%Polish
- 3875.3%English
- 3314.6%Irish
- 1602.2%Slavic
- 891.2%Pennsylvania German
- 781.1%Scotch-Irish
- 691.0%Slovene
- 630.9%Scottish
- 520.7%European
- 430.6%Haitian
- 420.6%Welsh
- 400.6%Lebanese
- 330.5%Croatian
- 280.4%Brazilian
- 270.4%Ukrainian
- 260.4%Czechoslovakian
- 240.3%Carpatho Rusyn
- 240.3%Russian
- 240.3%Serbian
- 130.2%French Canadian
- 120.2%Hungarian
- 110.2%French
- 100.1%British
- 100.1%Norwegian
- 100.1%Swedish
- 80.1%Moroccan
- 40.06%Dutch
- 40.06%Greek
- 30.04%Yugoslavian
- 20.03%Eastern European
- 20.03%African
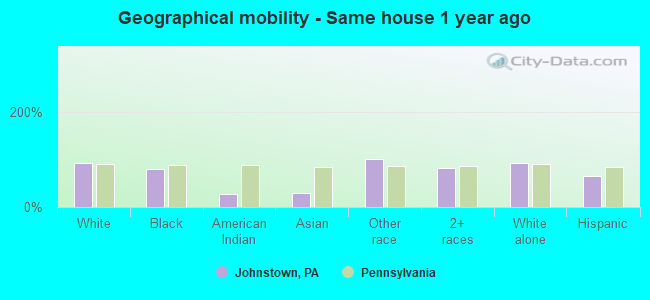
Geographical mobility in Johnstown

- Same house 1 year ago
- 11,72191.7%White (Caucasian)
- 1,85279.7%Black or African American
- 1227.9%American Indian / Alaska Native
- 2128.6%Asian
- 387100.0%Other race
- 2,06581.0%Two or more races
- 11,64192.0%White alone, not Hispanic / Latino
- 54365.0%Hispanic or Latino
-
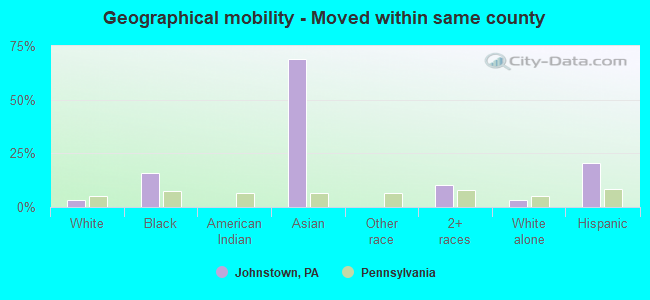
- Moved within same county
- 4363.4%White / Caucasian
- 36615.7%Black or African American
- 5169.1%Asian
- 25710.1%Two or more races
- 4363.4%White alone, not Hispanic / Latino
- 16920.3%Hispanic or Latino
-
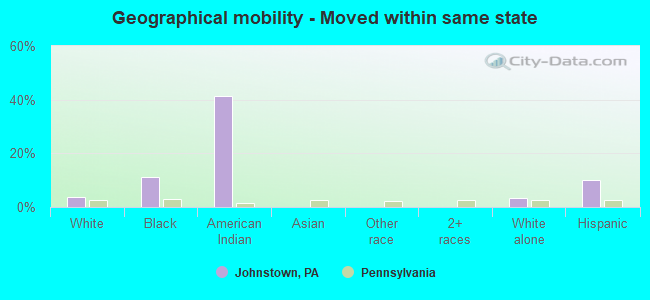
- Moved within same state
- 4933.9%White / Caucasian
- 25711.0%Black or African American
- 1741.4%American Indian / Alaska Native
- 4393.5%White alone, not Hispanic / Latino
- 8410.1%Hispanic or Latino
-
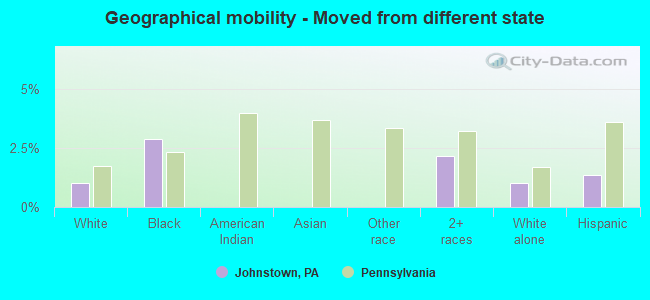
- Moved from different state
- 1291.0%White / Caucasian
- 672.9%Black or African American
- 542.1%Two or more races
- 1291.0%White alone, not Hispanic / Latino
- 111.4%Hispanic or Latino
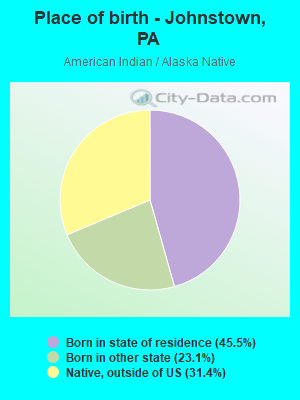
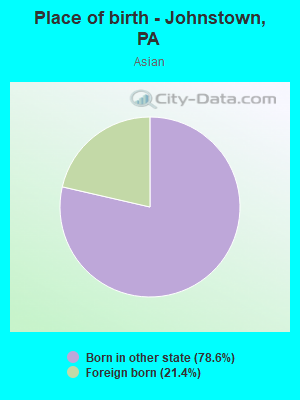
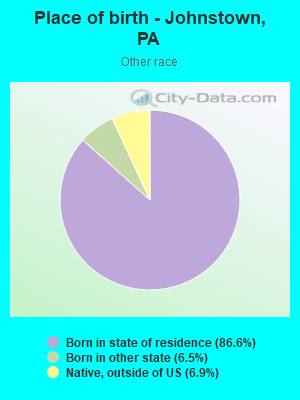
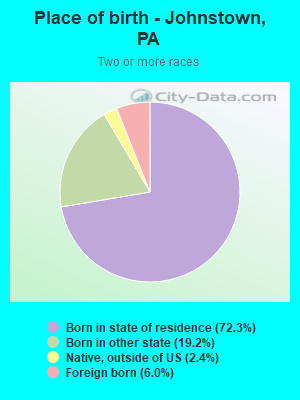
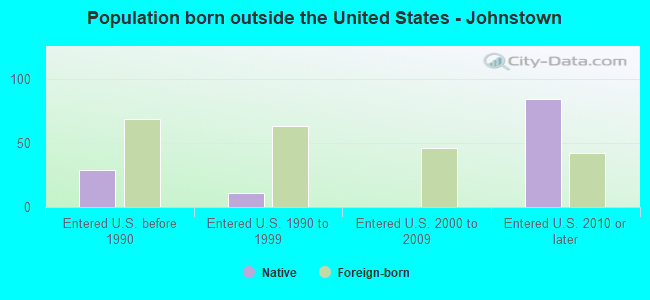
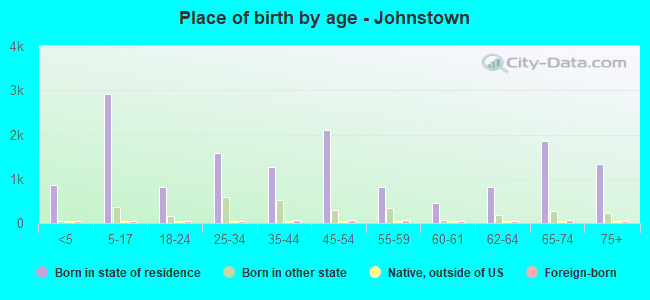
Children Nativity (place of birth) in Johnstown
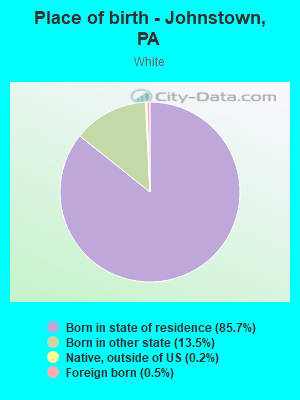
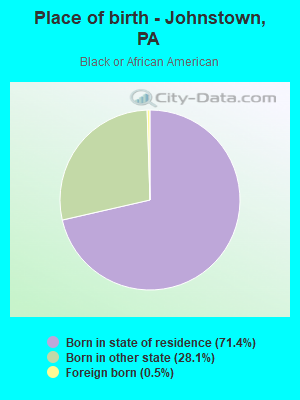
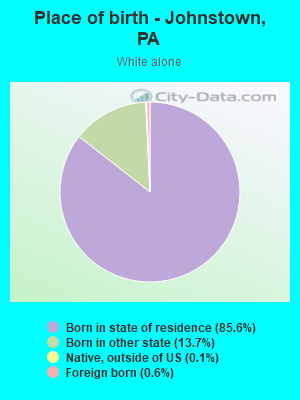
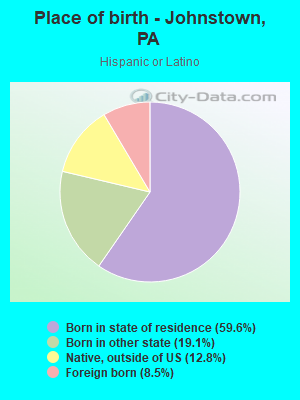
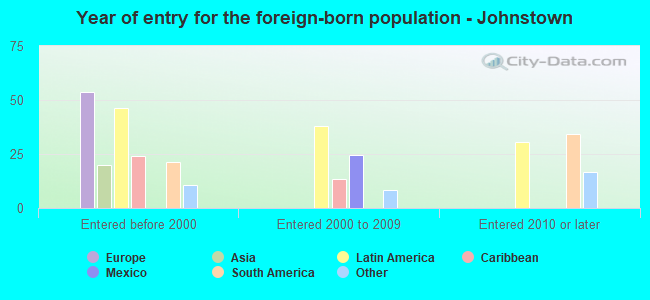
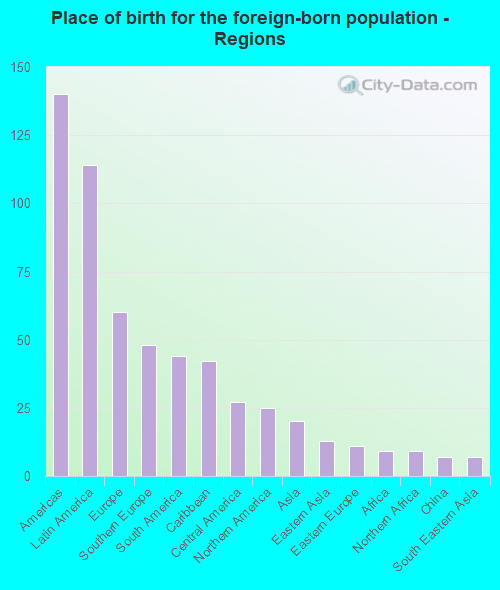
Place of birth for residents in Johnstown
![Place of birth for the foreign-born population - Regions]()
- 140Americas
- 114Latin America
- 60Europe
- 48Southern Europe
- 44South America
- 42Caribbean
- 27Central America
- 25Northern America
- 20Asia
- 13Eastern Asia
- 11Eastern Europe
- 9Africa
- 9Northern Africa
- 7China
- 7South Eastern Asia
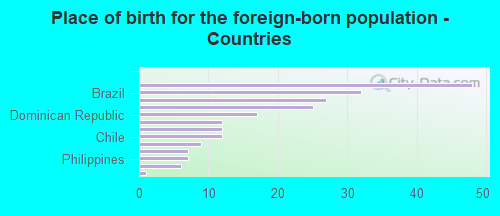
![Place of birth for the foreign-born population - Countries]()
- 48Italy
- 32Brazil
- 27Mexico
- 25Canada
- 17Dominican Republic
- 12Haiti
- 12Trinidad and Tobago
- 12Chile
- 9Morocco
- 7Hong Kong
- 7Philippines
- 6Korea
- 1Poland
Grandparents responsible for own grandchildren in Johnstown
Zip codes: 15901.