Races in Jollyville, Texas (TX) Detailed Stats
Latest news about races in Jollyville, TX collected exclusively by city-data.com from local newspapers, TV, and radio stations
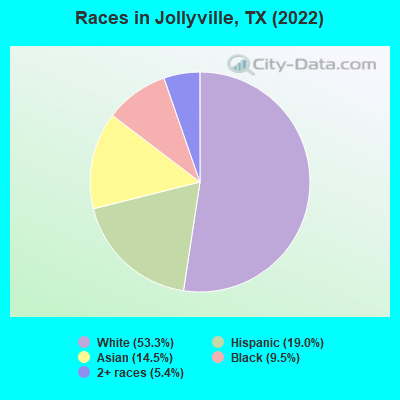
According to 2022 data, the most numerous races in Jollyville, TX are Hispanic (3,878 residents), White alone (10,897 residents), and Black alone (1,939 residents). 76.2% of Jollyville residents speak English at home. 14.1% of Jollyville, TX residents are foreign-born (6.7% born in Asia, 3.9% born in Latin America, 1.8% born in Europe, 1.5% born in Africa), which is 20.4% less than the foreign-born rate of 17.0% across the entire state of Texas.
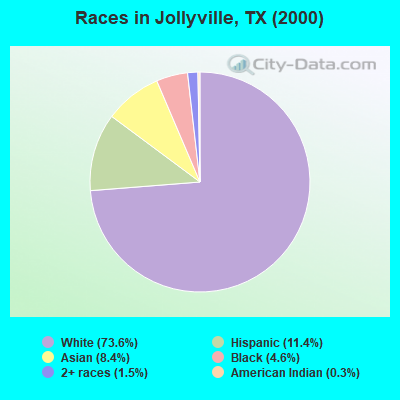
Race distribution in Jollyville
2000 2022
10,933,313 52.4% White alone 6,669,666 32.0% Hispanic 2,364,255 11.3% Black alone 554,445 2.7% Asian alone 230,567 1.1% Two or more races 68,859 0.3% American Indian alone 19,958 0.10% Other race alone 10,757 0.05% Native Hawaiian and Other
12,070,642 40.2% Hispanic 11,683,430 38.9% White alone 3,508,706 11.7% Black alone 1,608,173 5.4% Asian alone 956,560 3.2% Two or more races 125,763 0.4% Other race alone 47,023 0.2% American Indian alone 29,275 0.10% Native Hawaiian and Other
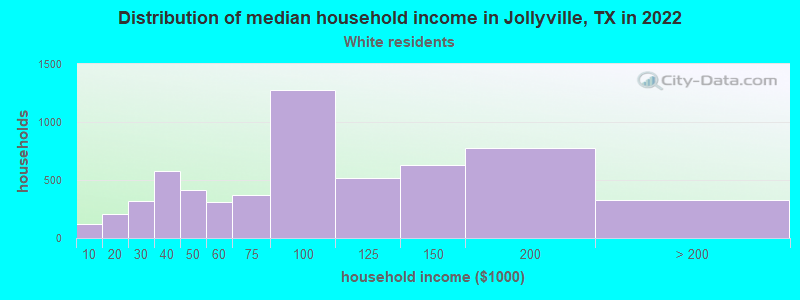
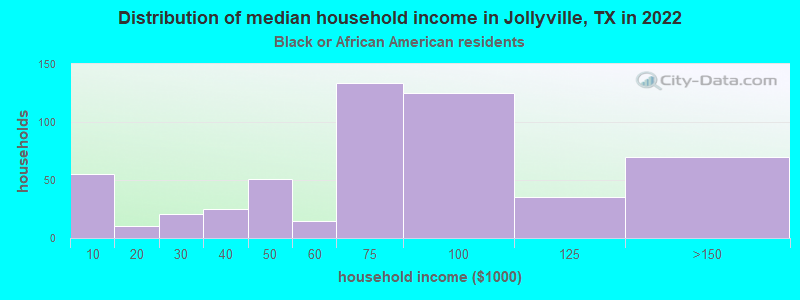
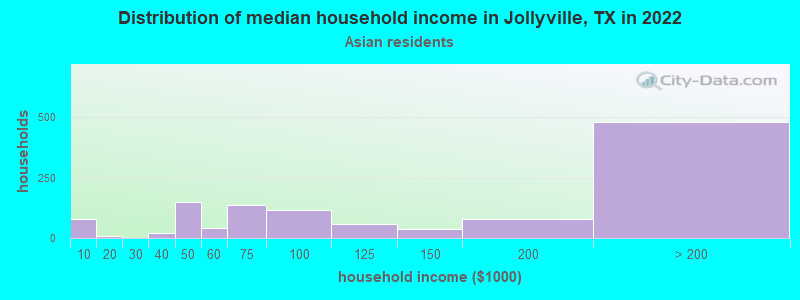
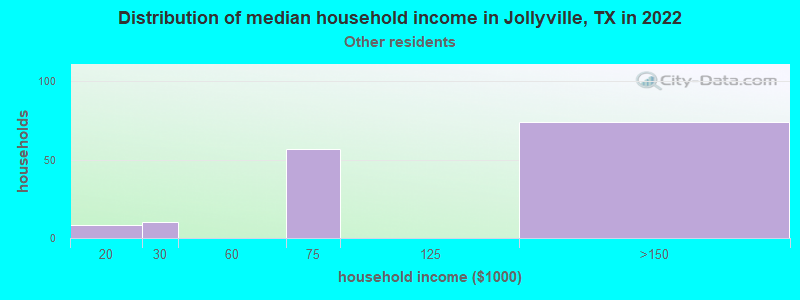
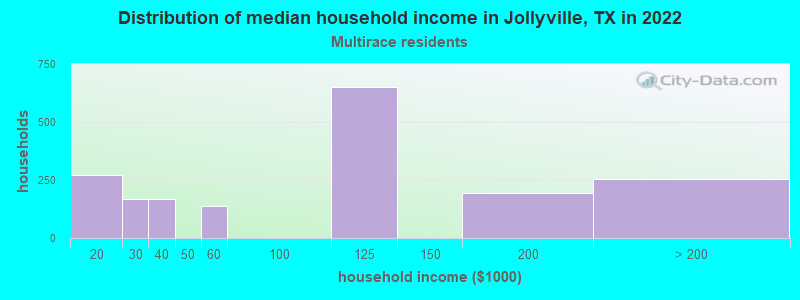
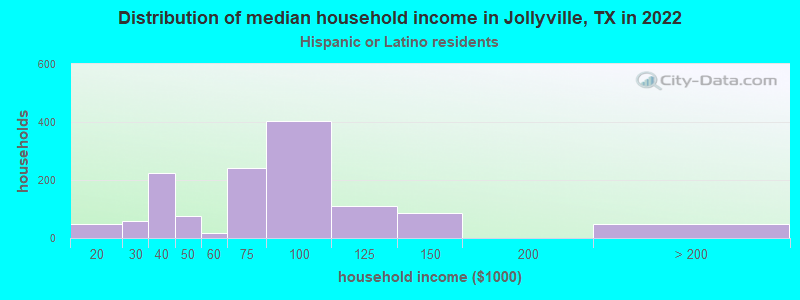
Income and house value in Jollyville Median household income in 2022 $97,206 White non-Hispanic householders$102,768 Black householdersover $200,000 American Indian and Alaska Native householders$102,649 Asian householders$94,876 Some other race householders$65,965 Two or more races householders$85,276 Hispanic or Latino race householdersMedian 2022 house value $511,619 White Non-Hispanic householders$556,571 Black or African American householders$247,619 American Indian or Alaska Native householders $515,047 Asian householders$447,238 Some other race householders$660,571 Two or more races householders$474,285 Hispanic or Latino householders
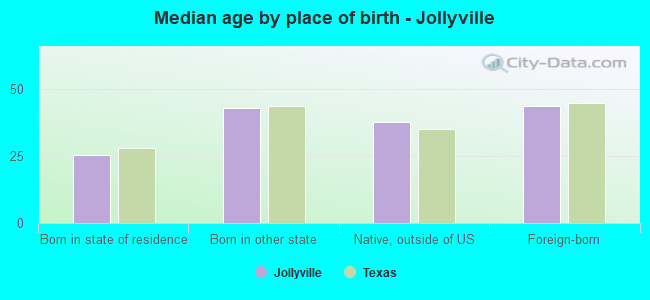
Median age by race in Jollyville
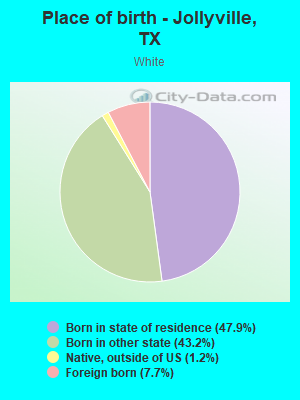
36.7 Median age for White residents36.1 37.3 25.2 Median age for Black or African American residents44.4 23.0 32.7 Median age for American Indian / Alaska Native residents43.2 Median age for Asian residents35.6 47.4 28.0 Median age for Other race residents33.5 26.5 21.4 Median age for Two or more races residents18.6 34.2 38.7 Median age for White alone residents35.7 41.9 29.1 Median age for Hispanic or Latino residents32.6 27.6
Owner/renter occupied households by race in Jollyville
House owners and renters - White residents 3,188 55.9% Owner occupied2,518 44.1% Renter occupiedHouse owners and renters - Black or African American residents 145 25.3% Owner occupied427 74.7% Renter occupiedHouse owners and renters - American Indian / Alaska Native residents 14 100.0% Renter occupiedHouse owners and renters - Asian residents 931 77.4% Owner occupied271 22.6% Renter occupiedHouse owners and renters - Other race residents 14 31.6% Owner occupied30 68.4% Renter occupiedHouse owners and renters - Two or more races residents 637 41.5% Owner occupied899 58.5% Renter occupiedHouse owners and renters - White alone residents 3,034 58.5% Owner occupied2,155 41.5% Renter occupiedHouse owners and renters - Hispanic or Latino residents 472 38.8% Owner occupied743 61.2% Renter occupied
Language usage in Jollyville
English speakers - Total 76.2% of residents of Jollyville speak English at home.
11.1% of residents speak Spanish at home 1,577 72.8% Speak English very well588 27.2% Speak English less than very well14.9% of residents speak other language at home 1,802 62.4% Speak English very well1,088 37.6% Speak English less than very well
English speakers - Born in the United States 94.3% of residents of Jollyville speak English at home.
2.1% of residents speak Spanish at home 147 100.0% Speak English very well3.7% of residents speak other language at home 203 79.0% Speak English very well54 21.0% Speak English less than very well
English speakers - Native, born elsewhere 66.8% of residents of Jollyville speak English at home.
23.2% of residents speak Spanish at home 96 100.0% Speak English very well6.8% of residents speak other language at home 28 100.0% Speak English very well
English speakers - Foreign-born 24.2% of residents of Jollyville speak English at home.
22.0% of residents speak Spanish at home 326 40.1% Speak English very well486 59.9% Speak English less than very well68.6% of residents speak other language at home 1,579 62.4% Speak English very well951 37.6% Speak English less than very well
White (Caucasian) - Speak only English Native:
96.3% (10,845)Foreign-born:
32.6% (318)
White (Caucasian) - Speak another language Native:
7.5% (844)Foreign-born:
72.5% (707)
Black or African American - Speak only English Native:
92.7% (1,232)Foreign-born:
44.8% (270)
Black or African American - Speak another language Native:
8.4% (112)Foreign-born:
52.1% (314)
Asian - Speak only English Native:
57.8% (595)Foreign-born:
11.0% (214)
Asian - Speak another language Native:
44.0% (453)Foreign-born:
89.5% (1,736)
Other race - Speak another language Native:
12.5% (15)Foreign-born:
92.4% (73)
White alone - Speak only English Native:
98.1% (9,734)Foreign-born:
36.5% (243)
White alone - Speak another language Native:
2.1% (205)Foreign-born:
61.2% (408)
Hispanic or Latino - Speak only English Native:
75.4% (2,213)Foreign-born:
8.9% (80)
Hispanic or Latino - Speak another language Native:
33.8% (993)Foreign-born:
91.9% (832)
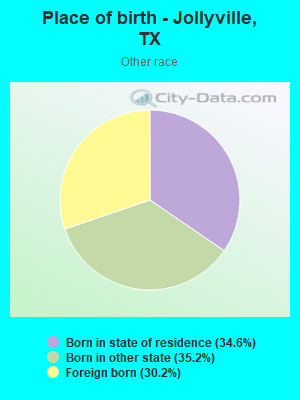
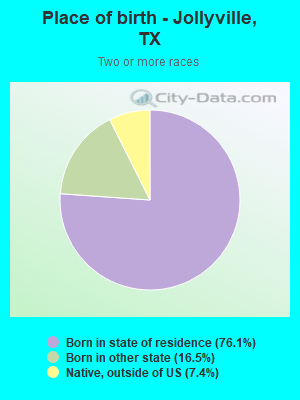
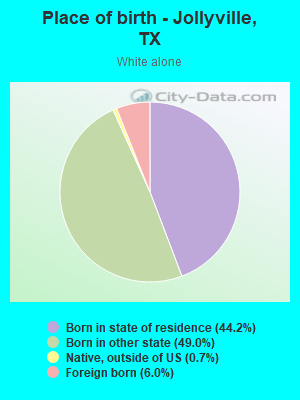
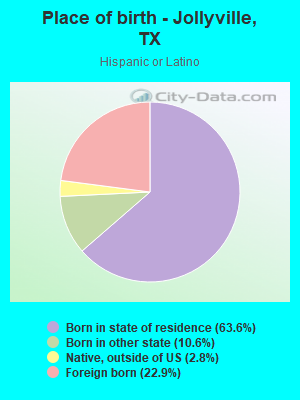
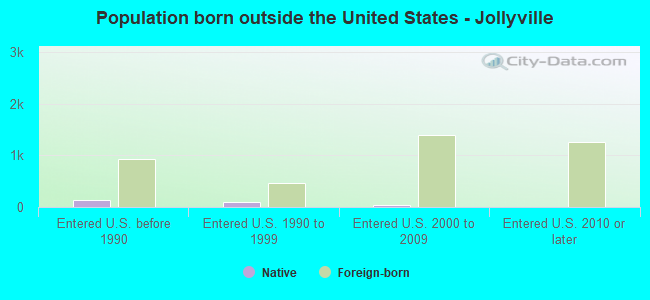
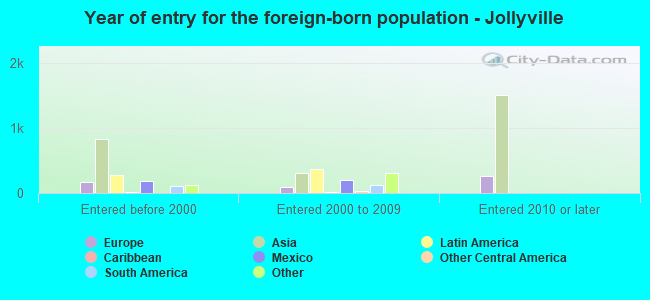
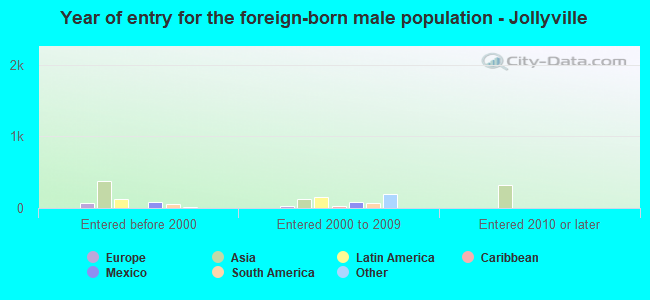
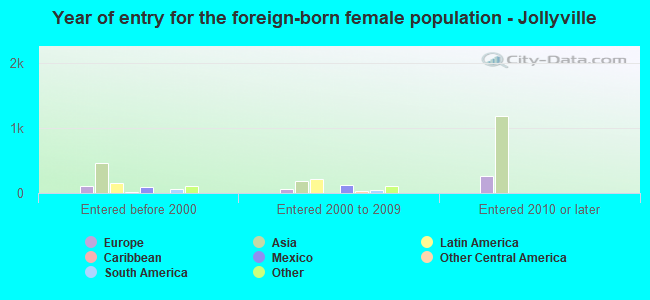
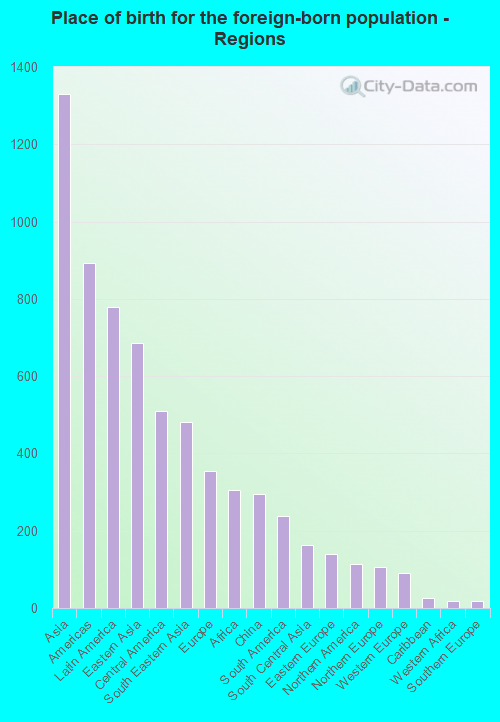
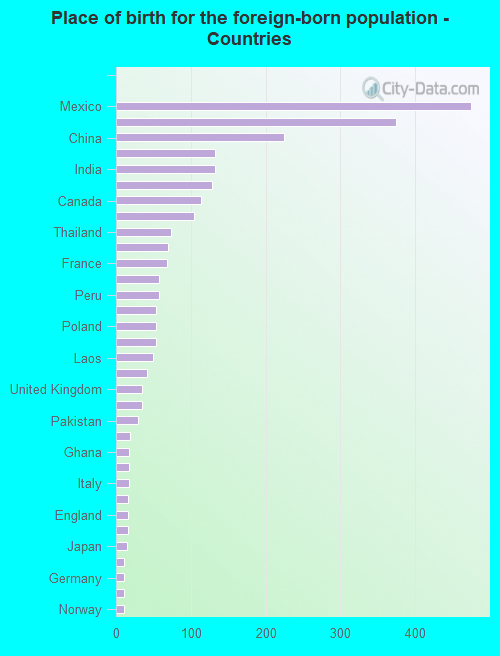
Foreign-born residents in Jollyville 2,884 residents are foreign born (6.7% Asia , 3.9% Latin America , 1.8% Europe , 1.5% Africa ).
This city:
14.1%Texas:
100.0%
Marital status for residents in Jollyville Marital status - White (Caucasian) population 15 years and over
Males 33.3% Never married53.2% Now married2.3% Separated0.6% Widowed10.6% DivorcedFemales 30.9% Never married44.5% Now married3.0% Separated3.2% Widowed18.5% DivorcedWomen who gave birth in the past 12 months Now married:
58.7% (194)Unmarried:
41.3% (136)
Women who did not give birth in the past 12 months Now married:
46.5% (1,744)Unmarried:
53.5% (2,004)
Marital status - Black or African American population 15 years and over
Males 23.6% Never married70.9% Now married0.0% Separated0.0% Widowed5.5% DivorcedFemales 59.2% Never married31.1% Now married0.0% Separated4.3% Widowed5.5% DivorcedWomen who gave birth in the past 12 months Now married:
0.0% (0)Unmarried:
100.0% (39)
Women who did not give birth in the past 12 months Now married:
46.9% (229)Unmarried:
53.1% (259)
Marital status - Asian population 15 years and over
Males 49.8% Never married46.0% Now married0.0% Separated0.0% Widowed4.2% DivorcedFemales 27.9% Never married54.7% Now married0.0% Separated2.1% Widowed15.4% DivorcedWomen who gave birth in the past 12 months Now married:
100.0% (75)Unmarried:
0.0% (0)
Women who did not give birth in the past 12 months Now married:
52.3% (461)Unmarried:
47.7% (422)
Marital status - Other race population 15 years and over
Males 53.9% Never married46.1% Now married0.0% Separated0.0% Widowed0.0% DivorcedFemales 0.0% Never married100.0% Now married0.0% Separated0.0% Widowed0.0% DivorcedWomen who gave birth in the past 12 months Now married:
100.0% (9)Unmarried:
0.0% (0)
Women who did not give birth in the past 12 months Now married:
84.5% (104)Unmarried:
15.5% (19)
Marital status - Two or more races population 15 years and over
Males 50.0% Never married14.3% Now married0.0% Separated0.0% Widowed35.7% DivorcedFemales 61.2% Never married17.5% Now married9.2% Separated0.0% Widowed12.1% DivorcedWomen who did not give birth in the past 12 months Now married:
29.4% (452)Unmarried:
70.6% (1,087)
Marital status - White alone, not Hispanic / Latino population 15 years and over
Males 34.4% Never married50.7% Now married2.6% Separated0.7% Widowed11.6% DivorcedFemales 28.8% Never married44.3% Now married3.4% Separated3.2% Widowed20.3% DivorcedWomen who gave birth in the past 12 months Now married:
79.7% (165)Unmarried:
20.3% (42)
Women who did not give birth in the past 12 months Now married:
46.5% (1,363)Unmarried:
53.5% (1,570)
Marital status - Hispanic or Latino population 15 years and over
Males 36.2% Never married61.4% Now married0.0% Separated0.0% Widowed2.4% DivorcedFemales 37.0% Never married46.4% Now married4.0% Separated2.8% Widowed9.7% DivorcedWomen who gave birth in the past 12 months Now married:
31.0% (61)Unmarried:
69.0% (135)
Women who did not give birth in the past 12 months Now married:
54.5% (799)Unmarried:
45.5% (667)
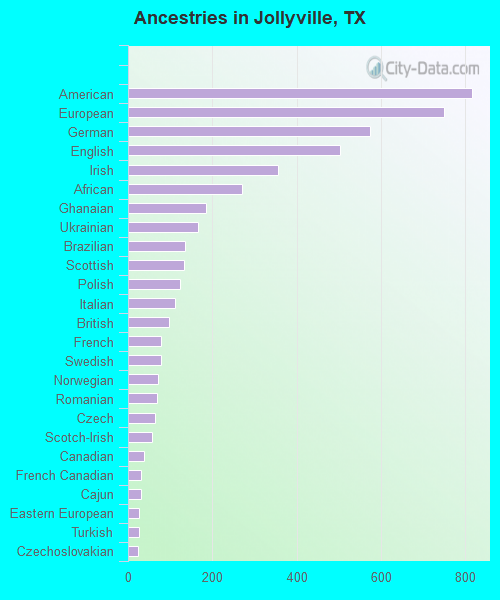
Ancestries in Jollyville
816 8.2% American750 7.5% European574 5.8% German503 5.1% English355 3.6% Irish270 2.7% African184 1.9% Ghanaian165 1.7% Ukrainian135 1.4% Brazilian132 1.3% Scottish123 1.2% Polish112 1.1% Italian97 1.0% British79 0.8% French78 0.8% Swedish72 0.7% Norwegian70 0.7% Romanian64 0.6% Czech58 0.6% Scotch-Irish39 0.4% Canadian32 0.3% French Canadian30 0.3% Cajun27 0.3% Eastern European27 0.3% Turkish24 0.2% Czechoslovakian19 0.2% Greek18 0.2% Finnish18 0.2% Portuguese16 0.2% Basque15 0.2% Dutch12 0.1% Swiss
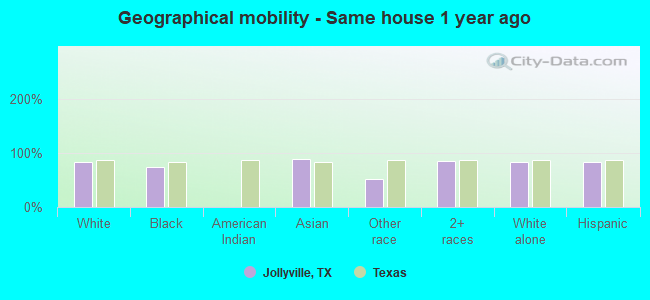
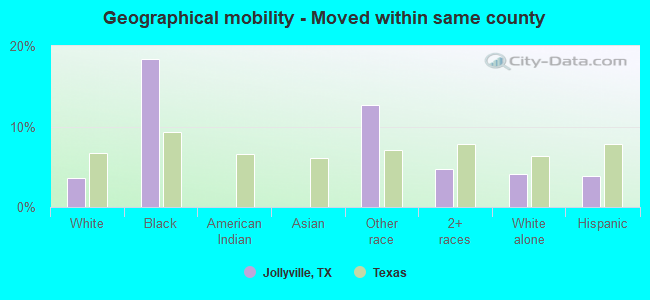
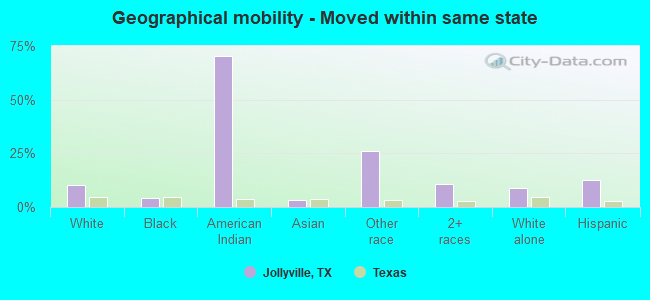
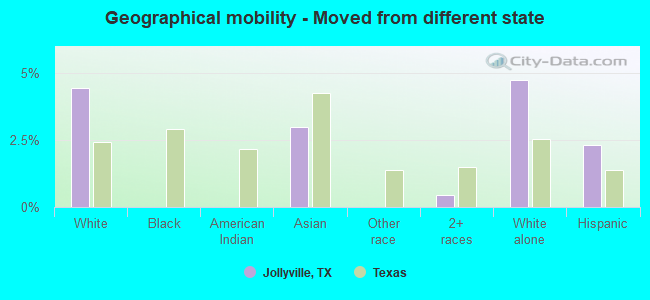
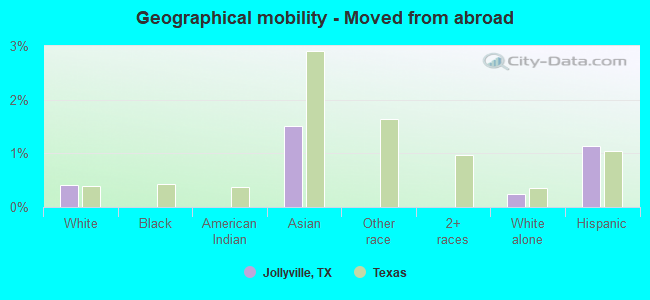
Geographical mobility in Jollyville Same house 1 year ago 10,248 82.9% White (Caucasian)1,324 73.9% Black or African American2,641 88.5% Asian156 52.4% Other race4,101 84.0% Two or more races8,925 82.4% White alone, not Hispanic / Latino3,186 83.0% Hispanic or LatinoMoved within same county 448 3.6% White / Caucasian329 18.4% Black or African American38 12.7% Other race230 4.7% Two or more races445 4.1% White alone, not Hispanic / Latino148 3.8% Hispanic or LatinoMoved within same state 1,270 10.3% White / Caucasian71 4.0% Black or African American14 70.3% American Indian / Alaska Native103 3.4% Asian78 26.3% Other race520 10.7% Two or more races967 8.9% White alone, not Hispanic / Latino491 12.8% Hispanic or LatinoMoved from different state 548 4.4% White / Caucasian89 3.0% Asian21 0.4% Two or more races512 4.7% White alone, not Hispanic / Latino89 2.3% Hispanic or LatinoMoved from abroad 51 0.4% White45 1.5% Asian26 0.2% White alone, not Hispanic / Latino44 1.1% Hispanic or Latino
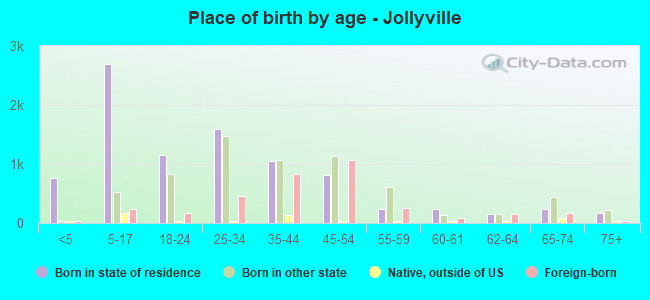
Children Nativity (place of birth) in Jollyville
Children under 6 years - Living with two parents Both parents native 592 100.0% NativeBoth parents foreign-born 114 89.3% Native14 10.7% Foreign-bornOne native, one foreign-born parent 84 100.0% NativeChildren under 6 years - Living with one parent Native parent 163 100.0% NativeChildren 6 to 17 years - Living with two parents Both parents native 1,367 100.0% NativeBoth parents foreign-born 440 62.7% Native262 37.3% Foreign-bornOne native, one foreign-born parent 317 100.0% NativeChildren 6 to 17 years - Living with one parent Native parent 998 100.0% NativeForeign-born parent 83 47.1% Native93 52.9% Foreign-born
Grandparents responsible for own grandchildren in Jollyville
Grandparents (30 to 59 years) White / Caucasian 91 100.0% Not responsible for grandchildrenAsian 26 100.0% Not responsible for grandchildrenWhite alone, not Hispanic / Latino 157 100.0% Not responsible for grandchildrenGrandparents (60 years and over) White / Caucasian 24 48.2% Responsible for grandchildren26 51.8% Not responsible for grandchildrenAsian 37 100.0% Responsible for grandchildrenWhite alone, not Hispanic / Latino 31 47.3% Responsible for grandchildren34 52.7% Not responsible for grandchildren